Visual Compass Methods for Robot Navigation Andrew Burke Andrew Vardy Faculty of Engineering Memorial University of Newfoundland St. John’s A1B 3X5, Canada.
[email protected] [email protected]
Abstract A compass based purely on visual information would be a useful navigational tool for robots working in environments where magnetic and GPS compass information is not available. A visual compass processes a pair of panoramic images taken from two different positions and estimates the orientation change between them. We present in this paper several well known algorithms useful for the development of a visual compass. These methods include a search for the minimum image distance in orientation space, a refined search method, and a frequencydomain approach known as phase correlation. A comparison on efficiency and effectiveness of these algorithms and their variations is given. We find that the refined search method exhibits improved efficiency with only a marginal impact on accuracy. The 2-D phase correlation method performed almost as well for small distances, but for large distances, the accuracy decreased significantly. The 1-D phase correlation performs better with respect to both accuracy and efficiency.
Introduction The displacement of a robot from a goal position consists of translation and rotation components. A large number of homing algorithms have been proposed to recover one or both of these components from a comparison of the currently viewed image with an image taken at the goal, known as the snapshot image (see reviews by Vardy and Möller, 2005; Zeil et al., 2003). Many of these algorithms assume that the rotation component is zero, and proceed to recover the approximate angle of the translation component. Incrementally moving in the direction of this angle will lead the agent to the goal. Such algorithms rely on the use of a magnetic compass to recover the rotation angle and counter-rotate the image. However, magnetic compasses are unreliable indoors, and other mechanical solutions inevitably drift. In this paper we investigate several simple techniques for recovering the rotational component of motion from vision. For panoramic images, the rotational component of motion leads to a horizontal shift in the image. Thus, the angle of rotation can be recovered for pure rotation by finding the horizontal shift leading to the smallest difference between original and rotated images (see figures 1(a) and (b)). However, the translational component of motion will introduce regions of contraction and expansion in the image which may prevent the minimum difference from reaching zero. Nevertheless, it has been found that in the presence of a translational component, the image difference function for varying rotation angles retains a global minimum at the correct rotation angle (Zeil et al., 2003; Labrosse, 2004). Thus, a linear search for the minimum difference can serve as an effective visual compass. Here, we compare this linear search method with a sample-based search techniques, 2-D phase correlation techniques, and 1-D phase correlation techniques. Using a database of panoramic images collected in an indoor environment, we assess whether these techniques can be used to estimate rotation in a way that is more efficient and/or more accurate than linear search. In addition to the linear search based algorithms referred to above, other authors have proposed various methods to estimate rotation from vision. Röfer's method applies a special-purpose optic flow algorithm to estimate disparities between the two images (Röfer, 1997). For pure translation, half of the disparities should be negative, while the other half should be positive Röfer's algorithm corrects for rotation by finding the quantity that can be subtracted from the disparities to make this so, and then converting this quantity to a rotation angle. This approach may be problematic when there are significant errors or omissions in the optic flow field. Franz et. al incorporate a search for rotation in their image warping algorithm (Franz et. al, 1998). This method warps the current image for a range of putative displacement vectors and rotations, and uses the difference between the current image and the snapshot image to find the true displacement vector and rotation. This algorithm works reliably, but is outperformed by certain optic flow based
1
techniques (Vardy and Möller, 2005). These techniques rely on the assumption of small image shifts, and are therefore not suitable for the estimation of rotation. In the next section we present the algorithms employed here to estimate rotation from vision. We then provide experimental results on the application of these algorithms to a database of images. Finally, we conclude with a discussion on the merits of these algorithms and a description of future research directions.
Difference Functions The distance between two images can be obtained by summing the squares of all pixel-by-pixel differences. We define a difference function as the distance between two images over the space of all possible rotations. The minimum of the difference function is the most likely angle of rotation between the two images. It should be noted that the difference function between an image and a rotated version of itself will have a zero difference value at the angle of rotation. In general, the minimum of a difference function will have a non-zero value due to the translation in space between the two captured positions.
Algorithms Investigated Several algorithms were investigated: the linear search algorithm, the 2-D phase correlation algorithm, two 1-D phase correlation algorithms, and the sample search algorithm. Improvements and variations of these algorithms were also investigated.
Linear Search The visual compass technique described in (Labrosse, 2004) was used as the baseline for these experiments. In the linear search method, the current image is rotated, one column at a time, and the difference against the reference image is calculated. When the smallest image difference is found, the corresponding angular difference between the two images can be directly obtained. Thus, this method performs a linear search for the minimum of the difference function.
Phase Correlation In isolation from the translation component of motion, the rotation component causes a horizontal image shift. The phase correlation method (Kuglin and Hines, 1975) takes advantage of the fact that a signal shifted in the time domain corresponds with a multiplication by a complex exponential in the frequency domain. The method described below extracts this complex exponential, and transforms it back into the time domain to obtain the signal shift. 1. The Fourier transform of both images (ia, ib) is obtained (Ia, Ib). 2. The conjugate of the second image is calculated (Ib*). 3. The images are multiplied together (Ia Ib*). 4. The result is normalized: N = (Ia Ib*/| Ia Ib*|). 5. The inverse Fourier transform of the result is calculated: PC = F-1(N). The result of this process is the time domain image PC that ideally contains a maximum point (represented by a white dot). The location of this maximum gives the orientation difference between the two images.
1-D Phase Correlation - Row Average The maximum in the image PC referred to above may be shifted both vertically and horizontally from the origin. However, it is the horizontal shift which corresponds with the orientation change in a panoramic image. Therefore, we tested the application of phase correlation in 1-D on the rows of the image. Ideally, most rows will be shifted by the same angle which we can obtain by averaging the maximum position for all computed PC images. The procedure operates as follows: 1. Treat each row of each image as a separate one dimensional signal. 2. Perform the phase correlation algorithm on each pair of rows. 3. Calculate the angle for the phase correlation result of the pair of rows. 4. Calculate the average angle over all pairs of rows.
2
The number of calculations in this procedure can be reduced by excluding every nth row. Reducing the number of rows used will improve the overall time required to perform the calculation, but may decrease the overall accuracy of this method.
1-D Phase Correlation - Row Sum We conjectured that the PC images produced by the previous method might exhibit a more stable maximum value if added together. Thus we tested the following method: 1. Treat each row of each image as a separate one dimensional signal. 2. Perform the phase correlation algorithm on each pair of rows. 3. Sum each of the rows. The location of the maximum pixel value in the resultant vector indicates orientation difference between the two images. As was discussed in the 1-D Phase Correlation – Row Average section, the number of rows used for the calculation can be reduced to improve the calculation time, at the sacrifice of accuracy.
Sample Search The linear search method can be greatly improved upon by calculating the difference at large intervals instead of at every single column. It repeats this process using smaller intervals, narrowing down the search space at each iteration of the algorithm. The detailed algorithm is: 1. Set “searchSpace” to 360. 2. Calculate the difference between the two images. 3. Rotate by a set interval (for example: 36). 4. Repeat 2 and 3 until the image has rotated “searchSpace” degrees, recording the minimum value of the difference function. 5. Set searchSpace to be 2 times the rotation interval (for example, 72). 6. Repeat 2 through 5, with a lower rotation interval. The result achieved after a few iterations of the algorithm is the minimum point of the difference function, but with far fewer calculations than linear search method. If the interval to rotate by is set small enough, the overall error of the result will be low. If the interval is set high (90 degrees or more), the search could easily get stuck in local optima for interval values smaller than 90 degrees. The error depends on the rotation interval and the number of iterations of steps 2 through 6. If, for example, only one pass is done and the interval is set to 10 degrees, the max error is 10 degrees. This is because the min point that it finds will be no more than 10 degrees away from the two surrounding points. It is likely, however, that the maximum error will be no higher than 5 degrees, as 5 degrees is the midpoint between the min point and either of the surrounding points.
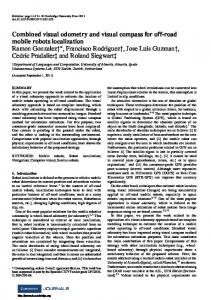
Results Several tests were conducted on a database of images taken in an indoor environment. The database consisted of a grid of images taken 30 cm apart. No special preparations were taken to make portions of the room stand out or to bias the results of the algorithms. Each algorithm was tested on all image pairs in a 9x9 database of images. One image from each image pair was rotated 4 separate times to introduce rotational shifts between the images in the image pair. A sample image pair is given in Figure 1.
3
Figure 1: Sample Image Pair. Figure 1a shows a reference image. Figure 1b shows an image that contains both translation and rotation when compared to the reference image. The results displayed in table 1 show that all algorithms tested yield similar average error, but varying degrees of average time. The linear search algorithm performs poorly with respect to time, but it yields an average accuracy. Algorithm Name Linear Search 2-D Phase Correlation 2-D Phase Correlation (with output filtering) 1-D Phase Correlation Row Average (every row) 1-D Phase Correlation Row Average (n = 2) 1-D Phase Correlation Row Average (n = 5) 1-D Phase Correlation Row Average (n = 10) 1-D Phase Correlation Row Sum (every row) 1-D Phase Correlation Row Sum (n = 2) 1-D Phase Correlation Row Sum (n = 5) 1-D Phase Correlation Row Sum (n = 10) Sample Search (3 Divisions, 3 Iterations) Sample Search (4 Divisions, 4 Iterations) Sample Search (5 Divisions, 5 Iterations) Sample Search (6 Divisions, 3 Iterations) Sample Search (6 Divisions, 5 Iterations)
Average Error (Degrees) 5.1727 5.0793 5.0793 4.5727 5.0616 6.1307 6.8384 4.6613 4.7236 5.8010 6.4642 7.0232 5.9633 6.1893 5.2641 5.2645
Average Execution Time (Seconds) 0.0169 0.0039 0.0046 0.0030 0.0015 0.0006 0.0003 0.0029 0.0014 0.0006 0.0003 0.0012 0.0018 0.0026 0.0018 0.0031
Table 1: Summary of results on a 9x9 image set. ‘n’ denotes that every ‘nth’ row was used for the test. The 2-D phase correlation method has a negligible improvement in accuracy over the linear search algorithm, but performs significantly better with respect to time. It was believed that using a low pass filter to attenuate the peaks of all high value pixels in the phase correlation image could result in an improvement in accuracy due to the filtering out of
4
peaks caused by noise. The data indicates that the accuracy does not change, but the execution time increases due to the extra filtering operation. The highest level of accuracy observed was with the 1-D phase correlation algorithms. The average execution time for these algorithms is slightly better than the 2-D phase correlation algorithm. Reducing the number of rows used resulted in a significant reduction of time. The results show a linear correlation between the number of rows used and the time taken to perform the calculation. Using every second row reduced the time by 1/2. Similarly, using every tenth row reduced the time by a factor of 10. Reducing the number of rows used reduces the accuracy of the result by a slight amount. Several tests were performed on the sample search algorithm. Varying degrees of error and time were observed as the number of divisions and iterations used in the search were altered. The accuracy for all cases of sample search tested was not as high as the 2-D phase correlation algorithms, but the average time improved significantly. The average execution time was higher than 1-D phase correlation techniques that exhibited a comparable amount of accuracy.
Conclusions A large number of algorithms have been developed for recovering rotational information from a pair of images. The accuracy and execution times observed in this study indicate that using visual techniques to develop a visual compass can be done in a practical manner. Several algorithms were tested, and all performed with a reasonable accuracy. The execution time varied significantly between the various algorithms. Using 1-D phase correlation algorithms without reducing the number of rows used will result in a fairly good execution time and accuracy. If time execution is a critical factor for a particular application, the number of rows used in the calculation can easily be lowered at the expense of a slight amount of accuracy.
Future Work The results of this paper confirm that recovering rotational information from a pair of images can be done in a typical office environment. In an office environment, the 1-D phase correlation algorithms out performed the other algorithms with respect to both execution time and accuracy. Images taken from outdoor and other environments may show that the algorithms perform differently. Studying the impact of environment on the accuracy of the algorithms may provide a better indication of the practicality and effectiveness of these approaches for use as a general robotic navigational tool. Two general approaches were tested in this study; a frequency domain approach, and search of the global difference minimum. A comparison of these techniques to feature extraction based approaches may provide more insight into the usefulness of the algorithms discussed.
References M.O. Franz, B. Schölkopf and H.H. Bülthoff. Where did I take that snapshot? Scene-based homing by image matching. Biological Cybernetics 79, 191-202, 1998. F. Labrosse. Visual compass. In Proceedings of Towards Autonomous Robotic Systems, University of Essex, Colchester, UK, 2004. C. D. Kuglin and D.C. Hines. The phase correlation image alignment method. In Proceedings International Conference on Cybernetics and Society, 163-165, 1975. T. Röfer. Controlling a wheelchair with image-based homing. In Proceedings of AISB Workshop on Spatial Reasoning in Mobile Robots and Animals, Manchester, UK, 1997. A. Vardy and R. Möller. Biologically plausible visual homing methods based on optical flow techniques. Connection Science, 17(1/2), 47-90, 2005. J. Zeil, M. Hofmann, and J. Chahl. The catchment areas of panoramic snapshots in outdoor scenes. Journal of the Optical Society of America A, 20(3), 450-469, 2003.
5