This paper describes a multidimensional data visualization (MDV) technique for intelligent ... as to allow a data analyst to visually examine a tabular database.
Visual Data Exploration Using WinViz Hing-Yan Lee, Hwee-Leng Ong and Karanbir Singh Sodhi Information Technology Institute 71 Science Park Drive, Singapore 0511, Republic of Singapore Email: {hingyan, hweeleng, karanbir}@iti.gov.sg
Abstract This paper focuses on the use of graphical display of multidimensional data using an improved version of parallel coordinates. It shows how visualization can be used effectively for exploratory data analysis and describes WinViz, a tool that realizes it. Keywords Graphical display of information, exploratory data analysis, data mining 1. Introduction This paper describes a multidimensional data visualization (MDV) technique for intelligent data analysis. The underlying design philosophy is to display multiple attributes (or dimensions) and their relationships 'in a picture' so as to allow a data analyst to visually examine a tabular database. The same visual display interface is used to formulate query interactively and visually. This objective has been pursued and implemented in WinViz, where we get a picture of 'what the data is trying to tell us' - the observations can then be confirmed using conventional statistical analysis. Numerous methods of 'graphing' data in two, three, and even four dimensions exist, but the literature reveals little information of a general method which permits visualization of multivariate relationships (as opposed to merely relationships between small subsets of variables) in N-dimensional space. The technique used in WinViz supports visualizing p-dimensional linear objects in N-dimensional space using a 2-dimensional display (Eickemeyer 1991a, Eickemeyer 1991b), a computational geometry technique known as parallel coordinates (Inselberg & Dimsdale 1990). A generalization capability in the form of an inductive learning program has also been added to generate hypotheses to be visualized using MDV. This has enhanced the use of WinViz as a data mining tool.
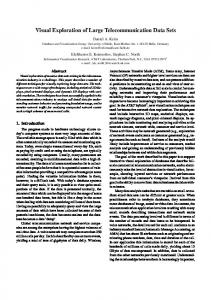
2. Multidimensional Data Visualization WinViz has been developed to exhibit the power of applied business visualization techniques on today's voluminous data repositories. The primary contribution of WinViz lies in MDV, using a refined and improved form of parallel coordinates. Parallel coordinates, as originally conceived by Alfred Inselberg (Inselberg 1987), can be described as follows: "In parallel coordinates, the principle coordinate axis are parallel and equidistant to each other. That is, for an N-dimensional data set, N vertical axis are placed on a plane, so that every two successive axis are one unit part from each other. An N-dimensional data entry is represented by a broken (polygonal) line whose vertices lie on the parallel axis and whose height (y-position) is determined by the entry's attributes, i.e., the value of the first attribute determines the height of the vertex placed on the first vertical axis, etc. A data set, then, is represented by a collection of these polygonal lines" (Chomut 1987). An example of the original parallel coordinates display is given in Figure 1. It shows that a dependency between the ID axis and the other two axis exists. Although some negative correlations exist in the data, the number of employed women rises with time in general. The MDV version of the parallel coordinates differs from Inselberg's in several aspects: • While the polygonal lines exist, they no longer play a significant role. WinViz supports a polygonal line display toggle whereby the user can select between the choice of having a polygonal line to represent a tuple (or database record) or several tuples satisfying the attribute values specified by the user. • Group bars appear in the place of attribute values on each vertical axis. The group bars help to reduce the complexity of lines when the dataset gets too big. • The concept of class is introduced where a class is a subset of the data. The user can group subjects of interest into classes and see how these classes are represented in the dataset and how they relate to other attributes.
1
•
Horizontal histograms are provided on the right hand portion of group bars when the data is divided into classes. This allows the user to compare against other attributes.
January
June
ID (Year)
Figure 1: Inselberg's parallel coordinates for USA employment for females in the 16-19 age group between 1960 - 1981 (taken from (Chomut 1987)) The heart of this paper, comprising the next four sections, addresses the following issues: MDV; discretization of numeric attributes into groups; interactive classification of population; and interactive visual query.
3. MDV An MDV display in WinViz is divided into three main regions: the workspace region, the total population region, and the status region (Figure 2). The labels correspond to the attribute names. The initial order in which the attributes appear is dependent only on the order of the attributes in the dataset, i.e., the leftmost attribute in the dataset is the leftmost attribute in the display. The workspace region displays the data graphically using the MDV version of the parallel coordinates (described above). The total population region displays information with respect to the entire dataset. Initially, it is empty. It changes in values, according to the query or classes created. The status region provides statistical information of a group bar that the mouse cursor is pointing at. attribute labels
P_SEX
P_AGE
Total
total population region
Attribute Class Query/Bar
status region
Bar/Total
Figure 3: WinViz Display of Pedestrian Accident Dataset
workspace region
Figure 2: Display Regions in the MDV window
The MDV technique accepts conventional tabular data as input. Each column is treated as an attribute, which can either be nominal, discrete or continuous, is displayed as a vertical axis. Each attribute value is visually represented by a rectangle called a group bar. For example, P_SEX is a discrete attribute with two groups: Male and Female. P_AGE is a continuous attribute that can be discretized into different age groups. The width of each group bar indicates the relative size of the group. The height of each group bar is immaterial and has no significance. In this way, we can also see at a glance the distribution of all attributes in the dataset. Statistics like the size of the group bar are displayed in a statistics window. Individual records in the dataset can be represented by a polygonal line that intersects all the vertical axes at the coordinate points. This display mechanism allows the user to identify critical regions of interest indicated by the cluttering of polygonal lines. If the display of the entire dataset shows a large number of lines intersecting a certain region of the P_AGE attribute, it may be a potential region of interest which the user can zoom in to 'drill down' into the data further. However, as lines can get quite cluttered as the database gets bigger, the group bar display described earlier becomes useful to determine the critical areas of interest.
2
4. Discretization of Numeric Attributes into Groups For the convenience of analysis, it is often useful to refer to a range of numeric values as a group. In the case of the pedestrian accident dataset, P_AGE is a numeric attribute that, for the purpose of the analysis, can be splitted into several groups such as infants, children, adolescents, adults, and senior citizens, with each associated with a specific age range. Very often such ranges are domain-sensitive. In WinViz, this discretization function can be achieved easily and interactively by a feature called partitioning. Figure 4 shows the display when the P_AGE attribute values of Figure 3 is split into 5 subgroups. Notice that the youngest group (the group bar at the bottom of the P_AGE axis) is biggest.
5. Interactive Classification of Population This is a general case of the discretization method described above. Instead of merely grouping numeric attributes, WinViz supports the creation of groups, or more precisely called classes (mentioned in section 2), based on several attributes. Exploring potential correlations among attributes is supported by allowing the user to interactively classify subjects of interest and see how these classes are represented in the database. We may try to correlate pedestrian deaths with other attributes by color coding pedestrians according to the pedestrian injury status. By mapping the class proportions onto the group bars, we can see the correlations between the pedestrian injury status and other attributes (Figure 5).
Figure 4: WinViz Display of a Partitioned Attribute
Figure 5. Classification by Pedestrian Injury
on the right hand side of The figure shows three classes: P_INJ=Slight (as indicated by the group bars shaded each attribute axis), P_INJ=Serious ( ) and P_INJ=Killed ( ). The group bar display is normalized to see the classification in terms of percentage and a query on no pedestrian crossing (P_MOVE=NoPedXing) has been made. The picture indicates that speed limit of the road has a direct correlation with the pedestrian injury status when accidents happened at no pedestrian crossing. The higher the speed limit (SPDLMT), the greater the proportion of pedestrian injury (bars on the left of the SPDLMT axis increases as SPDLMT increases) Also, the higher the speed limit, the greater the proportion of those who are killed ( increases as SPDLMT increases). Notice also that a higher percentage of females is killed compared to males under such a condition. A statistics window exists to display the distribution of classified subjects by percentages for any colored group bar selected. We can also classify subjects by more than one attribute. Hypotheses can be quickly formulated or reformulated using the immediate and visual feedback from the group bars or polygonal lines. This in turn provides a quick initial feel of the data and the identification of potential patterns for more rigorous analysis. To facilitate intelligent data analysis, WinViz includes the following analysis operators and facilities: a. It is unnecessary to load all the attributes for a dataset into MDV at the same time. After all, the human mind is limited in its ability to handle too many attributes and their relationships at any instant. Studies (e.g., (Miller 1956)) have shown that the magic number is 7, plus or minus 2. We can therefore reasonably expect a user to select between 5 and 9 attributes for analysis. Conceptually, there is no limit on the number of attributes that can be displayed on MDV; rather the physical screen size will force the display to be squeezed and hence may appear very small.
3
b.
c.
d.
In the process of data exploration, the user may want consider new attributes or omit some from the analysis. This requirement is facilitated in WinViz by allowing him to interactively and selectively indicate which attribute to include or to exclude on-the-fly. Upon data loading, the MDV display is initially in the unnormalized mode. The relationship among the group bars can also be viewed through normalization, in which all the group bars are forced to the same width but the shadings are adjusted accordingly to reflect percentage. In this way, a particular trend such as, increasing percentage as an attribute value increase, could be easily seen. The order of attribute display may be changed by using a click-and-drag on the attribute label to its intended position on the MDV display.
6. Interactive Visual Query The query mechanism employs an interactive point-and-click interface on the same MDV display. This eliminates the need for the user to learn a new query language. A query is formulated by selecting group bars causing them to become shaded. The shaded regions show the proportion in each group bar that satisfies the query. WinViz allows one to formulate simple AND and OR type queries. AND conditions are permitted across different attributes while OR conditions are allowed across the values of an attribute. The hatched patches indicate the conditions that have been specified. Figure 6 shows a query (P_SEX=Male) AND (SPDLMT=40kmh- OR SPDLMT=50kmh). A more comprehensive discourse of the WinViz query mechanism is described in (Lee et al 1995).
Figure 7: Visualizing a Rule
Figure 6: Making Queries on WinViz
7. MDV and Machine Learning Besides exploratory data analysis, another use of MDV is data mining. However, a synergistic combination of MDV and inductive machine learning can provide an even greater leverage for data mining. To this end, we have incorporated the C4.5 learning program, a widely known machine learning technique, seamlessly into WinViz. C4.5 generates decision trees from attribute-value examples in a top-down fashion. It descends directly from Quinlan's original ID3. We refer the interested reader to (Quinlan 1993) for a full description. This integration has several advantages. It harnesses the interactivity and visual representation of WinViz on one hand. On the other hand, it exploits the generalization capability of C4.5. Thus, induced knowledge in the form of if-then-else production rules are provided as shortlisted hypotheses, which can then be stepped through for exploratory data analysis. An example of such a production rule is: IF (RDCOND = Wet AND P_AGE > 80 AND P_AGE