displays a message-passing graph of the execution of an MPI application. ... execution may force the developer to run its application many times until an error is.
Visual Debugging of MPI Applications Basile Schaeli 1, Ali Al-Shabibi 1 and Roger D. Hersch 1 1
Ecole Polytechnique Fédérale de Lausanne (EPFL) School of Computer and Communication Sciences CH-1015 Lausanne, Switzerland {basile.schaeli, ali.al-shabibi}@epfl.ch
Abstract. We present the design and implementation of a debugging tool that displays a message-passing graph of the execution of an MPI application. Parts of the graph can be hidden or highlighted based on the stack trace, calling process or communicator of MPI calls. The tool incorporates several features enabling developers to explicitly control the ordering of message-passing events during the execution, and test that reordering these events does not compromise the correctness of the computations. In particular, we describe an automated running mode that detects potential races and enables the developer to choose which execution path should be followed by the application.
1 Introduction Parallel applications are subject to errors that do not occur in single-threaded sequential applications. Such errors include deadlocks, when conflicts over resources prevent the application from moving forward, and message races, when changing the order of reception of messages changes the result of the computation. Parallel application debuggers should therefore enable explicitly testing and analyzing such errors and provide multiple abstraction levels that filter and aggregate the large amount of information displayed to the developer. Several contributions, e.g. [4], [6], focus on record and replay techniques to enable reproducing a race once it has been detected. For instance, Retrospect [4] enables the deterministic replay of MPI applications, but the lack of control on the application execution may force the developer to run its application many times until an error is revealed. To our knowledge, ISP [11] is the only tool that explicitly tests different orderings of events within MPI applications. While it could produce a suitable trace for a replay tool, being able to replay an erroneous execution deterministically is only a first step in identifying a bug. The ability to visualize and to test slightly different executions may help understanding the origin of an error and correcting it. Full-featured parallel debuggers such as TotalView [10] and DDT [1] support the isolation of specific processes, the inspection of message queues and are able to attach a sequential debugger to remote application instances. The debugger for the Charm++ framework [7] takes advantage of its integration within the Charm++ parallel runtime to provide higher-level features such as setting breakpoints on remote entry points. While these tools provide the developer with detailed information about the running
processes, none of them provides an instantaneous high-level picture of the current state of the application execution. In previous work, we described a debugger targeting applications developed using the Dynamic Parallel Schedules (DPS) parallelization framework [2]. The parallel structure of these applications is described as an acyclic directed graph that specifies the dependencies between messages and computations. The debugger may therefore display the current state of the graph very naturally and provides the application developer with much information in a compact form. Different event orderings can be explicitly tested by reordering messages in reception queues or by setting high level breakpoints. The present contribution applies the concepts presented in [2] to MPI applications, and introduces a few MPI specific features. A graphical user interface displays the message-passing graph of the application and provides a high-level view of its communication patterns. Within the message-passing graph, we can hide or highlight MPI calls based on various criteria such as the originating process, the communicator on which the communication occurred, or the source code file or function that generated the call. We propose various types of high-level breakpoints to control the evolution of the participating processes. Execution scenarios that occur only rarely in actual executions can thereby be explicitly tested. Variants may be executed using an interactive replay functionality. The debugger is able to provoke and detect potential conflicts over MPI_ANY_SOURCE receives. Possible matches are drawn on the message-passing graph, enabling the developer to decide which execution path must be followed by the application. The debugger also integrates object visualization support for the autoserial library [3], which provides MPI function wrappers that are able to send and receive regular C++ objects. The paper is organized as follows. Section 2 describes the general architecture of the debugger and Section 3 describes features for controlling the application execution. Scalability issues and performance measurements are presented in Section 4. Section 5 discusses directions for future improvements and draws the conclusions.
2 Architecture The debugging functionality is provided via two independent components. The first, the interception layer, is a library that intercepts the MPI function calls performed by the application using the MPI Profiling Interface (PMPI [5]). When the MPI initialization function MPI_Init is intercepted, every process opens a TCP connection to the debugger, a standalone Java program that receives and displays information about the current state of the application. Processes first identify themselves to the debugger by sending their rank and their process identifier. During the application execution, the interception layer then sends a notification to the debugger for every point-to-point and collective MPI function called. Notifications are also generated for the various MPI_Wait and MPI_Test functions, as well as for functions creating new communicators. With the exception of the message content, each notification contains a copy of all the parameters of the called function. These parameters may be MPI defined constants, such as MPI_COMM_WORLD, MPI_INT or MPI_ANY_SOURCE, whose actual value is
specific to MPI implementations. The debugger therefore also receives a copy of these constants when the application starts, so as to be able to translate parameter values into human readable form when displaying information to the developer. Notifications are sent before calling the actual MPI function. Once it has sent a notification, a process suspends its execution and waits for an acknowledgment from the debugger. By withholding specific acknowledgments, the debugger may thus delay the execution of the associated processes while letting the rest of the application execute. Since a process cannot send more than one notification at a time to the debugger, the order in which the debugger receives notifications from a given process matches the order of occurrence of events within that process. Receive calls that specify MPI_ANY_SOURCE as the source of the expected message may potentially match send calls from multiple sources. In this paper, we refer to such calls as wildcard receives. Since in the general case the debugger cannot automatically determine which source is actually matched by a wildcard receive, this information is provided separately by the interception layer via a matched notification. If the wildcard receive is blocking, the matched notification is sent immediately after the reception of the message by the receive function call. For nonblocking wildcard receives, the matched notification is sent when an MPI_Wait or MPI_Test call successfully queries the status of the non-blocking receive. In both cases, the rank of the matched source is read from the MPI_Status parameter of the appropriate call. The user interface of the debugger consists of a single window that provides control elements to influence the application execution, and displays the current status of the application as a message-passing graph. The vertices of the graph represent the MPI calls performed by the application. Unlike most tracing tools that display time from left to right, our representation matches the one used within the MPI standard, where time flows from top to bottom. Vertices associated to notifications from a same process are therefore displayed one below the other, similarly to successive lines of code within a source file. The debugger draws edges between successive vertices from a same process. It also draws edges of a different color between vertices associated to matching send and receive calls. For this purpose, the debugger maintains one unmatched sends and one unmatched receives queue. Upon receiving a notification for a send (resp. receive) call, the debugger looks for a matching receive (resp. send) call within the unmatched receives (resp. unmatched sends) queue. If none is found, the incoming notification is pushed at the end of the corresponding queue. When looking for matches, the queues are explored in a FIFO manner in order to respect the FIFO property of MPI communication channels. New vertices and edges are dynamically added to the graph as the debugger receives new notifications from the application. When the debugger receives a notification for a wildcard receive from a process p, it stops matching send calls destined to p until the reception of the corresponding matched notification. For non-blocking wildcard receives, graph updates are therefore delayed until the application successfully queries the status of the receive call. On Linux, the interception layer is able to determine the stack trace of every MPI call. A panel in the debugger window displays a tree containing the files, functions and line numbers from which the MPI functions were called. Selecting a node of the tree then highlights all the associated vertices in the message-passing graph,
Fig. 1. Debugger window. The left panes contain the list of processes and the stack trace tree. Tooltips display detailed information about MPI calls.
illustrating how and when the selected file or function is used within the application. Another panel displays the list of processes involved in the computation and enables hiding the graph vertices belonging to specific processes. When the application uses multiple communicators, the list of processes belonging to each one of them appears in additional tabs. When switching to a given communicator tab, the developer may choose to display a partial message-passing graph that includes only the vertices associated to MPI calls performing communications on the selected communicator. We provide the ability to zoom in and out of the graph in order to adapt its level of detail to the needs of the developer. The label and color of every vertex indicates the type of MPI operation executed, and tooltips display detailed information about call parameters, as well as its stack trace if available. Collective operations are grouped into a single vertex and are represented as a rectangle that spans all participating processes. When the developer double-clicks the graph vertex of a suspended MPI call, the debugger attaches a user-specified sequential debugger to the calling application process, and uses the stack trace information to set a breakpoint to the source code line that immediately follows the MPI function call. The debugger then acknowledges the notification, the process is resumed and the new breakpoint is hit, enabling the developer to inspect the application code. The autoserial [3] library provides wrappers around the MPI_Send and MPI_Recv functions that allow sending and receiving complex C++ objects instead of simple memory buffers. When these functions are used, the interception layer sends the full serialized object to the debugger, which may then display its content using a tree view similar to the ones found in traditional sequential debuggers. For objects to be understood by the debugger, the serialization is performed by a specialized textual
serializer which includes the necessary variable name and type information within the serialized data. The interception layer also provides functions for registering serializable objects representing the user-space state of the running application. The developer may retrieve and display these objects when a process is suspended by the debugger. The request is piggybacked on the acknowledgment for the pending notification of the selected process, causing the interception layer to send a copy of the registered objects.
3 Controlling the application execution A global breakpoint may be activated. It causes the debugger to withhold all acknowledgments, thereby suspending all processes. Clicking a button then simultaneously acknowledges the pending notification of every process, which then resumes execution up to the next MPI call. The global breakpoint allows quickly stepping through the execution of all processes at the message-passing level rather than at the instruction level, while maintaining the opportunity to take action on every notification. Process breakpoints cause the debugger to systematically withhold the notifications sent by particular processes. This feature may be used to arbitrarily delay specific processes and attempt to provoke message races. The developer may explicitly test different execution orderings by breakpointing multiple processes and by resuming them in different orders. A finer control is provided via conditional breakpoints. They enable withholding acknowledgments for notifications matching one or several criteria such as the rank of the calling process, the type of MPI call, the message size or data type, or the destination rank for send calls. Moreover, the developer can specify a hit count to indicate how many times the breakpoint must be hit before it becomes active. The use of wildcard receives leads to non-determinism within the application execution. It may be difficult to identify potential conflicts, and manually controlling the application execution may be error prone. We therefore implemented a procedure that detects potential ordering variations on wildcard receives and allows the developer to choose the send call that matches a specific wildcard receive. When this mode is active, the debugger automatically acknowledges all notifications that are not associated to send calls. Upon receiving a notification for a send call, the debugger checks whether it already received a notification for a matching receive call. If not, it holds the send notification until it receives a matching receive notification. If the matching receive explicitly specifies the source of the expected receive, the debugger acknowledges the send notification, thereby resuming the process execution. If the matching receive is a wildcard receive, the debugger draws one large arrow between the graph vertices corresponding to the potentially matching send and the wildcard receive. Since the other processes keep running, more arrows may be added as the debugger receives other potentially matching send notifications. Clicking on a send vertex then acknowledges the associated notification. The resumed process then sends its message, which matches the wildcard receive under consideration. Since this scheme makes no assumption about whether calls should be blocking or not, it is able to reveal potential message races stemming from the buffering of messages within MPI calls. In Fig. 2a, the debugger will acknowledge the broadcast
(a)
Process 1
Process 2
Recv(*)
Send(1)
Isend(0)
Bcast(0)
Bcast(0)
Bcast(0)
Recv(*)
Send(1)
Recv(*)
Process 0
(b)
Process 0
Process 1
Send(0)
Recv(*)
Fig. 2. (a) Send calls from both process 0 and process 2 may match any of the wildcard receives from process 1 if broadcast and send calls are buffered; (b) the debugger cannot receive the notification for the first receive from process 0 without previously acknowledging the non-blocking send from process 0. Numbers between brackets respectively indicate the rank of the destination, source or root process depending on the type of MPI call. A ‘*’ denotes a wildcard receive.
notification from process 0. If process 0 buffers the broadcasted message, the debugger will eventually receive a notification for the subsequent send call, which may match the first wildcard receive of process 1 if process 2 is delayed. On the other hand, some executions involving non-blocking or buffered sends cannot be enforced. For instance, in Fig. 2b the debugger cannot detect that a race could occur if the non-blocking send from process 0 is not acknowledged. In such cases, reliably enforcing different orderings would require the ability to reorder incoming messages within MPI reception queues. Automatically holding all send calls may also lead to deadlock-like situations when non-blocking sends are used. This is the case in Fig. 2b, where both processes are suspended by the debugger. The developer must then click on one of the send vertices (in this example, on the Isend call from process 0) to acknowledge the associated notification and resume the execution. At any moment, the developer has the possibility of generating a trace file. When the application restarts, loading the trace file causes the debugger to set internal breakpoints that will reproduce the traced (and potentially incorrect) execution. During replay, the developer may set additional breakpoints to test execution variants.
4 Scalability issues Since it must process all the notifications sent by the processes, the debugger becomes a bottleneck when the rate of incoming notifications increases. We performed measurements on the Pleiades cluster at EPFL, which consists of 132 single-processor nodes connected with a Fast Ethernet switch. We ran the High Performance Linpack (HPL [8]) benchmark on four nodes, with one process per node and a 100x100 matrix decomposed into 10x10 blocks. This run called 664 MPI communication functions during its running time of 0.03 seconds, leading to a call rate of 22 thousand calls per second. Once connected to the debugger, the same application ran in 30 seconds, or about 1000 times slower. For this test, the debugger was therefore able to process and display about 22 notifications per second. While such a display rate is sufficient to manually step through the application
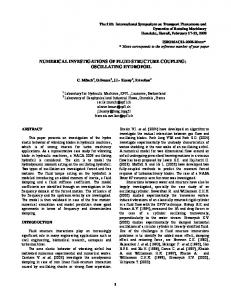
Running time overhead for HPL 200% 150% 100% 50% 0% 0
4 nodes 8 nodes 16 nodes 2000 4000 6000 8000 10000 12000 14000 Total MPI function calls per second from all processes
Fig. 3. Debugger overhead when the display of the graph is disabled. The call rate of MPI functions is computed when the application is not connected to the debugger. Results for 4, 8 and 16 nodes are well approximated with a linear function.
execution, in many cases the developer wants the application to execute quickly up to the point where he wants to start his analysis. The major portion of the slow down is due to the display of the events to the application developer however. If we run the debugger without layouting and displaying the graph, the running time falls to 0.16 seconds, reducing the overhead compared to the original application running time to a factor of 5. Figure 3 presents the running time overheads as a function of the average number of MPI calls per second performed by all processes during the execution. It displays results for HPL running on 4, 8 and 16 nodes with one process per node for various matrix and block sizes (from 2000 to 8000 and from 25 to 500 respectively). For a given number of nodes, the running time overhead can be approximated fairly well using a linear function. The slope becomes less steep as the number of nodes increases, due to the fact that the debugger uses one thread per MPI process to receive and acknowledge the notifications. Since the notifications are well balanced between the processes, the multithreading improves the overlapping of processing and communication within the debugger. These results show that high notification rates may occur, and it is therefore crucial that we optimize our layout and display code to achieve better performance. The performance can currently be slightly improved by disabling the live updating of the message-passing graph, which is then refreshed at once when a breakpoint is hit and when the developer explicitly requests an update. In addition to increasing the running time overhead, high notification rates lead to large graphs that are difficult to analyze. The interception layer implements the MPI_Pcontrol function to enable and disable the sending of notifications to the debugger. The developer may therefore reduce both the application running time and the size of the message-passing graph by disabling notifications during non-critical parts of the execution. The scheme could be extended in order to provide a finer grain of control over the types of MPI calls that should be transferred to the debugger. The ability to collapse parts of the graph, e.g., between two barrier synchronizations, would also facilitate the visualization of large graphs.
5 Conclusion and future work We have presented a debugger for MPI applications. By dynamically drawing the message-passing graph representing the application execution, the debugger provides
the developer with a graphical view of the current status of the execution. Graph vertices can be highlighted according to specific criteria in order to ease the analysis. Several types of breakpoints enable controlling the execution of the parallel application. All breakpoints operate at the level of message-passing calls rather than code instructions. They enable the developer to focus on the communication patterns of the application, and provide entry points for attaching a sequential debugger to individual processes. The debugger is also able to run the application such that the developer is able to choose how send and receive calls should be matched in the presence of wildcards. The ability to influence the application by suspending processes and reordering message matches provides the developer with full control over its execution. This control can be used to execute cases that occur only rarely in practice, for example for testing the presence of message races or deadlocks within the parallel application. The integration of checkpoint/restart capabilities ([4], [9]) into the message-passing graph based debugger would add significant value. Combined with the provided control on the application execution, this feature would enable interactively testing multiple execution scenarios without requiring reexecuting the application from the beginning.
References 1. Allinea, the distributed debugging tool (DDT), http://www.allinea.com 2. A. Al-Shabibi, S. Gerlach, R.D. Hersch, B. Schaeli, A De-bugger for Flow Graph Based Parallel Applications, Proceedings of the ACM International Symposium on Software Testing and Analysis (ISSTA'07), Parallel and Distributed Systems: Testing and Debugging workshop (PADTAD'07), London, UK (2007) 3. Automatic reflexion and serialization of C++ objects, http://home.gna.org/autoserial/ 4. A. Bouteiller, G. Bosilca, J. Dongarra, Retrospect: Deterministic Replay of MPI Applications for Interactive Distributed Debugging, Lecture Notes in Computer Science (LNCS), Vol. 4757, pp. 297--306, Springer Verlag (2007) 5. W. Gropp, S. Huss-Lederman, A. Lumsdaine, E. Lusk, B. Nitzberg, W. Saphir and M. Snir, MPI: The Complete Refer-ence (Vol. 2), MIT Press, ISBN 978-0-262-57123-4 (1998) 6. C.-E. Hong, B.-S. Lee, G.-W. On, D.-H. Chi, Replay for debugging MPI parallel programs, Proceedings of the MPI Developer's Conference, pp. 156--160 (1996) 7. R. Jyothi, O. S. Lawlor, L. V. Kalé, Debugging Support for Charm++, Proceedings of the 18th International Parallel and Distributed Symposium (IPDPS'04), Parallel and Distributed Systems: Testing and Debugging Workshop (PADTAD), p. 294 (2004) 8. A. Petitet, R. C. Whaley, J. Dongarra, A. Cleary, HPL - A Portable Implementation of the High-Performance Linpack Benchmark for Distributed-Memory Computers, http://www.netlib.org/benchmark/hpl/ 9. S. Sankaran, J.M. Squyres, B. Barrett, A. Lumsdaine, J. Duell, P. Hargrove, E. Roman, The LAM/MPI Check-point/Restart Framework: System-Initiated Checkpointing, Int’l Journal of High Performance Computing Applications, Vol. 19, No. 4, pp. 479--493 (2005) 10. TotalView Technologies, the TotalView Debugger (TVD), http://www.totalviewtech.com 11. S.S. Vakkalanka, S. Sharma, G. Gopalakrishnan, R.M. Kirby, ISP: a tool for model checking MPI programs. Proc. ACM SIGPLAN Symposium on Principles and Practice of Parallel Programming (PPoPP’08), pp. 258--256 (2008)