Visualization, Causation, and History Robert B. Allen College of Information Science and Technology, Drexel University Philadelphia, PA, USA +1-215-895-0460
[email protected] ABSTRACT History may be seen as a tapestry of interwoven events. The discourse structure of that tapestry may be identified and used to support visualization for examining and interacting with the tapestry of history. Specifically, we propose temporally constrained causal relationships as a key for organizing that tapestry. Because Events occur at different levels of granularity and similar ones may occur with cumulative effect, we introduce Trends. Trends are first-class objects; that is, in this model Trends may be causes of Events. To facilitate interaction with a rich tapestry of complex historical events such as the American Civil War, we also introduce Threads. These are chains of Events, and presentations of them may be considered a type of narrative. We describe a panel-oriented visualization interface that shows causal Threads of Events and Trends leading up to the Civil War. This initial prototype is intended to present history at the level of an intermediate textbook. Finally, we introduce a semi-formal notation for describing Events, Threads, and Trends, and propose directions for future research to refine the prototype that may enable broader, deeper, more flexible, and more complete exploration/presentation of historical materials.
Categories and Subject Descriptors [H.3.7] Digital Libraries; [H.5.2] User Interfaces; [H.5.4] Hypertext/Hypermedia
General Terms Documentation, Human Factors
Keywords Causation, Discourse, Digital Humanities, History, Narrative, Timelines, Visualization
1. INTRODUCTION As increasingly sophisticated approaches for managing and interacting with information are developed, they are applied to more complex and nuanced areas such as digital humanities. For history there is a vast amount of primary sources and other historical materials which are available as a result of mass digitization projects, and much more will be available in the near future. However, we know little about how to provide effective access to this large amount of material. Text processing technologies such as search engines and information extraction are obvious approaches, but there are also Permission to make digital or hard copies of all or part of this work for personal or classroom use is granted without fee provided that copies are not made or distributed for profit or commercial advantage and that copies bear this notice and the full citation on the first page. To copy otherwise, to republish, to post on servers or to redistribute to lists, requires prior specific permission and/or a fee. iConference 2011, February 8-11, 2011, Seattle, WA, USA Copyright © 2011 ACM 978-1-4503-0121-3/11/02…$10.00
constructive approaches from the field of user interface and hypertext design. Historical events generally are neither random nor isolated but are connected as a cascade or tapestry of interwoven events. The discourse structure of that tapestry may be identified and used to support visualization for examining and interacting with the tapestry. While the reasons for some events will never be known, the reasons for other events are easy to understand and, in many cases, the reasons can plausibly be identified with a little exploration. We apply the proposal of Roberts (1996) that historical causation can best be understood by focusing on local events rather than general principles. Thus, this paper analyzes historical descriptions as an area for which conceptual structures can be productively identified and which graphical interfaces can then navigate. Section 2 reviews previous research. Section 3 considers how some of these research themes may be applied to a specific example and further extended. Section 4 introduces a novel interface for exploring a historical period, applying the concepts developed in Section 3. Section 5 introduces a semi-formal notation for describing the concepts developed in Section 3. Section 6 then considers future directions to refine the prototypes in Sections 4 and 5 that may enable broader, deeper, more flexible, and more complete exploration/presentation of historical materials.
2. VISUALIZING HISTORY 2.1. Visualizing Time and Causation Graphics such as timelines and maps have always played a role in presenting history. Indeed, the value of graphical organizers is well recognized (Ausubel, 1969). Some individuals apparently are visual thinkers (Arnnheim, 1969) and graphical organizers would be particularly valuable to them. Timelines specifically have been proposed as a conceptual organizer (Allen, 1995). Beyond timelines, there are many systems for visualization of causal relationships. Among these approaches are Fishbone Diagrams (Ishikawa 1990), Causal Maps and Influence Diagrams (Axelrod, 1976), and Why/Because graphs (e.g., Ladkin, 2000). But, just as most timelines are not interactive, few, if any, of these causal diagrams are interactive and they are certainly not oriented toward history. Another significant tradition for displaying causal relationships is causal loop diagrams such as those developed for modeling system dynamics, which are networks of feedback loops (e.g., Forrester, 1961). These may be seen as influence diagrams with two important differences: They have explicit feedback cycles and they have stocks (or reservoirs) which can introduce temporal delays. However, these diagrams are often about abstract processes and generally do not describe sequential developments. Moreover, as with the simpler causal diagrams
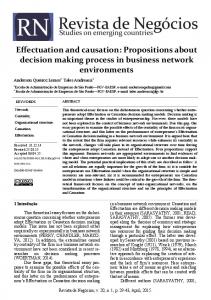
described in the previous paragraph, these models are not interactive. These earlier static display techniques have evolved into interactive display technologies that provide many new and thus far only lightly explored opportunities for presenting history. For instance, interactive timelines were described by Allen (1995). More recent studies have begun to explore the possibility of expressing causal relationships among historical Events. When all the Events are presented on a single timeline, the stories behind the Events get jumbled. Allen and Nalluru (2009) (Figure 1) shows that Events may be aligned onto separate Threads and each of those Threads can be stepped through or played. This separation of Events into Threads allows the distinct stories for sets of Events to be shown. However, a limitation of this approach is that it associates each Event with only one Thread, when an Event may appropriately be part of multiple threads. For instance, the Dred Scott Decision was both a Legal challenge and an inspiration for the Abolitionist movement.
2.2.
Composite Hypertexts, Narrative, and History
There is a close, though not well explored, connection between the link roles in composite hypertexts with the identification of elements in discourse studies. Narrative is a type of discourse with specific constraints such as posing a problem which needs to be resolved, while narrative timelines can be considered as a type of structured or composite hypertext. These timelines use hyper-links of different types. Argumentation systems are one type of composite hypertext. In this case, argumentation means to set forth a proposition along
with supporting evidence and implication, and “argumentation system” generally applies to hypertext maps which lay out the components of the argument as nodes (e.g., Streitz et al., 1992). There are many related applications of composite hypertexts such as design rationale and guided tours (e.g., Shipman et al., 1995). Hypertext maps have been proposed for exploring narrative (Allen & Acheson 2000) based on tracing the Events identified in them. The identification and application of sets of discourse elements for different activities and different viewpoints is itself a major area of exploration (e.g., Mann and Thomson, 1988). History itself is often recognized as consisting of discourse (e.g., Berkhofer, 1997). However, little work has been specifically focused on historical narrative, and history-oriented and timeline-based hypertext systems have not been explored previously.
3. EVENTS AND CAUSATION 3.1. Events in Texts The natures of both Events and causation are controversial. Events are emergent and difficult to define in general. Their identification has been of increasing interest. For instance, the Topic Detection and Tracking project (TDT, Allan, 2002; Swan & Allan 2000) explored how text processing would be applied to finding Event topics in newspaper text. The Time Markup Language (TimeML, Ingria & Pustejovsky, 2004) provided for marking up text with descriptions of Events in extreme detail. Allen et al. (2005) show that Events are often best thought of as state changes of entities squarely in the computer-science modeling tradition.
Figure 1: In the narrative timeline interface from Allen and Nalluru (2009), Events are arranged on distinct Threads. In this case, the five vertical Threads describe five causes which have been proposed for the outbreak of the American Civil War. In addition, a sub-timeline with a detailed description of Events surrounding the Amistad incident has been opened.
3.2.
Causation
Hume famously argued that causation is merely correlation. Yet, there are clearly cases in which we are comfortable with attributing causation. Mackie (1974) has proposed that when people talk about causes they are following what he calls INUS (Insufficient but Non-redundant part of a condition which is itself Unnecessary but Sufficient for the result) analysis. In the case of history, attributing causation is much closer to argumentation. There is generally only fragmentary evidence of what happened, and the evidence that is available may be unreliable. This is particularly the case when causes for historical events involve attribution of internal states of people. The result is that causation in history is painted with a broader brush than, say, causation in natural science.
3.3.
Events and Threads
Narrative history generally is based on chronology, but it is more than a sequence of related Events; it often reaches a resolution. It may also include discussion of evidence relating the Events to broader historical issues. We propose that narrative Threads developed from causal sequences of Events can be usefully applied for historical narrative, to facilitate interaction with the rich tapestry of complex historical events such as the American Civil War. Threads are chains of Events, and presentations of them may be considered a type of narrative. In fact, while causation is the backbone of historical explanations, the explanations are generally presented in some coherent Thread. This is similar to what Roberts (1995) terms colligation. A quick scan of the Web finds pages with titles ranging from: Causes of the French Revolution, the Salem Witchcraft Trials, the fall of the Roman Empire, and the Irish Potato Famine, to the Great Depression. Clearly, the listing and discussion of causal Threads is a major genre of history writing. Because we are focused on graphical presentations, we use Threads and Events in hypertext maps.
3.4.
Trends
Consider the following passage from a discussion of the origins of the Second Boer War 1 as an example of the nature and complexity of historical explanations. When gold was discovered soon after in the South African Republic in 1886, fresh waves of uitlanders (foreigners), mainly from Britain, came to the Boer region in search of employment and fortune. Gold made the Transvaal the richest and potentially the most powerful nation in southern Africa, but it also resulted in the number of uitlanders in the Transvaal eventually exceeding the number of Boers, and precipitated confrontations over the old order and the new. British expansionist ideas (led notably by Cecil Rhodes) as well as disputes over uitlander political and economic rights resulted in the failed Jameson Raid of 1895. This raid led by (and named after) Dr. Leander Starr Jameson, the Administrator in Southern Rhodesia of the Chartered Company, was intended to encourage an uprising of the uitlanders in Johannesburg.
1
http://en.wikipedia.org/wiki/Second_Boer_War
There is clearly a chronology in the quotation, but aside from the discovery of gold and the Jameson Raid few specific Events are identified. Rather, phenomena like migration and economic and political tensions are introduced as causes. In other words, some historical activities reflect myriad individual decisions and actions, such as the decision to migrate. Events occur at different levels of granularity and similar ones may occur with cumulative effect. Thus, we introduce a new structure, Trends, to represent these complex phenomena. We define a Trend as the related actions of a set of Entities. Trends often consist of collective behavior by many individuals. In some cases, this could be similar to flocking or swarming animals whose behavior can be approximated by simple rules. In other cases the Trend develops an internal coherence – a life of its own – and can be seen as a type of Event and the collection of Entities whose actions comprise it can be viewed as a distinct Entity. An example of the latter might be a political movement. Thus, the Abolitionist Movement is a Trend whose members formed an Entity. Trends are first-class objects; that is, in this model Trends may be causes of Events.
4. EVENT-FOCUSED VISUALIZATION 4.1. Design Goals We seek to develop an interface for presenting an overview of causal relationships among historical Events, which might provide a useful orientation and overview for history students and scholars, and which has the potential to be refined into a tool for historians to organize and present data, and for students to study data. While the timeline interface in Figure 1 included Event-based Threads, it had limitations. Events belonged to only one Thread and there was no clear distinction between Threads and Trends. For example, the Dred Scott Decision should be part of both the Legal and Abolitionist Threads. To address these considerations, we developed a new interface. This new interface is an early effort to implement the concepts developed in Section 3. This panel-oriented visualization interface shows causal Threads of Events and Trends leading up to the Civil War. It is an initial prototype intended to present history at the level of an intermediate textbook.
4.2.
Event-Focused Interface
The interface shown in Figure 2 was implemented. It was coded as a Java application and could easily be converted to a Java applet for Web presentation which may be more robust.
4.2.1.
Layout of Events and Trends
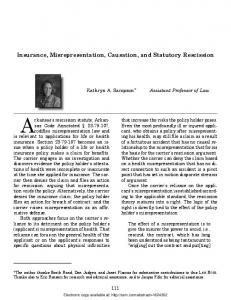
In this new interface, a central pool of Events allows ad hoc interconnections. In addition, Threads are distinguished from Trends. This distinction should allow the discourse elements to be more clearly applied. To facilitate presentation and ease of use, the complete causal timeline interface is presented in one screen and the Events and Trends are in fixed locations. This means that a broad history curriculum would bridge across several screens and windows. To illustrate the interface, we use a set of causal Threads proposed for the Civil War; these are similar to those used by Allen and Nalluru (2009). In particular, the Dred Scott Decision is part of both the Legal and Abolitionist Threads in this interface. The Events are centered in the main display while the Trends are shown at the top and bottom. The Trends here are indicated
with “fans”, that is with wedge shapes that indicate growth (in the case of the Trends shown here). While the basic layout could be automated, several nuances involved human judgment. For instance, Trends which arguably primarily affected the southern states are shown above the Events while those Trends which primarily affected the northern states are shown at the bottom of the figure. As a design decision, for ease of presentation and understanding, the Events in the panel were placed at equal intervals. Their temporal order was preserved but the relative intervals between them were not. For example, tensions between the northern and southern states escalated throughout the early 1800s and culminated with outbreak of fighting in 1861. Near the top edge of the display is a timeline. A ratioscale timeline would be too compressed for the rush of Events leading up to the Civil War. We chose, instead, what might be termed an ordinal timeline. That is, Events were equally spaced out along the timeline regardless of their actual timing. To give a sense of the actual timing, there was a mapping between the ordinal and ratio scale timelines. The panel shown in Figure 2 would link to other panels. The viewer is alerted to the existence of these other panels by heavy bars on the left and right edges of the display (e.g., Constitution and Civil War). This panel may be viewed as analogous to a chapter in an American history textbook.
4.2.2.
Controls and Interaction
The controls and textual descriptions run down the right side of the screen. Upon entering the screen, the user would select one of the Threads to view and the first event associated with it would be presented and would become the “Active Event”. The appropriate Thread Description would appear and the Events and Trends associated with that “Active Thread” would be highlighted. Other Events and Threads (i.e., those not associated with the Active Thread) are grayed out. The viewer may then step through Events with the “Next” button attached to the “Active Event” description. When the next Event is requested, it becomes the Active Event and the description for it is displayed in the Active Event panel. As each Event/Trend in the Thread is viewed, it is marked with a filled red circle.
5. A Semi-Formal Notation 5.1. Purpose of Notation It will be helpful to have a notation for describing causal relationships. Such a notation could be useful for describing general causal relationships such as those in scientific abstractions as well as the relationships among specific Events. This approach has several advantages: (1) It could be shared and reused across applications; (2) It could eventually be useful for developing an automated layout manager for the displays, and
Figure 2: Screen for “Causes of the Civil War” with Events and Trends. This is an alternate presentation to the causal and narrative timeline shown in Figure 1. Trends, which are a new feature developed for this interface, are shown by “fans”. Events and Trends from the Active Thread are shown in red. Events and Trends which have been visited during a session are indicated with a red dot. Events and Threads which are not part of the Active Thread are grayed out. For the example shown in the figure, the Cotton/Agriculture Thread starts with the invention of the Cotton Gin and includes the highlighted Trends.
for supporting automated synthesis of Active Event descriptions; (3) It could provide a framework for recording data about the usage of the system, such as the number of viewings of different Threads and Events; (4) It could support versioning that may be developed; and, (5) It could facilitate light-weight, presumably human-guided, reasoning about Events.
they could be extended to support access to background and evidence. In Section 6.4 we suggest how they can manage different versions. Section 6.5 proposes historical discourse interfaces which, unlike the timeline interfaces described above, are not based on causal threads. Finally, Section 6.6 considers potential educational applications.
5.2.
6.2.
Entities, Events, and Causal Relationships
Our approach involves relatively simple primitives such as Entities, Events, Trends, and Threads. Entities (En) have Properties, such as location. Some Properties of Entities have States (S) which may change. A state change is an Event (Ev) Ev 1 (En 1 ) = En 1 (S 1 ) –> En 1 (S 2 ) The advantage of emphasis on Entities and States is that it allows us focus on the relationship between the Entities and Events. Specifically, we say a Causal Relationship (Rc) occurs when one Event spawns another Event for the original Entity: Rc: Ev 1 (En 1 ) – > Ev 2 (En 1 ) or for another Entity: Rc: Ev 1 (En 1 ) –> Ev 1 (En 2 ) We could also have an Event which splits an Entity as the South did when it seceded from the Union. A Thread is a sequence of causally related Events: Thread = Ev 1 > Ev 2 > Ev 3 > Ev 4 For example, the Abolitionist Movement gained strength with the public discussion of Uncle Tom’s Cabin and we might say that the Abolitionist Movement helped to elect Lincoln. Many Events are actually Threads composed of other Events. Thus, we might say Ev x = Ev 1 > Ev 4 where this was a short form of the Thread. Since judgment of causation in history is often subjective, and that subjectivity is amplified particularly when determining Trends and Threads, this formalism may highlight the differences between subjective judgments and perhaps facilitate comparison and discussion.
6. FUTURE WORK 6.1. Overview The prototype interfaces presented here are a first step to what could be a much richer and more complex set of services. As we describe in Section 6.2, timeline interfaces can be coordinated with other windows. As described in Section 6.3,
Coordinated Windows
Any one window or panel such as Figure 2 can relate only a limited amount of history. It would, however, also be one way to implement other discourse relationships. We envision a system of coordinated and interlocking windows, with timelines as the primary framework around which the windows would be coordinated. Coordinated windows (e.g., Baldanado et al., 2000) allow shifting to different views of the same topic as presented on the main window. For instance, biographies of major individuals and maps of significant locations could both provide a deeper understanding of the focus panel. The nature of the actors or the location may help to explain the unfolding of Events.
6.2.1.
Biography
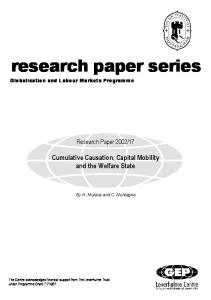
Individuals and institutions play major roles in history and their biographies or profiles may be incorporated into the interface, with links to Events that involved the particular Entity. For instance, in the pre-Civil War period in the U.S. there were notable personalities such as John Brown, John Calhoun, Henry Clay, Abraham Lincoln, Nat Turner, and Harriet Tubman. In Figure 3, a biography panel for John Brown is shown. This biography panel links to the “Bleeding Kansas” and “Harpers Ferry” Events. Such biographies could play a customized role in the overall presentation. There could be a biographical focus view with the emphasis on Entities rather than on Events. However, biography has a very different style of presentation than narrative history. To understand a person’s decisions we may consider facts about them such as their beliefs, knowledge, roles, relationships, and emotional states. We might say that these are properties of the person analogous to the Properties of any Entity and the biography would emphasize the development and evolution of these properties. In addition, biographies differ in the extent to which they employ psychological models for explaining a person’s actions, and to the extent such psychological models are employed, they would need to be defined. It may be better to think of an individual as Trend than as an Entity.
Figure 3: In a detail from a mock-up of a biography panel, a timeline for the life of John Brown is shown. It also shows links to Events with which John Brown was particularly associated. As described in 6.2.1, much richer biographies should also be possible.
6.2.2.
Locations and Spatial Views
Geography is also often central to history. Place may play a major role in the nature and outcome of the Event. While we have focused here on linking causation of Events through temporal relationships, maps should also be very helpful in understanding Events in history (MacEachren, 1995). For instance, the well known video “The Civil War in Four Minutes” produced for the Abraham Lincoln Presidential Library and Museum is essentially an animation of battle lines moving across a map of the United States that strikingly visually depicts the progress of the war. Figure 4 shows a map that might be placed at the end of the presentation of the causes of the Civil War that we described in Section 4 and be a transition to the description of the fighting in the Civil War. Further exploration of integrating geographic graphics into the presentation should be useful.
Figure 4: Maps could be coordinated with the timeline presentations, and provide a complementary path for exploration. Here, we see the newly formed Confederate States of America two months after the attack on Fort Sumter. Clicking a different year on the right of the screen may show the territory controlled by the Confederacy at that point in time.
6.3.
Background and Evidence
6.3.1.
Extended Active Event Descriptions
Part of the strength of the visualization interface is that it omits much of the complexity which might be incorporated in a text description. The interface includes brief descriptions of each Event but users might want still richer detail. Or, they might want to understand the evidence which supports claims. That latter would be analogous to a footnote in a scholarly paper. Development of such extended Active Event descriptions would strengthen the interface.
6.3.2.
Linking to Source Materials
Source materials may provide evidence. Such documents could provide illustration of or even evidence for some of the posited causal relationships. Conversely, the graphical interfaces may provide context for the interpretation of historical materials. Several principles from this interface could be applied to working with digitized archival materials and digitized historical newspapers. Access to these digitized resources is currently supported mostly with simple keyword search interfaces. We have proposed that the access for them could be greatly
improved by richer navigation support, such as through the interface posited in Figure 5. Figure 5 shows a mock up of a possible interface for browsing collections of historical newspapers. The pages shown are from two different Washington DC newspapers for October 26, 1906. Both newspapers reported a serious rail accident in Atlantic City. This Event was identified by text processing described in Allen (2010) which combined evidence from the two newspapers. It is an example of how allowing search engines to find “articles like this” across newspapers would enable viewers to easily compare related articles in different papers. Beyond simply providing links for newspaper articles, these interfaces could provide access to a wide range of other historical resources. This could also be considered as an implementation of a Regional and Local history version of the interface. It might also become part of a historian’s workbench (cf., Allen & Sieczkiewicz, 2010). Development of such a source material interface that links to the Figure 2 interface would enrich access to the materials and understanding of history.
Figure 5: Mock up of search and browsing interface for historical newspapers. The two newspapers are for the same date and the interface enables comparison of the way the same news is presented. At the top of the frame, timelines would show significant events in the time period being examined. One of these timelines might apply to the local area (e.g., Washington DC) and the second might show broader context (Allen, 2005).
6.3.3.
Using Events and Event Scripts to Improve Text Processing for Historical Materials
As we build sets of interlocking displays we would also be expanding the database of Events and relationships among Events. Where the relationships are not defined rigorously enough for inference, we would create a type of temporal database. This, might, for instance, be useful in augmenting text processing. We might, for instance, expect certain reactions from Abolitionists following the Dred Scott decision and compile a database of Abolitionist activities in the time period immediately after the decision. In addition to a knowledgebase of specific Events, we might also develop expectations about common sequences of Events. Scripts have been proposed as expected sequences of Events, (Schank & Abelson, 1977) as a model of cognition, and they could be useful for organizing information and supporting text processing (e.g., Wagner, 2009). For instance, we would find sequences of articles about elections. This would be composed
of discussion of a campaign, of voting, of results, and finally of an inauguration (Allen 2010). Even the inauguration ceremony itself would have a predictable structure. Another example would be the sequence of crime, arrest, trial, and punishment. Exceptions to these Scripts would also be anticipated. The crime many not result in an arrest and the trial may not result in conviction.
6.4.
Personalization and Alternate Versions
Like other hypertexts and hypertext maps, interfaces can be personalized. Such a system could be viewed as an adaptive hypertext (e.g., Brusolowski et al., 1998) or even a personalized intelligent tutoring system (e.g., Graesser et al., 2010). Specifically, the Thread and Event descriptions could be personalized based on either the viewer’s background or sites s/he had visited. For instance, if s/he had already received an explanation of an Event, the description might then include statements such as “As you saw earlier…”. Ultimately, the Event descriptions and Threads might be used for animations and even historical conversational agents and the presentation and user attributes could be used for a type of drama management (Murray, 1998). History is often disputed at both small and grand scales. Was the ultimate cause of the Civil War slavery or the restrictions on States Rights by the U.S. Constitution? These differences could be shown in separate presentations much the way that different books present different versions of history. More complex interfaces could also be developed to show different interpretations simultaneously and highlight the differences between them. The latter may require or be facilitated by additional annotation by a human being. Both personalization and versioning would be supported by enriching the notation described in Section 5.
6.5.
Richer Descriptions
6.5.1.
Toward a More Complete Notation
The notation sketched in Section 5 provides just a foundation for a more complete formalism. Allen (in preparation) extends a related model to descriptions of causation used in science. Future features for the interface will require several extensions. One set of issues revolves around displaying more complex causal relationships such as branching Threads and multiple sources of causation. In many cases, causes are tightly interwoven and multi-layered. For instance, the course of a battle may be affected by developments that are simultaneous and/or interrelated in different sectors of the battlefield.
6.5.2.
Intentions and Constraints
The description of the Boer War quoted earlier included the statement that: British expansionist ideas (led notably by Cecil Rhodes) as well as disputes over uitlander political and economic rights resulted in the failed Jameson Raid of 1895. In many cases, people’s actions are reactive but as this quote suggests they may also reflect intentions and goals, such as expansion and political and economic rights. We might say that the goals are Properties of the person and are triggered in a given environment. However, it may be unwieldy to represent
complex plans in terms of Properties. An extreme case of this would be describing the role of Roebling’s engineering drawings in causing construction of the Brooklyn Bridge. A second complex issue concerns the role of constraints such as social norms and laws. In many cases, these are expected and generally do not attract comment as distinct causes for Events, but where there are “disputes over uitlander political and economic rights” there is no agreement on the norms and laws, and the lack of agreement is a cause of Events. The appropriate representation of both intentions and constraints require further research.
6.5.3.
Discourse and Narrative
Rich presentations may interweave different types of discourse (Polayni, 1989). We have focused on timeline-like chronologies, and employ narrative techniques to engage users. Timelines in particular are common in textbooks but less common in issue-oriented histories, which generally include a much richer set of discourse relationships and often analyze the reasons for an Entity’s actions in depth, trying to explain history with all its uncertainties. Interfaces for this sort of presentation and exploration might be more like an argumentation system (e.g., Steitz et al, 1992). Indeed, they may include all of the rhetorical relationships elements in Rhetorical Structure Theory (RST, Mann & Thomson, 1988). Nonetheless, a set of discourse elements optimized for historical analyses may still benefit from including elements related to these that we introduced for chronology-based descriptions. Combinations of these elements may usefully form macrostructures. For instance, there might be frequent descriptions of Entities and Trends along with descriptions of their Properties. The Threads in Figure 2 are more than sequences of causally related events. They help tell a story of how the country moved closer to civil war. Another narrative device sets up contrast between the perspectives of the northern and southern states. Future work could formalize some details of the narrative structures so they might be used more effectively in supporting user interaction.
6.6.
Educational Applications
The primary goal has been to develop systems which use temporal and causal relationships to provide context. Such systems, including this interface and the broader system of interlocking windows, may be useful for history education. The current interface is analogous to a history textbook. Features such as interactivity, multimedia presentations, and graphic demonstrations of interrelationships among Events should foster student interest and retention. The interface could support a history student’s workbench in which the student could propose causal Threads and support them with evidence from source materials. Those proposed causal threads could also be available for critique by fellow students. While the interface conventions and content such as shown in Figure 2 would likely be too complex for many young students, students may be gradually introduced across grades to how to use the materials and how to maintain an orientation across several different views. The interface could be the basis of more advanced educational scenarios. For instance, its interactivity might enable teachers and their more advanced students to contrast different explanations.
The interfaces in Figures 1 and 2 are based on a number of what we believe are effective design decisions. Future work should include an evaluation of those decisions and, indeed, for the general value of graphical interaction for supporting history education.
7. CONCLUSION Although history is extremely complex, there is clearly structure in descriptions of historical events to manage that complexity. We have sought to capture some of that structure. To reduce the complexity we have focused on causal relationships and have defined those relationships in terms of Entities and their Properties. Moreover, we have used that approach to create a visualization interface enabling users to explore the tapestry of factors contributing to significant historical Events. This work may be the foundation for more refined and sophisticated interfaces and descriptions, as well as educational applications. In other words, we have tried to bring the full value of hypertext to history.
Baldanado, M., Woodruff, A., and Kuchinsky, A., Guidelines for Using Multiple Views in Information Visualization, Working Conference on Advanced Visual Interfaces, 2000, 110-119. Berkhofer, R.F., Beyond the Great Story: History as Text and Discourse, Harvard University Press, Cambridge MA 1997. Brusolowski, P., Kobsa, A., and Vassileva, J., Adaptive Hypertext and Hypermedia, Kluwer, Dordrect, Netherlands, 1998. Forrester, J., Principles of Systems, 2nd Communications, Waltham MA, 1961.
ed.
Pegasus
Graesser, A.C., VanLehn, K., Rose, C.P., Jordan, P., and Harter, D., Intelligent Tutoring Systems with Conversational Dialogue. AAAI. 2010. Ingria, R., and Pustejovsky, J., TimeML: A Formal Specification Language for Events and Temporal Expressions, 2004, http://timeml.org/site/
8. REFERENCES
Ishikawa, K., Introduction to Quality Control, (Translator: J. H. Loftus) 3A Corporation, Tokyo, 1990.
Allan, J., (ed.) Topic Detection and Tracking: Event-based Information Organization, Kluwer International Series on Information Retrieval, v12, Kluwer, Norwell MA, 2002.
Ladkin, P., Causal Reasoning about Aircraft Accidents, Computer Safety, Reliability, and Security, (LNCS 1943), 344-360.
Allen, R.B., Timelines as Information System Interfaces. Proceedings International Symposium on Digital Libraries Tsukuba, Japan, 1995, 175-180.
MacEachren, A. M., How Maps Work. New York: Guilford Press, 1995.
Allen, R.B., A Focus-Context Timeline for Browsing Historical Newspapers. ACM/IEEE Joint Conference on Digital Libraries, 2005, 260-261. Allen, R.B., Toward a Platform for Working with Sets of Digitized Historical Newspapers. IFLA International Newspaper Conference: Digital Preservation and Access to News and Views, New Delhi, 2010, 54-59. Allen, R.B., Model-Oriented Scientific Research Reports, in preparation. Allen, R. B. and Acheson, J. A., Browsing the Structure of Multimedia Stories, ACM Digital Libraries, San Antonio, TX, 2000, 11-18. Allen, R.B. and Nalluru, S., Exploring History with Narrative Timelines. HCI International Conference, 2009, (LNCS 5617) 333-338. Allen, R.B., and Sieczkiewicz, R., How Historians use Historical Newspapers, ASIST, 2010. Allen, R.B., Wu, Y.J., and Jun, L., Interactive Causal Schematics for Qualitative Scientific Explanations, ICADL 2005, (LNCS 3815) 411-415. Arnheim, R., Visual Thinking, University of California Press, Berkeley, 1969. Ausubel, D., In Defense of Advance Organizers: A Reply to the Critics. Review of Educational Research, 1978, 48(2), 251257. Axelrod, R., (ed.) Structure of Decision: The Causal Maps of Political Elites, Princeton University Press, Princeton NJ, 1976.
Mackie, J.L., The Cement of the Universe: A Study of Causation, Oxford, OUP/Clarendon, 1974. Mani, I., The Imagined Moment: Time, Narrative, and Computation, U. Nebraska Press, Lincoln NB, 2010. Mann, W.C. and Thomson, S.A., Rhetorical Structure Theory: Toward a Functional Theory of Text Organization, Text 8(3), 1988, 243-281. Murray, J., Hamlet on the Holodeck: The Future of Narrative in Cyberspace. MIT Press, Cambridge MA, 1998. Polanyi, L., Telling the American Story: A Structural and Cultural Analysis of Conversational Storytelling, Bradford/MIT Press, Cambridge MA, 1989. Roberts, C., The Logic of Historical Explanation, Penn State University Press, University Park, PA, 1996. Schank, R., and Abelson, H., Scripts, Plans, Goals and Understanding, Erlbaum, Norwood, NJ, 1977. Shipman, F.M., Marshall, C., Furuta, Brenner, D.A., Hsieh, H., and Kumar, V., Creating Educational Guided Paths over the World-Wide Web, 1995. Streitz, N., Haake, J., Hannemann, J., Lemke, A., Schuler, W., Schutt, H., and Thuring. M., SEPIA: A Cooperative Hypermedia Authoring Environment, ACM Hypertext, Milan, 1992, 11-22. Wagner, E.J., Extracting and Aggregating Information about Situations over Time to Present the Context of News. Department of Computer Science, Northwestern University, Dissertation, 2009.