Computer & Geosciences, Special Issue “Geoscientific Visualization”, 1, 2000 (in press)
Visualization in an Early Stage of the Problem Solving Process in GIS Andreas D. Blaser*, Monika Sester+, Max J. Egenhofer* *
National Center for Geographic Information and Analysis Department of Spatial Information Science and Engineering University of Maine Orono, ME 04469-5711, USA
[email protected],
[email protected]
+
Institut für Photogrammetrie Universität Stuttgart Geschwister-Scholl-Str. 24 D-70174 Stuttgart, Germany
[email protected]
Abstract Methods of user-computer interaction have remained largely unchanged since the introduction of graphical user interfaces and their popularization by the Apple Macintosh in the early 1980s. Most of today’s applications rely on primitive modalities, such as typing and pointing for input generation, which works well for a host of common business applications, but falls short for more complex task. To improve the interaction between user and computer we propose a concept that allows people to visualize their ideas, problems, or instructions during the initial phase of an interaction with a computer by augmenting traditional interaction modalities with sketching, gesturing, and talking. This approach leads to a more natural user-computer interaction and enhances a user’s ability to find solutions to a problem. We suggest that computers become actively involved in the process of problem formulation and that they provide support and give advice where this is adequate. This leads to a process of incremental problem formulation where user and computer are able to better visualize the actual task and fewer misunderstandings occur. Geographic information systems (GISs) would benefit from improved user interaction techniques. GISs are inherently complex and an interaction is often tedious, mostly because such systems are based on sequential and non-spatial input methods that lack the capability of expressing spatial concepts appropriately. We advocate for a visualization in an early stage of the problem solving process in GIS and discuss its advantages and challenges. The paper gives application examples and discusses future research topics. Keywords:
1.
Multimodal user interfaces, user-interface design, human-computer interaction, alternative user interaction, sketching, geographic information systems, problem visualization.
Introduction
If user and computer were a married couple in our present society, they had long gone counseling, because their communication is full of misunderstandings, false interpretations, and frustration so that they frequently are unable to express their intentions and problems to each other. Although many users have accepted this situation, they often are dissatisfied. This paper proposes a conceptual therapy and suggests specific methods that can stimulate an interaction between user and computer. We promote a bi-directional interaction between user and computer, describe how such an interaction could look, and demonstrate why some applications can benefit. In this context we argue for the introduction of alternative, human-centered modalities that simplify the communication between people and computers, and suggest an active integration of computers during the initial phase of user-computer interaction. Traditionally the term visualization has been used to describe the process of graphically conveying or presenting end results (DiBiase and others, 1992; MacEachren and Monmonier, 1992; MacEachern and Kraak, 1997). Along these lines, visualization is used as the last step in the processing sequence of a task, with the computer as information provider and the user as information consumer. We argue that this interpretation of the term visualization is incomplete, because it is one-directional and focuses only on the
-1-
Computer & Geosciences, Special Issue “Geoscientific Visualization”, 1, 2000 (in press)
final stage of user-computer interaction. This interpretation is also converse to the original definition of the term visualization, which attempts to build a mental image of something, rather than merely representing graphical results on a computer screen. Within such a setting, we consider visualization as the process during which user and computer become aware of the actual task and in which they reach a stage at which both parties agree upon the objective of an interaction. This strong integration of computers into the process of formulating a problem requires a system to apply human-like strategies so that it can perceive and interpret a user’s input. Applications in the GIS domain will benefit from such an approach, because spatial concepts are inherently difficult to understand and manage if only traditional interaction methods are applied. 1.1
State of the Art in Interaction with GIS
Today’s methods for interacting with geographic information systems and geographic databases are often tedious (Egenhofer and Herring, 1993; Egenhofer and Kuhn, in press). Users frequently struggle with GIS applications because many fundamental principles upon which today’s GISs are built have non-spatial origins, such as relational databases, tables, and other flat, list-related data structures that have been developed for non-GIS purposes. This reliance on sequential and text-oriented procedures reflects also in many of today’s GIS user interfaces (Bruns and Egenhofer, 1997). To improve the interaction between user and computer, several commercial applications have substituted command lines with pull-down menus; however, interactions with such systems remain cumbersome, because only the method but not the principle of interaction has changed (Figure1).
Figure 1:
Today’s user-computer interaction is often based on rather primitive user modalities.
Recently, many areas in computer science have made significant progress. Examples are the emerging global computer network with the world-wide-web, the advent of ubiquitous computing (Weiser, 1998), and the exponential increase in performance of microchips that brings a live in real time (Lewis, 1995) within reach. Compared with these rapid advancements, user-computer interaction has lagged behind. While traditional interaction methods may still be adequate for most mainstream applications, such as word processors and other office applications, they are often inappropriate for GIS applications, because they lack explicit support for dealing with spatial data.
-2-
Computer & Geosciences, Special Issue “Geoscientific Visualization”, 1, 2000 (in press)
1.2
Increasing the Bandwidth of User-Computer Interaction
One of the major problems with the use of today’s computer systems and their applications is the absence of user centeredness. Although user interfaces changed considerably since the times of mainframes, when slow ASCII terminals were standard and an interface configuration was restricted to an alteration of the font color, they are still lacking essential characteristics that would make them user friendly. Despite the proliferation of point-and-click interfaces, today’s computer still determine how a user has to interact with the system. Another impediment for an effective user-computer interaction is the narrow range of interaction modalities limiting the users’ choices to mouse and keyboard. There is a big gap between the way people interact among each other, and the way people interact with a computer (Figure 2). Beside simple and commonplace modalities, such as typing and pointing, other interaction methods, such as talking, writing, gesturing, and sketching, are found only occasionally in current software systems. Thinking, though not directly a modality, could become a useful tool to convey information as well, if it becomes possible to detect and interpret human thought directly, for instance by monitoring brain currents. The concept of multimodal interaction is part of an attempt to find more intuitive ways for people to interact with computers (Shneiderman, 1987; Kuhn, 1992; Tue Vo and Waibel, 1993; Waibel and others, 1995). Much attention has been paid to voice and handwriting recognition and there are also some promising projects that investigate real-time interpretation of natural language (Bolt, 1980; McKevitt, 1992; Allen, 1995). Other expressive human modalities, such as sketching (Sutherland, 1963) and gesturing (Pentland, 1996), have not yet found their ways into the mainstream of humancomputer interaction.
Thinking Sketching
Gesturing
Writing
Talking
Pointing Figure 2:
Typing
Traditional and alternative ways of user-computer interaction: blue indicates a good integration into today’s systems, while green stands for prospective modalities.
We expect that the trends of miniaturizing computing devices, making them mobile, and integrating “intelligence” into a set of appliances will continue in the future, possibly at an even faster pace than today (Weiser, 1998). A primary incentive for research in the field of user-computer interaction is that it is impossible to operate all devices with a keyboard or a mouse—examples are wrist computers and vehicle navigation systems. Verbal communication may be an appropriate solution for some of those applications, because there is no need for any additional physical device to carry around and language is easy to use and relatively expressive. On the other hand, talking to devices may be inadequate if people nearby may get disturbed or if an interaction becomes too complex. In such cases, more quiet modalities seem to be more suitable. Another reason that suggests an increase of bandwidth in human-computer interaction is that user -3-
Computer & Geosciences, Special Issue “Geoscientific Visualization”, 1, 2000 (in press)
interfaces should become simpler and more intuitive, so that they can be operated by people with different levels of knowledge and skills. People should be able to freely choose and interchange their ways of interaction, depending on their abilities and the situations at hand. We argue that future systems should adapt to the user, and not vice versa, and we anticipate that multimodal interaction will be a key for upcoming technologies. While improved interaction is beneficial for most every domain, it is especially important for applications in GIS. GIS applications are inherently spatial, however, conventional interaction modalities, such as typing and pointing with a mouse, support space only insufficiently. GIS technology is increasingly used in a variety of new application domains, such as biology and criminal prosecution, where users are often unfamiliar with GIS concepts. This diversification leads to new requirements as it brings together people from different professional environments. If user interfaces are too specialized, chances are high that few people will be able to operate such applications without the burden of learning the system’s specific dialect. Therefore, GIS applications will especially benefit from simplified and more powerful humancomputer interfaces that allow people to chose the type of interaction depending on their background and their preferences (Medyckyj-Scott and Hearnshaw, 1993).
2.
Supporting Users in Formulating their Intentions
A simplified and more intuitive user interaction with computers is only one part in getting more out of the symbiosis between user and computer. As computers have become more powerful, the bottleneck has shifted from the computer to the user. The large amount of data available and the number of options offered by modern applications result often in people’s inability to operate modern computer systems. Again this is especially true for GISs, because GISs are generally complex that typically involve large volumes of heterogeneous and multidimensional data. The initial phase of a user-computer interaction, where users have to outline a problem, formulate an idea, or sketch their thoughts to be processed by the system, seems to be a frequent source of difficulties. Using predefined templates or routines to simplify this initial step is a valid approach, but it works only if the tasks are repetitive and similar and if problems are well defined. To improve this situation we propose a strategy that supports people already in this initial stage of an interaction with a GIS. Such, users receive help right from the start and it becomes easier for them to make the right choice of strategy. 2.1
Visualizing Users’ Thoughts, Ideas, and Problems
Visualization in today’s GISs starts only after the initial problem has been processed and a result is generated (Beard, Buttenfield and Clapham, 1991; Couclelis and Gottsegen, 1997; Davis and Peter, 1997; Repin and Pavlis, 1997). The technique of visualization is, therefore, solely used to explain and illustrate the outcome of a process. This approach is based on the common experience that the digestion of information within a complex context is simplified if the results are presented graphically. While this route is justified alone with the success of graphical user interfaces, the Internet, and other efforts that go visual, the presentation of end results is only one phase in which visualization can effectively be applied. Figure 3 shows five typical steps that are necessary to assess and process a generic problem or task. We propose to introduce visualization already at the stage when a problem or task is formulated. This approach is based on a more general definition of the term visualization that can be formulated as follows: Visualization is the action of forming a mental image or becoming aware of something through graphical aids. Visualization techniques apply then to task descriptions and initial problem statements, which occur during the critical phase of a problem analysis. We call this type of visualization Early Visualization. If we -4-
Computer & Geosciences, Special Issue “Geoscientific Visualization”, 1, 2000 (in press)
can support people right at the beginning of this phase, we will enhance their abilities to comprehend the initial settings, reduce the number of unsuccessful attempts to solve the problem, and increase the overall quality of work done.
Problem/Task Analysis Alternative Approach for a Visualization Problem/Task Formulation
Problem/Task Solving Process
Result Formulation Traditional Approach for a Visualization Result Analysis
Figure 3:
The generic sequence of steps that are involved in solving a problem or processing a task (blue/bold). Our proposed extension (green) offers visual help right from the start.
How can we support the process of Early Visualization? Advanced communication between people and computer devices will be a key feature in future systems and this communication is likely to include a variety of modalities. A two-way communication in support of incremental problem formulation is beneficial for users as they can develop more easily a mental picture of the initial problem statement. At the same time, it improves the interacting system, because it gets integrated into the process of formulating a problem statement and such it has also access to and knowledge about the creation and evolution of the problem formulation. Early Visualization, therefore, considers visualization as a concept for the user as well as the processing system. 2.2
Advantages and Challenges for Applications in GIS
People prefer figurative expressions, relative referencing, landmarks, symbols, and the use of metaphors over mathematical descriptions of objects and relations in space (Kuhn, 1993). The abstract mathematical world in contrast favors a fixed referencing system, coordinates, entities with discrete attributes and properties—things that are not directly compatible with people’s preferences (Egenhofer, 1992). Working within a spatial context requires that people are allowed to use adapted technologies that are capable of addressing spatial issues as necessary (Beard and Mackaness, 1998). Early Visualization encourages people to formulate their thoughts by applying natural and familiar modalities that they use for their everyday communications with others. Visual interaction supports more directly human spatial thinking (Chang and Jungert, 1990) and is, therefore, more appropriate for the formulation and comprehension of problems in a spatial environment than abstract text-based or menu-based methods. The computer actively supports the user while he or she formulates the problem so that the initial phase becomes an incremental and gradual process where much of the original problem formulation task is delegated to the system. Since -5-
Computer & Geosciences, Special Issue “Geoscientific Visualization”, 1, 2000 (in press)
people are inherently vague in specifying spatial relations, this approach may help user and system to detect errors and inconsistencies during the problem formulation in an early stage, leading to a faster and more successful completion of the task. An early and active involvement of a GIS during the problem formulation process allows the system to obtain more information about the intention of the user and, therefore, support the overall understanding of the initial settings of this specific situation. An intelligent system may be able to deduce a user’s intention prior to the completion of the problem description and inform the user that the focused object is not part of the database or initiate anticipated processes, such as preparing potential datasets for processing or starting to download remotely stored data records. While traditional GISs lose information about the history of a problem statement, we suggest that the system keeps a record of the user interactions to gain further insights about the user’s intentions. Early Visualization offers, therefore, a route away from snapshot-style problem statements to descriptions with a rich informational content that address spatial as well as temporal aspects of a problem. Increasing the bandwidth of user interaction will increase the workload for a GIS. This extended involvement is technically challenging, because the system has to perform several tasks simultaneously: trace, synchronize, and evaluate multiple input sources in real time; retrieve data; evaluate information; and give advice to the user. Access to spatial information is more challenging in this setting due to the large amount of data available in highly distributed systems. In order to make such complexly structured digital libraries accessible, a GIS will have to employ powerful search mechanisms and rely on sophisticated metadata models (Beard, Smith and Hill, 1998). A bigger challenge comes from the human factors side. People’s formulations of spatial relations are often vague, imprecise, strongly context dependent, and influenced by the environment and background of a GIS operator. Together with the increase of bandwidth between user and computer, the use of a variety of modalities will further challenge such implementations. We know little about how people respond to an increased and active involvement of computers. Another key question is how much interaction and system intervention is necessary to improve, but not impede, the communication between user and computer (Norman, 1994). Finding the right balance between passive and active user support is a challenging task.
3.
Sketching the Future of User Interaction in GIS
This section presents some examples of GIS applications that will benefit from Early Visualization. 3.1
Sketching for Input Generation in GIS
People typically sketch by using paper and pencil. Paper is thin, light, foldable, and inexpensive, however, sketches on paper are difficult to reuse and editing capabilities are limited. The earliest use of sketching to interact with computers goes back to the SketchPad (Sutherland, 1963). More recently, the Electronic Cocktail Napkin (Gross, 1996) provided users with pen-based gestural commands and limited capabilities for sketch interpretation. Prominent commercial examples of sketch-based devices are the Newton and the PalmPilot. In the GIS realm, sketching received only little attention. Spatial-Query-by-Sketch (Egenhofer, 1996; Blaser, 1997; Egenhofer, 1997) aims at developing the foundations for a sketch-based GIS user interface. It allows a user to sketch a spatial query directly on an electronic sketching device, from where the sketch is translated into a query statement and processed against a spatial database (Figure 4).
-6-
Computer & Geosciences, Special Issue “Geoscientific Visualization”, 1, 2000 (in press)
Sketched spatial query
Semantic network derived from the user sketch
Spatial database query language statement
Database Management System
Query processing system SKETCH COCKPIT - SKETCH03.QBS File
1. 2. 3. …
Set of retrieved database records
Figure 4:
Similarity assessment and ranking based on a comparison with the original configuration
View
Option
Tools
Query
Window
Help
Map
?
n.
Edit
!
Best hit and sorted matches
A spatial query sketched with Spatial-Query-by-Sketch.
Objects in a sketch are typically drawn, but they can also be specified by verbal input. For instance if a user draws an object and states, “This forest is on the east coast of the US,” the system would label the drawn object as forest and create two other objects (east coast and US) with a link to the initially drawn object. During the interactive process of sketching the system generates a prioritized semantic network that contains all objects and their relations in a symbolic form and it checks for inconsistencies. When the sketch is completed, the semantic network is translated into a spatial query statement that can be processed against a spatial database. The resulting database records are transformed into a representation that can be compared with the initial semantic network of the query, whereupon the retrieved records are ranked and presented to the user. The methodology of Spatial-Query-by-Sketch is particularly useful for applications that use a spatial referencing system or other relational systems with non-spatial objects, such as organizational charts. This makes the approach of this novel form of visual interaction appropriate for querying spatial, hierarchical, and conceptual structures and thus interesting for a host of other applications in GIS and in other domains, where the relationship of objects is important (Blaser, 1997). 3.2
Sketching in GIS Applications
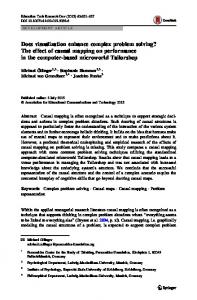
A civil engineer has a fixed initial setup, defined by the prevailing topography, geology, and other given facts, which may span on non-geographical issues as well, such as the available budget. In our example the engineer has to project a freshwater pipe that leads over a recently built landfill site to its maintenance building. Those new landfills have a strong tendency to subside, so that the freshwater pipe is likely to break. To get an idea of what others have done in similar situations, the engineer makes a rough sketch with some written annotations (Figure 5). By processing this sketch against a spatial database the engineer gains access to similar scenarios and associated information, such as name and address of the engineering company in charge or construction plans. -7-
Computer & Geosciences, Special Issue “Geoscientific Visualization”, 1, 2000 (in press)
Figure 5:
Sketch of freshwater pipe crossing a recently built landfill.
The next example originates from the field of earth sciences. Scientists of an oil company have found a strong correlation between the concentration of Jewfish, some specific geological structures of the seafloor and places, where in the past large oil fields have been discovered. To get a quick overview of locations with potential oil deposits in coastal regions, the scientists make a rough sketch of a cross section through the upper seafloor. After processing their request the scientists are presented with a map, indicating similar spatial configurations within the selected area. Specifying the same query with one of today’s spatial query languages would be more complicated, because it is difficult to describe textually the spatial characteristics of a scene, such as the variable thickness of the clay layer (Figure 6).
Figure 6:
This sketch describes the spatial configuration of a typical oil field.
In another example the primary user is a real estate agent, who may sketch during an interview with an interested buyer his or her desired spatial configuration of the property. Because a customer’s preferences about a piece of land may involve various aspects, sketching and verbally annotating are convenient ways to describe spatial constraints of a piece of land. It helps both parties to understand the desired configuration and reduces misunderstandings between agent and customer. The system can detect and learn custom symbols with a specific meaning, such as the rotating arrows in Figure 7 that indicate an irrelevance concerning the pointing arrow’s direction—in the sense of being away from. This customization allows a real estate agent to develop a personal interaction language, which extends the basic sketch language of the system (Blaser, 1998).
-8-
Computer & Geosciences, Special Issue “Geoscientific Visualization”, 1, 2000 (in press)
Figure 7:
4.
Sketch showing a customer’s description of the desired spatial configuration of a property.
Research Issues for Early Visualization
Early Visualization involves a host of challenging research topics. We limit the discussion to issues related to spatial database queries, because they are the most typical form of user interaction in many geoscientific applications. 4.1
Parsing and Segmentation
During the initial phase of user-computer interaction the system has to parse and segment a user’s input. Such a distinction of graphically generated objects can be based on geometric primitives, such as points, lines, areas, or more complex object properties, such as attributes, or geometrical and topological relations. Furthermore, Gestalt information—such as geometric properties about collinear, rectangular, or parallel object pairs—can be extracted using grouping procedures. This bottom-up interpretation process can proceed without domain-specific knowledge up to a certain degree (Marr, 1982). At a certain stage, however, top-down processes have to start, involving domain-specific knowledge. In image understanding the differentiation between objects is a considerable problem, since segmentation results are often ambiguous. The same process is significantly easier for sequentially generated user input with a temporal component, such as sketching, because a separation of objects can be achieved by a temporal sequencing of the input stream. 4.2
Input Interpretation
The interpretation of input runs in parallel with parsing. Whenever new information is available—that is, when objects have been successfully parsed—they are verified and integrated into the bigger picture to match the user’s intentions. By applying domain-specific models it is then possible to assign a specific meaning to that information. Interpretation is a well known problem in image understanding (Haralick and Shapiro, 1993). There is a growing awareness, however, that such interpretation capabilities must be provided in GIS as well. Interpreting a sketch leads to an automation of analysis procedures, which are up to now solely controlled and triggered by human interaction (Anders and Sester, 1997). The need for automation evolves from the ever increasing amount of digital data available that has to be structured and exploited in an efficient way. Database interpretation can also be seen in the context of spatial data mining (Ester, Kriegel and Xu, 1995)—the process of finding interesting structures in a spatial data set, such as spatial association rules (Koperski, Adhikary and Han, 1996). Data mining techniques rely on existing hypotheses that are checked against the data set or on unsupervised approaches, where the system tries to detect structures of which the user did not think before. -9-
Computer & Geosciences, Special Issue “Geoscientific Visualization”, 1, 2000 (in press)
4.3
Modeling
Domain specific knowledge includes object models as well as higher-order relations between objects. The first problem in modeling is the choice of an adequate representation that captures the relevant object aspects and properties. Many representation schemes of knowledge representation can be applied, ranging from attribute-value-lists to rule sets and semantic networks. Models can be described in different ways: one possibility is the use of specific models that uniquely characterize individual objects. Parametric models provide a certain degree of freedom, describing objects in terms of a fixed set of attributes, with some unassigned parameters. Generic models offer more flexibility, specifying object classes instead of individual objects. An important aspect for the interpretation of the input stream is the level of specification at which the information is processed. Pictorial representations can have many possible interpretations and similarly a spatial situation can be depicted in many different ways. For example, the sketch in Figure 4 may be interpreted as the search for a scene with a village, a forest, and a lake (matching objects), but it can also mean that the forest should be North of the village and East of the lake (matching objects, geometry, and topology). Besides the choice of the intended concepts, there may be multiple models for the concept. For instance, multiple geometric interpretations may be given to the cardinal direction in the statement that the forest is North of the village (Bruns and Egenhofer, 1996). Therefore, methods to asses and quantify the similarity between spatial scenes are an essential part of every evaluation. 4.4
Matching and Evaluation
The matching process establishes the link between the given models and the user input, and such it represents the final step of an interpretation of spatial structures. For user input with a rich informational content it is often appropriate to establish a correspondence between the model and the user input on the semantic level, using object features (e.g., object name, shape, and relative location) and analyzing object relations (e.g., topology, metric, or direction) (Egenhofer, 1997). This analysis must reflect the inherited hierarchy among different objects and object groups so that different levels of specification in the data are preserved (e.g., many trees = forest). The matching itself is a typical search problem in which the best correspondence between user input and model is searched for and a similarity coefficient is determined. Subsequent steps involve an evaluation of the results for their plausibility, quality, and reliability. This post-processing phase is essential, because of the significant portion of uncertain data that is involved. Suitable methods for this purpose include probabilistic theories (Stassopoulou, 1998) and fuzzy sets theory (Pardalos and others, 1994). For the presentation of the results it is appropriate to include additional explanations and descriptions so that the user is able to comprehend what was processed and so that he or she can gain insights about the way the result was derived.
5.
Conclusions and Future Work
We presented a concept for improving communication between people and computers. Our investigations concentrated on the initial stage of a user-computer interaction when ideas, thoughts, and problems are formulated and communicated to a GIS. Today’s GISs provide little support for users during this phase. For a more efficient interaction it is important to increase the communication bandwidth between user and computer. By introducing alternative modalities, such as sketching, gesturing, or talking, people are expected to have less difficulties in interacting with a computer. The computer is actively involved during the initial phase of problem formulation because the system tracks the creation of the problem, checks for inconsistencies, gives advice, and because the computer can anticipate and prepare for the most likely future steps. Through this early involvement of user and computer, it is possible that both parties can better visualize a specific problem. This in turn allows user and computer to become aware of the initial setup of a situation in a more consistent way, leaving less room for misunderstandings and misinterpretations.
-10-
Computer & Geosciences, Special Issue “Geoscientific Visualization”, 1, 2000 (in press)
We have shown further that the concept of Early Visualization is particularly beneficial for applications with non-transparent procedures and complex data structures. Many applications in GIS and other geoscientific fields have such characteristics. Finally, we discussed research issues with a focus on spatial database queries and outlined four research areas where increased research activities are desirable and necessary to transform the proposed concept of Early Visualization into reality.
6.
Acknowledgment
This work was partially supported by Rome Laboratory under grant number F30602-95-1-0042 and the National Science Foundation under grant IRI-9613646. Max Egenhofer's work is further supported by NSF grants IRI-9309230, SBR-9600465, and BDI-9723873; by grants from the National Imagery and Mapping Agency under grant number NMA202-97-1-1023 and the National Aeronautics and Space Administration under grant number COE/97-0015; and by a Massive Digital Data Systems contract sponsored by the Advanced Research and Development Committee of the Community Management Staff.
7.
References
Allen, J. (1995) Natural Language Understanding, The Benjamin/Cummings Publishing Company, Inc., Redwood City, CA, 654 pp. Anders, K.-H. and Sester, M. (1997) Methods of data base interpretation - applied to model generalization from large to medium scale. SMATI '97: : Semantic Modeling for the Acquisition of Topographic Information from Images and Maps, Eds. W. Foerstner and L. Pluemer, Birkhäuser, pp. 89-103. Beard, K., Buttenfield, B. and Clapham, S. (1991) Visualization of the Quality of Spatial Information: Report on the Specialist Meeting for NCGIA Research Initiative 7. (Second Visualization of the Quality of Spatial Information: Report on the Specialist Meeting for NCGIA Research Initiative 7). University of California, Santa Barbara, National Center for Geographic Information and Analysis. Beard, K., Smith, T. and Hill, L. (1998) Meta-Information Models for Georeferenced Digital Library Collections. 2nd International IEEE Conference on Metadata, Silver Springs, MD. Beard, M. K. and Mackaness, W. A. (1998) Visual Access to Data Quality in Geographic Information Systems in Cartographica (in press). Blaser, A. (1997) User Interaction in a Sketch-Based GIS User Interface. International Conference COSIT '97 (Poster Session), Laurel Highlands, PA, Springer-Verlag, Berlin. Blaser, A. (1998) Geo-Spatial Sketches. Orono, National Center of Geographic Information and Analysis, University of Maine, Orono, Technical Report, 133 pp. Bolt, R. (1980) Put-That-There: Voice and Gesture at the Graphics Interface in Computer Graphics 14(3), 262-270. Bruns, T. and Egenhofer, M. (1996) Similarity of Spatial Scenes. Seventh International Symposium on Spatial Data Handling, Delft, The Netherlands. Bruns, T. and Egenhofer, M. (1997) User Interfaces for Map Algebra in Journal of the Urban and Regional Information Systems Association 9(1), 44-54. Chang, S.-K. and Jungert, E. (1990) A Spatial Knowledge Structure for Visual Information Systems. In Visual Languages and Applications, Eds. T. Ichikawa, E. Jungert and R. Korfhage, Plenum Press, New York, NY, pp. 277-304. Couclelis, H. and Gottsegen, J. (1997) What Maps Mean to People: Denotation, Connotation, and Geographic Visualization in Land-Use Debates. In Spatial Information Theory—A Theoretical Basis for -11-
Computer & Geosciences, Special Issue “Geoscientific Visualization”, 1, 2000 (in press)
GIS, International Conference COSIT '97, Laurel Highlands, PA, Eds. S. Hirtle and A. Frank, Lecture Notes in Computer Science 1329, Springer-Verlag, Berlin, pp. 151-162. Davis, J. T. and Peter, K. C. (1997) Modeling and visualizing multiple spatial uncertainties in Computer & Geosciences 23(4), 397-408. DiBiase, D., MacEachren, M. A., Krygier, B. J. and Reeves, C. (1992) Animation and the Role of Map Design in Scientific Visualization in Cartography and Geographic Informaiton Systems 19(4), 201-214, 265-266. Egenhofer, M. (1992) Why not SQL! in International Journal of Geographical Information Systems 6(2), 71-85. Egenhofer, M. (1996) Spatial-Query-by-Sketch. In VL ‘96: IEEE Symposium on Visual Languages, Eds. M. Burnett and W. Citrin, IEEE Computer Society, Boulder, CO, pp. 60-67. Egenhofer, M. (1997) Query Processing in Spatial-Query-by-Sketch in Journal of Visual Languages and Computing 8(4), 403-424. Egenhofer, M. and Herring, J. (1993) Querying a Geographical Information System. In Human Factors in Geographical Information Systems, Eds. D. Medyckyj-Scott and H. Hearnshaw, Belhaven Press, London, pp. 124-136. Egenhofer, M. and Kuhn, W. (in press) Interacting with Geographic Information Systems. In Geographical Information Systems: Principles, Techniques, Management, and Applications, Eds. P. Longley, M. Goodchild, M. Maguire and D. Rhind, Geoinformation International, London. Ester, M., Kriegel, H.-P. and Xu, X. (1995) Knowledge Discovery in Large Spatial Databases: Focusing Techniques for Efficient Class Identification. In Advances in Spatial Databases—4th International Symposium, SSD ‘95, Portland, ME, Eds. M. Egenhofer and J. Herring, Springer-Verlag, Berlin, Lecture Notes in Computer Science, pp.67-82. Gross, M. D. (1996) The Electronic Cocktail Napkin - computer support for working with diagrams in Design Studies 17(1), 53-69. Haralick, R. and Shapiro, L. (1992) Computer and Robot Vision, Vol. II, Addison-Wesley, pp. 672. Koperski, K., Adhikary, J. and Han, J. (1996) Knowledge Discovery in Spatial Databases: Progress and Challenges. Proceedings of Workshop on Research Issues on Data Mining and Knowledge Discovery, Montreal, Quebec. Kuhn, W. (1992) Paradigms of GIS Use. In Fifth International Symposium on Spatial Data Handling, Ed. D. Cowen, Charleston, SC, Lecture Notes in Computer Science, pp. 91-103. Kuhn, W. (1993) Metaphors Create Theories for Users. In Spatial Information Theory, European Conference COSIT ‘93, Marciana Marina, Elba Island, Italy, Eds. A. Frank and I. Campari, SpringerVerlag, New York, NY, Lecture Notes in Computer Science, pp. 366-376. Lewis, T. (1995) Living in real time, side A in IEEE Computer, Issue September 1995, 8-10. MacEachern, M. A. and Kraak, M.-J. (1997) Exploratory Cartographic Visualization: Advancing the Agenda in Computer & Geosciences 23(4), 335-343. MacEachren, M. A. and Monmonier, M. (1992) Geographic Visualization: Introduction in Cartography and Geographic Information Systems 19(4), 197-200. Marr, D. (1982) Vision, W.H. Freeman, San Francisco, 397 pp. McKevitt, P. (1992) Natural Language Processing in Artificial Intelligence Review 6(4), 327-331. Medyckyj-Scott, D. and Hearnshaw, H. (1993) Human Factors in Geographical Information Systems, Belhaven Press, London, 266 pp. -12-
Computer & Geosciences, Special Issue “Geoscientific Visualization”, 1, 2000 (in press)
Norman, D. (1994) How Might People Interact with Agents in Communications of the ACM 37(7), 68-71. Pardalos, P. M., Triantaphyllou, E., Lootsma, F. and Mann, S. H. (1994) On the Evaluation and Application of Different Scales for Quantifying Pairwise Comparisons in Fuzzy Sets in Journal of MultiCriteria Decision Analysis 3,133-155. Pentland, A. (1996) Smart Rooms in Scientific American 274(4), 68-76. Repin, G. D. and Pavlis, L. G. (1997) Interactive three-dimensional visualization of seismic array data in Computer & Geosciences 23(10), 1079-1092. Shneiderman, B. (1987) Designing the User Interface: Strategies for Effective Human-Computer Interaction, Addison-Wesley, Reading, MA, 448 pp. Stassopoulou, A., M. Petrou and J. Kittler (1998) Application of a Bayesian network in a GIS based decision making system in International Journal of Geographical Information Science 12(1), 23-45. Sutherland, I. (1963) SketchPad: A Man-Machine Graphical Communication System. AFIPS Spring Joint Computer Conference. Tue Vo, M. and Waibel, A. (1993) A Multimodal Human-Computer Interface: Combination of Speech and Gesture Recognition. InterCHI'93, Amsterdam, The Netherlands. Waibel, A., Tue Vo, M., Duchnowski, P. and Manke, S. (1995) Multimodal Interfaces. In Artificial Intelligence Review, Ed. P. McKevitt, Special Volume on Integration of Natural Language and Vision Processing, pp. 299-319. Weiser, M. (1998) The Future of Ubiquitous Computing on Campus in Communications of the ACM 41(1), 41-42.
-13-