Visualizing Field-Measured Seismic Data Tung-Ju Hsieh∗
Cheng-Kai Chen†
Kwan-Liu Ma‡
National Taipei University of Technology
University of California, Davis
University of California, Davis
A BSTRACT This paper presents visualization of field-measured, time-varying multidimensional earthquake accelerograph readings. Direct volume rendering is used to depict the space-time relationships of seismic readings collected from sensor stations in an intuitive way such that the progress of seismic wave propagation of an earthquake event can be directly observed. The resulting visualization reveals the sequence of seismic wave initiation, propagation, attenuation over time, and energy releasing events. We provide a case study on the magnitude scale Mw 7.6 Chi-Chi earthquake in Taiwan, which is the most thoroughly recorded earthquake event ever in the history. More than 400 stations recorded this event, and the readings from this event increased global strong-motion records five folds. Each station measured east-west, north-south, and vertical component of acceleration for approximately 90 seconds. The sensor network released the initial raw data within minutes after the ChiChi mainshock. It is essential to have a visualization system for fast data exploring and analyzing, offering crucial visual analytical information for scientists to make quick judgments. Raw data requires preprocessing before it can be rendered. We generated a sequence of ground-motion wave-field maps of 350 × 200 regular grid covers the entire Taiwan island from the sensor network readings. The result is a total of 1000 ground-motion wave-field maps with 0.1 second interval, forming a 1000 × 350 × 200 volume data set. We show that visualizing the time-varying component of the data spatially uncovers the changing features hidden in the data.
120E
121E
122E
25N
24N
23N Ac c e l e r a t i on 22N
0( ga l )>400
( a )
( b )
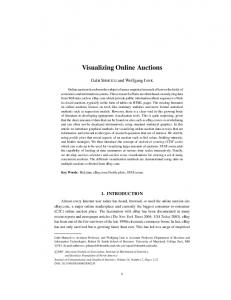
Figure 1: (a) The blue marks indicate the locations of over 446 TSMIP stations that recorded the Chi-Chi earthquake; the red cross indicates the location of epicenter. It is so far the most thoroughly recorded earthquake ever. (b) Snapshots of acceleration wave-field map at UTC 17:47:50. Surface fitting with biharmonic operator in 2D is used to complete the unsampled areas on the map.
Index Terms: I.3.8 [Computer Graphics]: Applications; I.3.3 [Computer Graphics]: Picture/Image Generation 1
I NTRODUCTION
In many areas of seismological science and earthquake engineering, the multi-channel and time-varying components add difficulties in data exploration. The field-measured data collected from an accelerograph instrumentation can contain thousands of time steps and each time step has readings from three channels (east-west, north-south, vertical). The collection of readings from a sensor network requires a huge amount of storage which creates challenges for subsequent analysis. Without proper tools, it is difficult to uncover and observe the complex physical and mechanical phenomena contained in these data sets. In addition, the release of sensor network readings is crucial for providing needed information in earthquake hazard response, damage assessment, and rescue planning. In the long term, the collection of sensor network readings serves as a statistical database for estimating earthquake occurrence probability and establishing safety factor design codes for civil infrastructure and buildings. These earthquake resistant structural design specifications are based on the history of earthquake records, and structural engineers rely on them to design proper structural elements of a building. If the safety factor is set too high, it increases ∗ e-mail:
[email protected]
† e-mail:
[email protected] ‡ e-mail:
[email protected]
the constructional costs. On the other hand, if it is set too low, the buildings might suffer structural failures when a large earthquake strikes. When a large earthquake occurs, scientists and engineers are particularly interested in studying the peak ground acceleration (PGA) map because it is an important influencing factor in choosing the proper safety design standards. The ability to interactively detect and explore the hidden phenomena in data is essential. Visualization can enhance the understanding of complex behavior and detect important features within the data. It is desirable for a visualization system to provide the functionality for changing viewpoints and modifying color mappings and classification functions at an interactive rate. This paper presents a study of a unique field-measured seismic data set, capturing 1999 Chi-Chi earthquake in Taiwan, using a custom-made interactive volume visualization system. Unlike conventional approaches, we treat time-varying 2D data as volume data. This allows scientists to capture the entire time evolution of seismic waves propagation in 3D, providing unique properties, which draws attention to data analysis. Data exploration functionalities such as changing viewpoints, zooming in and out, and interactive volume rendering of seismic data allows us to fully observe the data from start to end. This greatly enhances the perception of the sequence of important features in the data and provides unique clues for further investigations. When the volume rendering of data is further augmented with the PGA information, the directions of wave propagation emerge from volume data and become clearly observable. It is highly affected by the mechanical property of the medium.
2
E ARTHQUAKE M ONITORING
Earthquake is one of the most devastating forces in nature. Instrumentation, observation, and archiving of strong ground motions provide valuable data that holds the key to do analysis and thus can aid in earthquake hazard mitigation and understanding of seismic wave propagation. The Taiwan Strong-Motion Instrumentation Program (TSMIP) completed the installation of strong-motion accelerographs in 1996 before the Chi-Chi earthquake occurred. The strong-motion sensors record the dynamic surface motion. There are approximately 700 digital accelerographs in free-field stations, and more than 50 real-time seismic arrays installed in buildings and bridges. With 3 km station spacing of free-field accelerographs in urban area, Taiwan has the densest strong-motion instrument network in the world [20] compared to 25 km spacing of K-net strong motion seismograph network in Japan [15]. Typical accelerographs have ±2 g scale, 200 or higher sampling rate, 16-bit precision, and 20 second pre-event recording with a Global Positioning System (GPS) receiver that can be used to synchronize the internal clock to Coordinated Universal Time (UTC) [23]. The TSMIP accelerograph readings of the Chi-Chi earthquake event were investigated in this study. Figure 1(a) shows the locations of stations that recorded the 1999 Chi-Chi earthquake. The central part of Taiwan is the mountainous area; due to this reason, stations are not set up. The accelerograph readings are time stamped, i.e., the starting time that triggered the sensor is recorded. Figure 2 shows a sample strong-motion acceleration readings of a TSMIP station, TCU078 (120.84 ◦ E, 23.81 ◦ N), 8 km from the epicenter of the 1999 Chi-Chi earthquake. The typical readings of a station are plotted in 2D with the horizontal axis representing time and the vertical axis presenting the recorded readings. The time history of the accelerograph readings describes the dynamic motion of ground surface. In East-West channel, the positive readings represent eastward accelerations, and negative readings represent westward accelerations.
km segment of a thrust fault, causing remarkably surface scarps and 10 meters vertical displacement in some segments. Because of the enormous energy released from the mainshock, it caused heavy casualties and large damages to the infrastructures. More than 2,000 dead, approximately 11,000 injured, and about 100,000 structures destroyed. Its epicenter was at 120.815 ◦ E and 23.853 ◦ N, and its hypocenter was 8 km deep. It was the most devastating earthquake to hit Taiwan and caused a surface rupture with 100 km long [19]. The Chi-Chi earthquake and its aftershocks have resulted in the richest seismological data recording in the world at that time in both quality and quantity (calibrated with high confident level), and may remain so for a long period of time [22] with over 60 strongmotion recordings within 20 km from the epicenter. The first time in history a large earthquake is monitored by such an amount of instruments so close to the epicenter. It is the only recorded event in the world with Mw larger than 7.6, Chelungpu fault rupture length of over 100 km long, and many PGA larger than 1g records [19]. Due to the contributions of the 1999 Chi-Chi earthquake recordings, the world’s total holdings of strong-motion data increased five times. This makes the Chi-Chi earthquake a unique event because of its completeness of available recordings. Therefore, in emergency response, the Taiwan Rapid Earthquake Information Release System was capable of releasing information within minutes after the event, and the collected information was used in planning rescue missions. Visualization of field-measured seismic readings can aid in the process of making critical emergency response decisions. 3
3.1
Figure 2: Three sample acceleration traces (East-West PGA of 439 gal, North-South PGA of 302 gal, and vertical PGA of 171 gal) from TSMIP TCU078 station, the closest to the epicenter (8 km), show larger acceleration amplitudes recorded during the Chi-Chi earthquake mainshock.
The 7.6 moment magnitude scale (Mw ) Chi-Chi earthquake struck Taiwan at 17:47 on 20th September UTC time (or at 1:47 a.m. local time on 21 September) in 1999. It was Taiwan’s largest earthquake in the twentieth century, and it is so far the most thoroughly recorded earthquake ever. The mainshock ruptured a 100-
R ELATED W ORK
There are mainly two sources of seismic data sets: (i) numerical simulations, and (ii) field-measured. Earthquake simulations are important because they helps researchers better understand seismic wave propagation characteristics and establish proper earthquake response plans to mitigate seismic hazards. Field-measured data is particularly useful in verifying data from earthquake simulation. Without interactive visualizations, data exploration would be difficult to achieve. Visualization of Simulation Seismic Data
Former researchers used a variety of approaches such as 2D snapshot images or videos to visualize time-varying earthquake simulation data. Mavroeidis et al. [13] used a series of 2D images, taken at equal time intervals, to show the evolution of groundmotion simulations over time. Similarly, Hirahara et al. [6] conducted simulations of complex fault system ruptures and used a sequence of 2D plots to reveal the spatio-temporal evolution of seismic waves. Sometimes, large 3D simulation of earthquake ground motions were overlaid on maps [4]. When the simulation results were plotted on static images, how to present the time-varying information was an issue. Antolik et al. [2] presented their wave propagation simulations using a video showing the seismic waves overlapping a 2D map. large-scale simulation was important in understanding of earthquakes. However, it produced huge amounts of data. In order to fully explore the large data, researchers used parallel processing to enhance computing performance. Zhang et al. [28] developed parallel rendering algorithms to visualize time-varying 3D volume data from earthquake simulations. Akcelik et al. [1] used a 3000processor supercomputer to simulate an earthquake in the Los Angeles Basin; the wave propagating volume data results were displayed in a sequence of 2D snapshots. Ma et al. [12] presented a parallel rendering algorithm for time-varying volume data on a 128-processor supercomputer, revealing 3D seismic wave propagation originating from the hypocenter of a simulated earthquake event. In another example, Yu et al. [26] presented a parallel visualization algorithm for studying a large earthquake simulation to model 3D seismic wave propagation of the 1994 Northridge earth-
quake. Chourasia et al. [5] presented a cast study of visualizing large-scale earthquake simulations on a supercomputer, encoding the rendered images into animations. These works dealt with data of simulation results. This decomposition of simulation and visualization became undesired as the large simulations moved into terascale and petascale. In contrast, Tu et al. [24] presented another type of system, which simulation components and visualization were tightly coupled together so that real-time rendering of simulation data was made possible. Chopra et al. [3] presented a visualization work of earthquake simulation data to enhance collaboration between structural engineers, seismologists, and computer scientists in an immersive virtual environment to present the simulation data better. These simulations provide a mean to better understand the earthquake, however, it is also important to verify simulation results with field-collected seismic data. Komatitsch et al. [7] conducted a global-scale simulation of seismic wave propagation and superimposed the simulation data over field-measured waveforms data. 3.2
Visualization of Field-Measured Seismic Data
Large field-measured seismic data sets posed significant challenges for processing and analyzing. Yuen et al. [27] presented a webbased system for visualizing seismic data in a grid environment. A conventional approach to analyze the field-collected data sets was to study earthquake induced effects as time histories by plotting and comparing discrete waveforms. Wolfe et al. [25] presented a visualization system for examining the seismic volume data generated from ultrasound reflections, looking for high-amplitude seismic events through a synoptic view of the interior. Tools were developed for interpreting and illustrating 2D slices of seismic volumetric reflection data [16]. Nayak et al. [14] used 3D glyphs, graphics primitives or symbols with various geometric and color attributes, to represent the measured seismic data. These glyphs were rendered in real time and combined with a 3D topography terrain map. In particular, 3D visualization can provide visual clues via an intuitive representation of the time-varying information that is difficult to represent with traditional 2D techniques. Visual analytics tools are aimed to aid the process of analyzing field-measured seismic data sets and leading to new discoveries. When properly georeferenced and treated, seismic data sets can be presented in a natural form that facilitates the understanding of governing mechanisms. For example, the peak ground-motion map can be computed from sensor readings of an earthquake. It is a static map showing the recorded peak values of different locations during an earthquake. A series of 2D ground-motion wave-field maps over time can be generated from the field-measured records of an earthquake event. A single ground-motion wave-field map only shows a snapshot of acceleration readings at a particular time. In contrast, a sequence of ground-motion wave-field maps show the initiation and propagation progress of ground motions. These wave-filed maps can be used to generate a video clip for further analysis. From the playback of a video clip, the time history of ground motions can be observed. Using the sensor network readings from the 1999 Chi-Chi earthquake, Shin and Teng [19] produced a video of 100 time frames, presented at one frame per second, showing the ground motions from start to finish throughout the island. In their approach, each station was treated as a pixel and interpolation was used to fill the empty pixels between stations. In addition, they used a low-pass filter to trim the high frequency portion of the signals to avoid breaking up wavefield maps. From the playback of the video, major energy releases were determined in time and space. A major energy release was defined as an event that emerged at the surface in an area of nearly 10 km in radius with accelerations of 350 gal and larger. They pointed out that major energy releases happened at 11, 14, 15, 16, 18, 19, 20, 21, 23, 27, 29, 30, 32, 34, 43, and 50 seconds from origin time. Some of the major energy releases were from adjacent active faults
triggered by the bursts of extensive energy releases of the mainshock. From the examination of the time-space relationship of the major energy releases, they further concluded that there was no particular order with which these energy releases took place, Shin and Teng called this type of rupture jumping dislocations. Stress field was irregular along the fault zones; dislocation occurred where the stress concentration exceeded the rock strength. In order to fully present the time history of the field-measured ground motions, new approaches are needed to provide a spatially and temporally anchored, visual representation of the earthquake phenomenon. Different from previous methods of using a video to show the time-history of the sensor readings, Romero Summet [17] presented a system to visualize the entire contents of a video by stacking frames up in sequence. This approach enabled longitudinal analysis of the aggregation of contents in a video. In a similar way, a sequence of wave-filed maps can be stacked up in 3D. In this paper, a new approach was presented to visualize the world’s most complete field-measured earthquake ground-motion readings. Volume rendering techniques were used to examine the unstructured time-varying seismic data. Compared to conventional approaches, volume rendering provided new perspectives to look at the data. These visual paradigms provided an enhanced understanding of the field-measured seismic data. When coupled with feature extracting techniques, interactive visualization played a crucial role in exploring the seismic data.
4
V ISUALIZATION
OF
ACCELEROGRAPH R EADINGS
Since most of the TSMIP accelerographs have absolute timing tuned with GPS receiver timing and all stations have accurate relative timing, a common time reference was inputted into all records. The seismic sensor readings from the Chi-Chi earthquake was used to generate a sequence of ground-motion wave-field maps. Because the TSMIP sensor network has the densest station distribution in the world, the resolution produced from the raw data was enhanced significantly, showing more completed ground-motion wave-field maps. Our seismologist collaborator suggested that surface fitting [18] should be used to interpolate the regular grid map. It models a surface (fits grid values) from scattered data in the form of z(x, y) for each channel. Using biharmonic operator in 2D achieves minimum curvature interpolation of irregularly spaced sampled points, so the result surface always passes through the sampled data points. Since scientists are mostly interested in studying energy, absolute values are used for the readings of the three channels in this study. Figure 1(b) shows a snapshot of ground-motion wave-field map (regular grid of resolution 350 × 200) generated by using surface fitting. Each pixel presents an area of approximately 1 km2 . The color transfer function input is calculated from the amplitude of the three channels (east-west, north-south, vertical). The region of over 400 gal acceleration is indicated in red, while the region of lower acceleration is in blue. In this research, a total of 1000 ground-motion wave-field maps with a 0.1 second interval are generated from the sensor network readings of the 1999 Chi-Chi earthquake. These maps are stacked up in sequence to form a 1000 × 350 × 200 volume data to present the time-varying information in spatial form. This approach allows the time-varying information to be presented spatially. Volume rendering is used because it provides a means to present the seismic wave propagation sequence of an earthquake over time, allowing seismologists to observe the seismic wave propagation at a glance. Volume rendering is particularly useful in presenting the spatiotemporal relationship of the energy releases in volume data. The purpose is to discover the size and shape of the energy releases through color-coding the volume data.
4.1 Direct Volume Rendering of Wave-Field Volume Direct volume rendering using ray casting is a well-developed rendering technique that can visualize the internal structure of the 3D volume data. It displays the data directly without constructing geometric primitives to the samples first. Modern programmable GPUs accelerates ray casting, making volume rendering more usable and attractive. Formerly, Kruger and Westermann [8] presented a GPUbased ray caster implemented in the fragment shader with early termination and empty space skipping features. Another example, Lum et al. [11] presented a GPU-based volume rendering technique for interactive visualization of the time-varying volume data. In their design, a palette-based decoding technique was developed to fully utilize the texture mapping capability. The incremental subrange integration was proposed [10] to speed up pre-integrated volume rendering, which can minimize artifacts caused by regular sampling and generate high-quality visualization. A single-pass ray caster was developed by [21] to perform pre-integrated direct volume rendering. In this study, a GPU-based ray casting was developed for the visualization of seismic volume data sets, allowing for both orthogonal and perspective projection. It also enables the user to freely move the viewpoint around the volume data. The temporal information of the field-measured seismic data sets is visualized spatially so that the time history can be directly observed. Figure 3 shows the volume rendering of the wave-field volume data generated from acceleration records of 446 stations during the Chi-Chi earthquake. The most intensive energetic area (with reddish color tones) can be clearly identified, providing a good indication of the epicenter location. Figure 4 shows the volume rendering in three orthographic viewing angles. This approach brings new perspectives in studying sensor network readings, providing seismologists new visual analytical tools for verifying seismic mechanism. Visualizing sensor network reading reveals the sequence of seismic wave initiation, propagation, attenuation over time, and energy releasing events.
1 7 : 4 7 : 1 0
Ep i c e n t e r
1 7 : 4 8 : 0 0 1 7 : 4 8 : 5 0
17 : 4 7 : 1 0 1 7: 47 : 2 7. 7
0
9 0 0
Figure 3: Volume rendering of ground-motion wave-filed volume data of 446 stations. When first examined, the energetic area (with reddish color tones) can be clearly identified, providing a good indication of the epicenter location.
4.2 Interactive Modification of Transfer Function Two color schemes are used to represent the accelerograph readings of the three channels: (i) magnitude scheme and (ii) three-channel scheme.
17 : 48 : 50
Top Vi e w
Fr o n t Vi e w
Si de Vi e w
Ac c e l e r a t i on( ga l ) 0
900
Figure 4: Orthographic views of volume rendering (front-view, topview, and side-view). The temporal information is interpreted and presented spatially by treating time information as the third axis. The largest damage occurred at UTC 17:47:27.7 when the maximum acceleration was recorded.
4.2.1
Magnitude Scheme
The magnitude color scheme computes the magnitude from three channels (east-west, north-south, and vertical) and uses it as the input to the transfer function. A user interface is developed for interactively modification of the transfer function. To highlight significant events, a transfer function allows the user to see through the volume data. This is done by assigning high transparency to those voxels with small magnitude values, and high opaque values to those voxels with large values. In Taiwan, the Central Weather Bureau seismic intensity scale is used to indicate the strength of an earthquake in various parts of the island. The scale measures the seismic intensity of earth’s surface and the degree of seismic activity is divided into 8 categories. Therefore, the measured intensity level varies from place to place in an earthquake. The transfer function can be adjusted to show regions of different intensity scale individually. Figure 5(a) shows the screen shots of different intensity levels in volume rendering of the Chi-Chi data. The blue, cyan, green, yellow, and red color are used to represent category 3 to category 7 bubbles respectively. Figure 5(c) shows that some of the major energy releases were from adjacent active faults triggered by the bursts of extensive energy releases of the mainshock. During shocks at intensity scale category 7, even highly earthquake resistant buildings are severely damaged. Through visualization, different regions showed different intensity levels, providing insight to estimate potential damages of buildings that encounter category 7 seismic activity. 4.2.2
Ac c e l e r a t i o n( g a l )
1 7: 4 8: 0 0
Three-Channel Scheme
The three-Channel color scheme highlights three-channel components. Figure 6 shows the volume rendering of wave-filed volume data using the second color scheme. The red, green, and blue color is determined by the acceleration in the channel that dominates respectively, e.g., the red indicates the vertical acceleration is larger than the north-south and east-west acceleration, the green indicates the north-south acceleration is dominant, and the blue indicates the east-west acceleration is dominant. In an earthquake, the vertical ground acceleration can amplify the horizontal ground acceleration [9]. This visualization shows that the red dominant voxels mostly appear in the early readings of the stations. This can be explained by the fact that the arriving primary wave is coming directly from the hypocenter below the ground, traveling faster than other types of seismic waves. Without this kind of visualization, it
1 7 : 4 7 : 4 0 1 7 : 4 8 : 0 0 1 7 : 4 8 : 3 0
Ep i c e n t e r Ac c e l e r a t i o n( g a l ) 0 4 0 0 9 0 0 4567 J MAI n t e n s i t ySc a l e
(a) intensity 3,4,5,6, and 7
(b) intensity 4
(c) intensity 7
Figure 5: Screen shots of intensity levels in volume rendering of the Chi-Chi data. (a) The blue, cyan, green, yellow, and red colors are used to represent category 3 to category 7 bubbles respectively. (b) and (c) The opacity of the bubbles is changed to show each individual intensity level.
would be difficult to understand the overall distribution of the vertical dominant and the horizontal dominant. Furthermore, each of the red, green, and blue component can be faded out to individually examine the readings from each channel. For example, the vertical component can be completely faded out to highlight the horizontal accelerations. As shown in Figure 7, low energy regions are faded out to highlight large energy regions (>350 gal) in the second color scheme. It clearly shows that the amplitude of the horizontal motions is strongly dependent on the earthquake intensity. In large energy regions, the horizontal motions are dominant. In contrast, the vertical motions are less sensitive to the earthquake intensity and are not the dominant component in large intensity regions. Since the vertical accelerations are not significant, structural engineers mainly look at horizontal acceleration in earthquake resistant structural design. However, the visualization system presented in this paper can be applied in identifying those large vertical acceleration regions. When the vertical acceleration is larger, it is still a considering factor in the analysis of structural response subjected to both horizontal and vertical ground accelerations. 4.3
Real-Time User Interaction
The presented system provides the following two functionalities: (i) cut away and (ii) slicing. Cut away: The cut away feature allows the user to focus on the regions of interests. For example, zooming into the regions of a particular energy release event and isolating it from the others. Figure 8 shows the volume rendering of the central regions of the wave-filed volume data. Slicing: The visualization system has a slicing tool to go through layers for displaying ground-motion wave-field maps. A layer of the volume data is a static ground-motion map. Figure 9 shows wave-field snapshots at 40 and 65 seconds from the origin of the earthquake. The user uses a slider to display a layer, highlighting the important moments of any event. It provides a tomographic view of the data that allows the user to go through time sequences, observing the seismic wave propagation over time. 4.4
Showing the Structure of Time History
Examining time-space relationships of accelerograph readings can reveal important features of an earthquake event. For example, the order of rupture is observed from studying the seismic wave propagation over time. One way to study the time-space relationship of accelerograph readings is to identify the exact time of PGA in a station. The acceleration at a given time is the vector sum of three
1 7 : 4 7 : 1 0
1 7 : 4 7 : 5 0 1 7 : 4 8 : 5 0
Ve r t i c a l NS EW
Figure 6: The three-channel color scheme uses red, green, and blue to represent the vertical, north-south, and east-west channel respectively. The red represents that the voxel is dominated by the vertical component, i.e., the vertical acceleration is larger than the horizontal acceleration. The green and blue represent that the voxel is dominated by the north-south acceleration and the east-west acceleration respectively. Visualization of red dominant voxels shows a finding that vertical acceleration appears in the early stage of the earthquake. As can be observed, the vertical ground acceleration can amplify the horizontal ground acceleration.
acceleration vectors from the three recording channels. The occurring time of PGA can be precisely calculated from the readings. The recorded PGA value of a sensor station indicates the earthquake intensity in a specific geographic area, while the PGA time of that station indicates when a station experiences the most intense acceleration. The PGA is the parameter most commonly used in earthquake engineering. Seismologists are interested in finding out the occurring time of the PGA value at a station because it indicates when the most seismic wave energy propagates through this area. Since there were 446 sensor stations used in this study, a total number of 446 PGA times were computed from the data. Figure 10 shows the volume rendering was augmented with the PGA occurring times of 446 stations. For each station, a sphere was rendered
1 7 : 4 7 : 1 0
17: 48: 30 17: 48: 00
1 7 : 4 7 : 5 0
17: 47: 30
1 7 : 4 8 : 5 0
Ac c e l e r a t i on( ga l ) Ve r t i c a l
0
NS
900
EW
Figure 7: Low energy regions are faded out to highlight large energy regions in the second color scheme. This shows that the amplitude of the horizontal motions is dependent on the earthquake intensity. In large energy regions, the horizontal motions dominant. 17: 48: 30 17: 48: 00 17: 47: 30
Ac c e l e r a t i o n( g a l ) 0
9 0 0
Figure 8: Volume rendering of the central regions of the volume data. Cut away feature allows user to focus on the regions of interests.
according to its latitude, longitude, and its PGA time, i.e., each sphere indicates the time when the PGA occurs in the station. Observing the earthquake energy distribution over time helps scientists understand both wave propagation and fault rupture processes. The locations of the PGA times provide insights into understanding how seismic waves propagate from the epicenter. Another finding is that the distribution of these spheres is consistent with the trend of bubble formation. Without volume rendering and data augmentation, this phenomenon would be difficult to be observed. In order to capture the overall trend of how seismic waves propagate from the epicenter, an experimental approach was used to examine the distribution of seismic energy releases. Each sphere was connected with its closest neighbor using a 3D minimum spanning tree (MST). A MST is a tree with the shortest distance of any other spanning tree. The structure of the MST can give insights on how the seismic waves propagate throughout the island. As shown in Figure 10, the spheres of PGA times are connected by a 3D MST. High energy regions are faded out to highlight the MST structure, showing two trends appear in the second half of the volume data. The overall structure of MST suggests how the seismic waves in-
Figure 9: The visualization system has a slicing tool to go through layers and each layer of the volume data is a static ground-motion map. Two layers sliced at 17:47:45 and 17:48:15.
teract and with the inhomogeneous crust. The MST edges provide visual clues for seismologists to better understand the artificial time-space relationship of PGA recording times among stations in the sensor network. The following observations were made from the volume rendering augmented with MST: (i) The PGA times of those stations near the epicenter are located mostly within the first 35 seconds after the origin time. (ii) For the next 35 seconds, two trends begin to emerge, leading into two different directions. One trend leads into the northeastern part of Taiwan (the basin); the other trend leads into the southwestern part of Taiwan (the plain). (iii) From 70 to 100 seconds, these two trends separate further from each other. (iv) The MST structure suggests that the northeastern part and the southwestern part of Taiwan still reverberate towards the end of the readings. 5 R ESULTS AND D ISCUSSION The visualization system presented in this paper achieved 30 frames per second on a commodity PC with Core 2 Duo CPU, 2GB memory, and a GeForce 9600 graphics when the ray casting sample spacing is 0.005. Direct volume rendering provided visual clues for identifying major energy releases in the volume data that reflected 100 seconds duration of the sensor network readings. In the past, seismologists watched a video for 100 seconds to perform the same task. As a result, seismologists had to replay the video multiple times to identify major energy releases. Direct volume rendering offers an alternative approach to examine the data with various visualization techniques. This would speed up the process in assisting seismologists to understand the formation and dissipation of major energy releases. When the Chi-Chi earthquake data was volume-rendered, scientists were able to gain some new insights. Using volume rendering combined with the augmentation techniques, our seismologists collaborators discovered two findings: First, major energy releases occurred within the first half of the volume data (first 50 seconds after the earthquake). Second, some parts of Taiwan remained reverberating toward the second half of the data (from 50 to 100 seconds after the earthquake). Identifying Major Energy Releases: Major energy releases are shown in a series of concentric isoseismal contours, indicating the propagating direction of outgoing wavefronts. When chosen a suitable transfer function, the distribution of energy releases over time is seen through volume rendering. It reveals the initiation and the dispersion of the major energy releases. As shown in Figure 11, the major energy releases are identified as a cluster of irregular bubbles with high-energy cores shown in red and surrounding green layers
17: 47: 10
17: 48: 00
17: 48: 50
Ac c e l e r a t i on( ga l ) 0
900
Figure 10: Volume rendering is augmented with the PGA occurring times of 446 stations connected by a 3D minimum spanning tree. It provides insights into understanding how seismic waves propagate from epicenter. Another finding is that the distribution of these spheres is consistent with the trend of bubble formation.
of shells. The evolution of these bubbles provides a good indication of how seismic waves propagate throughout the island. Examining major energy releases leads to the following observations: (i) Major energy releases are mostly spotted in the early stage of the earthquake. (ii) These bubble-shape regions indicate the locations of strong energy releases. The epicenter can be identified by looking at the volume rendering directly. In fact, the epicenter is located near the first few major energy releases. (iii) The amount of energy released in an earthquake can be roughly estimated from the size of the bubble-shaped regions. Volume rendering showed the duration and impact areas of major energy releases. The spatial relationship between these bursts of energy indicated the order of ruptures. As seismic waves initiated from the epicenter and propagated outward, nearby faults were triggered into motion. The rupture dislocation phenomena can be identified in volume rendering. These findings from direct visual observation pointed out a new direction for further investigation. Our collaborators used direct volume rendering to search for high energy bubbles in the surrounding areas of the epicenter and farther regions. Seismologists explained that major energy releases farther away from the epicenter were caused by seismic waves bringing energy to trigger fault ruptures and releasing more energy in return. In fact, the Chi-Chi earthquake triggered two Mw 6 events on two other known faults nearby to the Chi-Chi mainshock epicenter. Identifying Soft Surface Sediments Effects: When the ChiChi earthquake volume data was georeferenced with digital terrain models, it indicated information of topographic effects. Toward the second half of the data, the volume rendering showed that the basin on Taiwan’s northern tip, the deposition plain on northeast coast, and the western plain remained reverberating with motions. In contrast, the other parts of Taiwan almost stop all seismic activities. This finding is consistent with the fact that soft surface sediments amplify and prolong ground motions [19]. 6
C ONCLUSIONS
Because of the high density of strong-motion sensor stations from the TSMIP sensor network, the 1999 Chi-Chi earthquake data sets have the richest recordings in modern times. The rupturing process and the wave propagation were well recorded. A volume data was made from the accelerograph readings of the earthquake. Compared with conventional methods plotting ground accelerations on a 2D map, volume rendering of the accelerograph readings provides alternative aspects to examine the time-space relationships of unusual events in the data. The case study presented in this paper
1 7: 47 : 2 0
1 7 : 4 7: 4 0
17 : 4 8 : 00
Ac c e l e r a t i on( ga l ) 0
900
Figure 11: Volume rendering of the first half of the Chi-Chi earthquake volume data. The red bubble-shape regions indicate the locations and durations of major energy releases.
demonstrates the use of volume rendering for data exploration and visual analysis. We also augment visualizations with careful color coding, PGA times, and the MST. From volume rendering, our collaborators in Taiwan National Center for Research on Earthquake Engineering have been able to gain the following insights: (i) Interesting features in the data can be identified when interactively adjusting the transfer function. Magnitude color scheme is used to classify regions into different seismic intensity levels. The three-channel color scheme shows that the vertical accelerations are larger than the horizontal accelerations in the early readings of the stations. (ii) The distribution of PGA times and the structure of MST suggest the overall propagation structure. Two trends emerge in the second half of the volume data, one trend is guided toward the northeastern basin, the other trend is guided toward the southwestern sedimentary plain. This demonstrates soft sediments can trap, amplify, and prolong seismic activities. (iii) Volume rendering is used to identify regions with strong accelerations, as known as major energy releases, which are shown as irregular contiguous bubbles. The size of the bubbles is determined by the amount of energy release. (iv) Seismologists conclude that major energy releases do not occur in particular order in time or
space. The major energy release caused by the fault rupture of the mainshock has larger size and longer duration than others. Insights gained through visualization aid seismologists in understanding earthquake characteristics. Future research in examining accelerograph readings of other large earthquakes to find similar phenomena would give more insights of the earthquake’s characteristics. From volume rendering, the major energy release bubbles can be interpreted as the locations of fault ruptures. This can be used to search for unknown faults. In addition, the bubbles reveal the rock strain along the faults in inhomogeneous crust. Furthermore, better understanding of seismic wave propagation patterns at different topological regions can provide reference data in evaluating and developing the probability-based earthquake resistant structural design criteria. Volume visualization of the seismic data can help guide the future deployment of equipment. In conclusion, volume rendering of field-measured TSMIP accelerograph readings can be used to verify earthquake simulations and to cross-reference readings from other types of seismological sensor data such as GPS instruments and aftershock data. ACKNOWLEDGEMENTS This research was supported in part by the U.S. National Science Foundation through grants OCI-0325934, OCI-0749217, CNS-0551727, CCF-0811422, OCI-0749227, OCI-0950008, CCF0938114 and OCI-0850566, and the U.S. Department of Energy through the SciDAC program with Agreements No. DE-FC0206ER25777 and DE-FG02-08ER54956. The 1999 Chi-Chi earthquake data was obtained from the National Center for Research on Earthquake Engineering and the Central Weather Bureau Earthquake Center in Taiwan. We would like to thank Dr. Jay Lin, Dr. Tao-Ming Chang, and Dr. Yuan-Sen Yang for evaluating the results of this study. R EFERENCES [1] V. Akcelik, J. Bielak, G. Biros, I. Epanomeritakis, A. Fernandez, O. Ghattas, E. J. Kim, J. Lopez, D. O’Hallaron, T. Tu, and J. Urbanic. High Resolution Forward And Inverse Earthquake Modeling on Terascale Computers. In Proceedings of the 2003 ACM/IEEE Conference on Supercomputing, page 52, 2003. [2] M. Antolik, C. S. C, D. Dreger, S. Larsen, A. Lomax, and B. Romanowicz. 2-D and 3-D Models of Broadband Wave Propagation in the San Francisco Bay Region and North Coast Ranges. Seismological Research Letters, 68:328, 1997. [3] P. Chopra, J. Meyer, and A. Fernandez. Immersive Volume Visualization of Seismic Simulations: A Case Study of Techniques Invented and Lessons Learned. In Proceedings of the IEEE Visualization 2002, pages 497–500, 2002. [4] A. Chourasia, S. Cutchin, and B. Aagaard. Visualizing the Ground Motions of the 1906 San Francisco Earthquake. Computers and Geosciences, 34(12):1798–1805, 2008. [5] A. Chourasia, S. Cutchin, Y. Cui, R. W. Moore, K. Olsen, S. M. Day, J. B. Minster, P. Maechling, and T. H. Jordan. Visual Insights into High-Resolution Earthquake Simulations. IEEE Computer Graphics and Applications, 27(5):28–34, 2007. [6] K. Hirahara, N. Kato, T. Miyatake, T. Hori, M. Hyodo, J. Inn, N. Mitsui, Y. Wada, T. Miyamura, Y. Nakama, T. Kanai, and M. Iizuka. Simulation of Earthquake Generation Process in a Complex System of Faults. Technical report, Annual Report of the Earth Simulator Center, 2004. [7] D. Komatitsch, S. Tsuboi, C. Ji, and J. Tromp. A 14.6 Billion Degrees of Freedom, 5 Teraflops, 2.5 Terabyte Earthquake Simulation on the Earth Simulator. Proceedings of the 2003 ACM/IEEE Conference on Supercomputing, 0:4, 2003. [8] J. Kruger and R. Westermann. Acceleration Techniques for GPUbased Volume Rendering. In Proceedings of the IEEE Visualization 2003, pages 287 – 292, 2003.
[9] Y.-K. Lin and T.-Y. Shih. Column Response to Horizontal-Vertical Earthquakes. Journal of the Engineering Mechanics Division, 106(6):1099–1109, 1980. [10] E. Lum, B. Wilson, and K.-L. Ma. High-Quality Lighting and Efficient Pre-Integration for Volume Rendering. In Proceedings of the sixth joint Eurographics-IEEE TCVG Symposium on Visualization, pages 25–34, 2004. [11] E. B. Lum, K.-L. Ma, and J. Clyne. Texture Hardware Assisted Rendering of Time-Varying Volume Data. In Proceedings of the IEEE Visualization 2001, pages 263–270, 2001. [12] K.-L. Ma, A. Stompel, J. Bielak, O. Ghattas, and E. J. Kim. Visualizing Large-Scale Earthquake Simulations. In Proceedings of the 2003 ACM/IEEE Conference on Supercomputing, pages 48–61, 2003. [13] G. P. Mavroeidis and A. S. Papageorgiou. Simulation of Long-Period Near-Field Ground Motion for the Great 1906 San Francisco Earthquake. Seismological Research Letters, 72:227, 2001. [14] A. Nayak, K. Lindquist, R. Newman, D. Kilb, F. Vernon, A. Johnson, J. Leigh, and L. Renambot. Using 3D Glyph Visualization to Explore Real-Time Seismic Data on Immersive and High-Resolution Display Systems. In Earth-Oceans-Atmosphere (EOS) Transactions of American Geophysical Union Fall 2003 Meeting, 2003. [15] Y. Okada, K. Kasahara, S. Hori, K. Obara, S. Sekiguchi, H. Fujiwara, and A. Yamamoto. Recent Progress of Seismic Observation Networks in Japan, Hi-net, F-net, K-net and KiK-net. Earth, Planets, and Space, 56:xv–xxviii, 2004. [16] D. Patel, C. Giertsen, J. Thurmond, J. Gjelberg, and E. Groller. The Seismic Analyzer: Interpreting and Illustrating 2D Seismic Data. IEEE Transactions on Visualization and Computer Graphics, 14(6):1571–1578, 2008. [17] M. Romero, J. Summet, J. Stasko, and G. Abowd. Viz-A-Vis: Toward Visualizing Video through Computer Vision. IEEE Transactions on Visualization and Computer Graphics, 14(6):1261–1268, 2008. [18] D. T. Sandwell. Biharmonic Spline Interpolation of GEOS-3 and SEASAT Altimeter Data. Geophysical Research Letters, 14(2):139– 142, 1987. [19] T.-C. Shin and T.-l. Teng. An Overview of the 1999 Chi-Chi, Taiwan, Earthquake. Bulletin of the Seismological Society of America, 91(5):895–913, 2001. [20] T.-C. Shin, Y.-B. Tsai, Y.-T. Yeh, C.-C. Liu, and Y.-M. Wu. Strong Motion Instrumentation Programs in Taiwan. International Handbook of Earthquake and Engineering Seismology, 81B:1057–1062, 2002. [21] S. Stegmaier, M. Strengert, T. Klein, and T. Ertl. A Simple and Flexible Volume Rendering Framework for Graphics-Hardware.based Raycasting. In Proceedings of the Fourth International Workshop on Volume Graphics 2005, pages 187–241, 2005. [22] T.-l. Teng, Y.-B. Tsai, and W. H. K. Lee. Preface to the 1999 Chi-Chi, Taiwan, Earthquake Dedicated Issue. Bulletin of the Seismological Society of America, 91(5):893–894, 2001. [23] Y.-B. Tsai and C.-P. Lee. Strong Motion Instrumentation Programs in Taiwan, Past and Present. Directions in Strong Motion Instrumentation, 58:255–278, 2005. [24] T. Tu, H. Yu, L. Ramirez-Guzman, J. Bielak, O. Ghattas, K.-L. Ma, and D. R. O’Hallaron. From Mesh Generation to Scientific Visualization: An End-to-End Approach to Parallel Supercomputing. In Proceedings of the International Conference for High Performance Computing, Networking, Storage and Analysis, 2006. [25] R. H. Wolfe, Jr. and C. N. Liu. Interactive Visualization of 3D Seismic Data: a Volumetric Method. IEEE Computer Graphics and Application, 8(4):24–30, 1988. [26] H. Yu, K.-L. Ma, and J. Welling. A Parallel Visualization Pipeline for Terascale Earthquake Simulations. In Proceedings of the 2004 ACM/IEEE Conference on Supercomputing, 2004. [27] D. A. Yuen, B. J. Kadlec, E. F. Bollig, W. Dzwinel, Z. A. Garbow, and C. R. S. da Silva. Clustering and Visualization of Earthquake Data in a Grid Environment. Visual Geosciences, pages 1–12, 2005. [28] H. Zhang, S. Chen, S. Chen, S. Chen, H. Jing, D. A. Yuen, and Y. Shi. Parallel Visualization of Seismic Wave Propagation. Visual Geosciences, 13(1):1610–2924, 2008.


![[PDF] Visualizing Data - Google Sites](https://m.moam.info/img/260x300/pdf-visualizing-data-google-sites_64785f01097c474e708cbd3f.jpg)