Visualizing Modeling Heuristics: An Exploratory Study Laurie B. Waisel Carnegie Mellon University Robotics Institute
[email protected] William A. Wallace and Thomas R. Willemain Rensselaer Polytechnic Institute {wallaw, willet}@rpi.edu
Abstract Rapidly advancing modeling technologies, such as data mining algorithms and new modeling languages, are making modeling accessible to an ever-broadening cross-section of knowledge workers. Advances in computer display technologies are also being incorporated into modeling software. Both research and anecdotal evidence suggest that visuals are important in the process of modeling. However, in order for potential modelers to make the most efficient and effective use of these new technologies, the software must incorporate visualization in such a way as to facilitate the process of modeling. In order to accomplish this, software designers and developers, who have tended to focus more on perceptual than cognitive issues, need to better understand the cognitive role of visualization in modeling. The goals of this research include 1) exploring the cognitive role of visualization in modeling, 2) gaining a better understanding of the process of modeling and moving it toward being a science, and 3) providing a more theoretical basis for the use of visualization in modeling tools. This paper will cover background on the process of modeling and visualization, mental models theory, our visualization-incorporating extension of mental models theory, the design of a Modeler’s Assistant tool, and an experiment in modeling and visualization using the Modeler’s Assistant.
Visualizing Modeling Heuristics: An Exploratory Study Laurie B. Waisel Carnegie Mellon University Robotics Institute
[email protected] William A. Wallace and Thomas R. Willemain Rensselaer Polytechnic Institute {wallaw, willet}@rpi.edu
1
Introduction
Every one of the perhaps 30 million users of spreadsheet software (Savage, 1996), can be considered a potential modeler. Rapidly advancing modeling technologies, such as data mining algorithms and new modeling languages (see, for example, Gassman, 1998) are making modeling accessible to an ever-broadening cross-section of knowledge workers. Advances in computer display technologies are also being incorporated into modeling software (Markham, 1998). In order for potential modelers to make the most efficient and effective use of these new technologies, they need to be provided with guidance on how to construct a model. This guidance presupposes some formalization of the process of modeling. Without this formalization, modeling remains solely an art (Powell, 1995b). Art is traditionally taught in studio-like settings, which is not feasible for the numb er of potential modelers. Therefore we need to understand the process well enough to provide, at the very least, simple guidelines and easy-to-understand aids for building models. In addition, we need to understand the role that visualization plays in the modeling process. Both research and anecdotal evidence (Bell & O'Keefe, 1995, Duce & Duke, 1995, Intons-Peterson, 1993, Rogers, 1995, Zmud, Anthony, & Stair, 1993) suggest that visuals are important in the process of modeling. However, the new modeling technologies must incorporate visualization in such a way as to facilitate the process of modeling. In order to accomplish this, software designers and developers, who have tended to focus more on perceptual than cognitive issues, need to better understand the cognitive role of visualization in modeling. The goals of this research include 1) exploring the cognitive role of visualization in modeling, 2) gaining a better understanding of the process of modeling and moving it toward being a science, and 3) providing a more theoretical basis for the use of visualization in modeling tools. This paper will cover background on the process of modeling and visualization, mental models theory, our visualization-incorporating extension of mental models theory, the design of a Modeler’s Assistant tool, and an experiment in modeling and visualization using the Modeler’s Assistant. The Modeler’s Assistant was implemented and the experiment conducted in the domain of groundwater flow modeling.
2
Modeling, visualization, and heuristics
Traditional theories of problem solving and modeling tend to describe a linear sequence of stages (Bartee, 1973, Churchman, Ackoff, & Arnoff, 1957, Cowan, 1986, Eilon, 1985, Evans, 1991, Hadamard, 1945, Schwenk & Thomas, 1983, Simon, 1960, Smith, 1989, Urban, 1974, VanGundy, 1988, Wallas, 1926). The use of stages is a standard procedure, yet the reality is that seasoned modelers often arrive at their models by an intuitive process developed after years of trial and error. Why, then, do researchers insist on distilling the art of modeling into a set of rules or stages? The answer lies in the tradeoff between portraying the process accurately and providing a tool that is helpful and easy to use. Stages provide a useful checklist and help organize an unstructured task (Evans, 1991). They “decompose a poorly understood process into components that can be analyzed and improved” (Smith, 1989). This question of how useful or accurate it may be to portray the modeling process as a sequence of stages is an open question in our research: is the tradeoff that has been appropriate for traditional theories of modeling still useful in a theory of visualization in modeling? The historical emphasis on the linearity of stage theories of modeling implies that each stage is visited once, and in order; yet the reality is that this linear portrayal of a sequence of stages represents a compromise between accuracy and ease of use. Urban (1974), Willemain (1995), Eilon (1985), and Schwenk and Thomas (1983) all note 1
that their stage models are not rigid, that the stages don’t necessarily occur in the order given, and that there may be frequent looping back to an earlier stage in what is essentially an iterative process. The process of modeling, that is, creating an abstraction of reality, "is a fundamental way in which human beings understand the world" (Powell, 1995a). Powell regards modeling heuristics as the key to both doing and teaching practical modeling, defining a heuristic as “an approach, a strategy, or a trick that experience has shown may help in constructing a useful model.” Powell’s list of important modeling heuristics includes visualizing (i.e., creating an external representation), since he notes that an “external artifact” is easier to refine than an “inchoate idea.” In thinking about how to pursue research on the role of visualization in modeling, and wanting to design a system that visualized a component central to the process of modeling, we began to consider building software that would visualize modeling heuristics, that is, taking Powell’s “visualize” heuristic and using it in the service of making other heuristics easier to employ. If, as Powell argues, heuristics are the key to practical modeling, and if visualization is a heuristic of primary importance, then a tool which performs visualization of heuristics, we reasoned, might multiply the power of both. Our criteria for selecting heuristics for visualization were that the heuristics must be 1) generally applicable (i.e., not restricted to a single problem domain) and 2) supported by the literature. Ultimately, the following four heuristics, which were derived from basic principles of model building and analysis, were selected: 1. Look where model output is interesting (OUTPUT). This idea goes back to a simple two-dimensional function and high first derivatives. If the first derivative of y is high, then it is self-evident that more x observations will be needed from that region in order to describe the function accurately. Where a function is changing rapidly, one needs a finer interpolation grid. 2. Look where model input is interesting (INPUT). The reasoning for input is the same as the reasoning for output. 3. Look far from known data (FAR). Texts on applied statistics commonly warn students of the dangers of extrapolation (see, for example, Devore, 1991, Weisberg, 1985), that is, using a model to make predictions for X values well outside the range of observations used to construct the model. A natural corollary of this warning is, “collect data from the region to which you wish to extrapolate,” or, in more general terms, collect data that is far from the data that you already have. 4. Look where error is large (ERROR). This heuristic is based on the concept of model validation. Validation and verification are related concepts. Model validation may be defined as “building the right system,” while model verification may be defined as “building the system right” (O'Keefe, Balci, & Smith, 1987). The process of validation includes assessing the predictive accuracy of the mathematical model. Predictive accuracy is evaluated by comparing the predicted response with the actual response. In an expert system, for example, system results are compared against expected performance (Lee & O'Keefe, 1994). Areas with large error point to places where the model needs to be tuned.
3 3.1
Theory Johnson-Laird’s mental models
The aim of this research is to explore the cognitive aspects of visualization during modeling. The cognitive process that goes on during modeling is considered to consist of the creation and use of a mental model. JohnsonLaird (1983, 1988) developed the theory of mental models, which he presents as a method for reasoning without rules of inference: One way in which a valid inference can therefore be made is to imagine the situation described by the premises, then to formulate an informative conclusion which is true in that situation, and finally to consider if there is any way in which the conclusion could be false. To imagine a situation is, I have argued, to construct a ‘mental model’ . . .
(Johnson-Laird, 1988, p. 227) He defines a mental model as a mental system of relations that has a structure similar to some other system of relations, and, applying mental models theory to the process of deduction, describes a three-stage operation: 2
comprehension, description, and validation. Johnson-Laird’s description of the process of deduction may also be applied to the process of modeling. Our research addresses Johnson-Laird’s description phase, which marks the point after the initial data have been assimilated and at the start of the creative process of manipulating data and ideas in the effort to find a solution. This stage of the problem solving process is often characterized as problem formulation. 3.2
Visualization in modeling: an extension of Johnson-Laird’s mental models In addition to mental models, Johnson-Laird (1983) argues that there are two other kinds of mental representation: propositional representations, and images. A propositional representation is comprised of a set of natural language formulations, such as a paragraph of text. Images (when used in the context of mental models theory) “correspond to views of mental models” (Johnson-Laird, 1983, p. 157, emphasis original); as such, they are mental images of mental models. COMPREHENSION Extract view from mental model
Mental Model
DESCRIPTION
How does the use of visualization impact the process of modeling? We hypothesize that visualization of the
Build mental model.
Modify mental model.
process being modeled leads to the building of better models. There aretwo ways in which this could occur. In the first scenario, visualization, a close cousin of mental imagery may enhance creativity to the extent that better models are created. In the second scenario, visualizing a model may lead to increased understanding of the model, and increased understanding may also lead to the creation of better models. If modeling performance can be shown to
Extract view from mental model.
Views Transcribe view to visualization. How does the use of visualization impact the process of modeling? We hypothesize that visualization of the process being modeled leads to the building of better models. There are two ways in which this could occur. In the first scenario, visualization, a close cousin of mental
Conduct within-model testing.
Anchor a view as a visualization
Does visualization accurately represent view?
Do visualization and view accurately represent the mental model?
Are view and visualization consistent with known facts?
Continue until modeler is satisfie d that within-model testing is complete. x →0
YES to all
NO to any
Move on to Validation
Visualizations VALIDATION How does the use of visualization impact the be shown to be improved that problem solving is a creative activity [Newell, 1962 #189; Evans, 1991 #312]; therefore, we assume that conclusions about creativity also apply to modeling. We will establish thatboth imagery and
Figure 1. Elements of visualization in model formulation.
Figure 2. The process of model formulation with visualization, which takes place entirely within Johnson-Laird's phase of Description.
As stated, our theoretical framework for visualization in modeling will be presented in the context of JohnsonLaird’s description phase of deduction. During comprehension, the information necessary for forming a mental model of the problem is gathered. During description, a mental model is formed based on the preliminary knowledge gathered during the comprehension phase. The contents of a mental model, like an SQL database, are inaccessible until the mental model-cum-database is queried and views of it are extracted. During the description phase, the modeler manipulates these views in his or her mind. See Figure 1 for a diagram of the relationships among mental models, views, and visualizations. The manipulation of mental images is a complex mental task that stretches the limits of working memory and can be enhanced through the use of external memory aids such as visualization 3
(Reisberg & Logie, 1993). Accordingly, the modeler translates the views into visualizations, either by drawing and/or writing or by using visualization software The views and visualizations are used for both within-model testing during description and between-model testing during validation. During within-model testing, the modeler tests the mental model for internal consistency and consistency with what is known about the problem situation. See Figure 2 for a diagram of this process. Both the within-model testing, which occurs during Johnson-Laird’s description phase, and the between-model testing, which takes place during Johnson-Laird’s validation phase, are iterative processes, continuing until the modeler is satisfied that the model has been sufficiently validated. This iterative quality of modeling was recognized by Morris (1967), who described the process of model building as including “alternation between modification of the model and confrontation by the data” (p. B-709). Confrontation by the data, in the visualization in modeling theory, takes place when the modeler checks that the views and visualizations are in accordance with what is known about the problem. 3.3
Modeling with computer visualization In order to facilitate scientific exploration of the role of visualization in the modeling process, we needed a theoretical framework appropriate for use with computer visualizations. The framework described above characterizes the elements in the modeling process and is important conceptually, but it does not provide a clear explanation of the interplay among those elements (mental models, mental images and external visualizations). That interplay must be accounted for more directly and precisely. Therefore, we enhanced the original theoretical framework by shifting its focus from the elements themselves to the processing that occurs between them. Figure 3 shows the revised model. The elements are basically the same as in the earlier version: mental model, view (i.e., internal mental image), and visualization (image in the external world). The mental model is still the longterm memory storage of all relevant aspects of the problem known to the modeler. A
Display
B Mental Model
View
D
C
Mouse
Figure 3. Modeling with visualization.
The letters describe the flow of data among the model elements as cognitive processing occurs, as well as a scheme for coding verbal protocols and system-collected data. A represents seeing. It describes the flow of data from the display to internal representation (the view). Protocol text coded as A might include such statements as “I see . . .” or “I am looking at . . .”. B represents thinking about what was seen. A statement such as “That dark patch tells me that . . .” would be coded as B, since it describes interpretation, or the drawing of a conclusion. C represents thinking about acting or the intent to act; that is, making a decision. “I’m going to drill a well” would be coded as C. D is the action itself, e.g., a mouse click, which is tracked by the computer system.
4
The experiment
As stated earlier, the problem domain of groundwater modeling was selected for the implementation of the visualization of modeling heuristics. The task of the modeler using the Modeler’s Assistant software (built with Matlab software version 5.1) was to decide where to drill the next well in order to get the best prediction of hydraulic head (i.e., height of the underground water column). The mental model being built was of the locations of wells that should be drilled. Each time a well was drilled, the system sampled the hydraulic conductivity at that location in order to predict the hydraulic head. Groundwater moves very slowly, at the rate of about one centimeter per day. The flow of groundwater is characterized by Darcy’s Law, which describes the flow of water through porous media (Schnoor, 1996):
q=
∆H K . q represents rate of flow, K the hydraulic conductivities (how easily water moves through a ∆x 4
porous medium such as rock or soil), distance traveled by the water.
∆H
the change in hydraulic head or energy (i.e., water level), and ∆x the
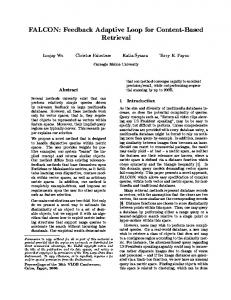
In brief, what the Modeler’s Assistant does is this: 1) accepts a few sample H and K measurements, 2) interpolates to a full K data set, using the sampled K’s, 3) uses Darcy’s Law to solve for H, and 4) calculates accuracy by comparing predicted H with sampled H. Modelers may select (or deselect) rules and drill wells at sites of their choosing. The visualizations of the modeling heuristics derived for this research are generated by color-mapping. The heuristics are mapped to colors so that the highest values are white, the lowest values are black, and intermediate values are varying shades of blue. The OUTPUT rule generates values for the rate of change of hydraulic head (H). Therefore, areas with rapid change in head would be white, and areas with no change in head would be black. The INPUT rule generates values for the rate of change of the interpolated conductivities (K). The FAR rule generates a “nearest neighbor” value, a measure of how close a given location is to the wells that have already been drilled. The ERROR rule generates a measure of how close the predicted head is to the actual head at sampled locations. The full visualization version (as opposed to partial or no visualization of heuristics) of the Modeler’s Assistant allows modelers to view combinations of the four modeling heuristics. The resulting effect is that “hot spots” (i.e., white areas) that are in the same place in several heuristics reinforce each other, while “hot spots” in different locations may cancel one other out. Figure 4 shows a screen image from the Modeler’s Assistant with full heuristics visualization. The image in the window on the right (“Where Next Controls”) shows the grid of conductivity values (one value per cell), which are input to the groundwater model. The image in the window on the left (“Modeling Heuristics”) shows a visualization of the combination of heuristics checked off from the list below the image — in this case, the last three heuristics are checked. Black indicates the lowest value and white the highest. The white end of the color-mapping scale points out “hot spots” with regard to the four heuristics, individually and in combination. Asterisks show locations of wells that have already been drilled. When a well is drilled, its conductivity is “measured,” i.e., retrieved from the hidden reference data set, and becomes known to the system.
Figure 4. Modeler’s Assistant screen shot.
In the “Where Next Controls” window, the user is shown the score (lower is better), which is the sum of all absolute deviations between the model output from interpolated data and the model output from the hidden reference data. The task of the user is to decide where to drill the next ten wells in order to provide sample data for the interpolation process that yields the best (i.e., closest to reference data) model output.
5
The user always has a choice of three actions: highlight a cell in the grid, click the “Drill Well” button to drill a well at the highlighted location, and check or uncheck a modeling heuristic (thus changing the visualization in the “Modeling Heuristics” window). He relies on the heuristics visualizations to help him decide where to drill the next well and sample the conductivity. Common sense and expert judgment interact to help the user decide which combinations of heuristics to use in the decision making process. 4.1
Experimental Design A balanced incomplete block design with repeated measures was used for this experiment (see Figure 5). A total of 24 trials were conducted. Two experimental factors, visualization level and skill level, were tested while holding constant or neutralizing confounding variables (such as individual differences between modelers, learning effects, data set effects, and rule order effects). The factor of greatest interest to us was visualization level, which took on the values of Full, Partial or None. A secondary factor was skill level, which took on the values of Expert (professional engineer) or Novice (engineering student). This factor was chosen in order to see how differences in visualization affect experienced engineers as opposed to engineering students. Blocking factors were modeler and rule order. There were a total of twelve modelers or participants: six experts and six novices. Each modeler did two treatments, and each pair of modelers doing the same two treatments did them in reverse order. A treatment consisted of the combination of the modeler’s skill level with the visualization level, with each modeler doing two of the three available visualization levels. Visualization level refers to the degree of visualization available to the user. “Full heuristics visualization” allowed the modeler to view the heuristics singly and in combination. “Partial heuristics visualization” allowed the modeler to view the heuristics one at a time only, not in combinations. “No heuristics visualization” did not display the heuristics visualizations at all; instead, it displayed the text of the heuristics, along with the textual suggestion that these rules of thumb may be useful to the modelers. The image shown in Figure 4 is of the full visualization system, which is made apparent by the fact that multiple heuristics have been checked. Rule order refers to the order in which the heuristics are listed on the screen — it was important to neutralize any tendency for modelers to use the first heuristic on the list simply because it was first.
Experts
Novices
A B C D E F G H I J K L
Data Set 1 Rule Order 1 N
Data Set 2 Rule Order 2 P
F
N
P
F
N
P
F
N
P
F
Data Set 1 Rule Order 3
Data Set 2 Rule Order 4
P
N
N
F
F
P
P
N
N
F
F
P
Figure 5. Experimental design. Cell values of N, P, or F indicate the visualization level for that trial.
4.2
Experimental Protocol Both subjective and objective data were collected. Objective data has the advantage of being easier to reproduce and analyze; however, it can lack the depth and complexity of subjective data. Subjective data, while often difficult to reproduce, gives more insight into the modeler’s thought processes. The subjective data collection tools used in this research were questionnaires and think-aloud protocols. Separate pre-session questionnaires were used for novices and experts. The pre-experiment questionnaires focused on biographical data from the participants in order to assess their degree of problem domain experience, technology experience, and experience with statistics and modeling. The post-experiment questionnaire was designed to assess the participant’s subjective experience. The bulk of the objective data will be analyzed in a separate paper. Ericsson and Simon (1993, p. 220) have found that “thinking aloud protocols and retrospective reports can reveal in remarkable detail what information [participants] are attending to while performing their tasks.” The method used for this experiment was a basic think aloud instruction modified by emphasis on reporting thought processes of interest with regard to the theoretical framework. Ericsson and Simon report that it is not uncommon 6
for researchers to request that experimental participants recount specific thought content or processes or what they are perceiving visually. The participants in this research were asked to report what they were looking at on the screen (corresponds to A in the theoretical framework) , what they were thinking about what they saw (corresponds to B in the theoretical framework), and what they were thinking about doing next (corresponds to C in the theoretical framework). The order of this list of things to report was systematically varied for different participants in order to balance any effect that the order might have on participants’ thought processes and reporting. The experimenter tried to remain silent during the sessions, speaking only to answer participants’ questions or to prompt them when they had remained silent for an unusually long time, for ten seconds, for example. A user tracking system, modeled on Mouselab (Payne, Bettman, & Johnson, 1993), was built into the software to collect data on user actions. The experimental trials, in which the computer monitor was videotaped and participant responses were audiotaped, consisted of the following sequence of events: participants 1) filled out the pre-session questionnaire and consent form, 2) had the first practice session, 3) performed the first think-aloud protocol, 4) had a second practice session, 5) performed the second think-aloud protocol, and 6) filled out the postsession questionnaire.
5
Results
The think aloud protocols were transcribed from the videotapes. The coding of the speech was integrated with the event data already collected by the user tracking system. The segmentation of the speech was determined by the coding. The participants had been instructed to use the mouse cursor to indicate where they were looking; hence the combination of the spoken word “here” combined with pointing at a specific place on the screen was coded as “A.” A sentence such as “I am going to drill here,” combined with mouse pointing at the end of the sentence, was coded as C-A. The changes in process from looking to thinking about what was seen to deciding to act were too quick and fine-grained to segment the text by sentence or even by phrase. The basic model for coding was A = seeing, B = thinking about what is/was seen, C = making a decision to act (in the immediate future), and D = mouse click. Since the D codings were taken directly from the user tracking system, whereas the A, B, and C codings were based on modelers’ think-aloud narratives, the D data occurs in real time, whereas the A, B, and C data occur after the fact. For this reason, retrospective explanations of actions taken, e.g., “I picked that spot because . . .”, were sometimes heard. These were coded as C. Inter-coder reliability was tested thoroughly, using multiple methods and the design in Figure 6. The results of two of these methods are presented here. Visualization Level
Coder 1
Coder 2
None
Expert (L22CE)
Novice (L22IN)
Partial
Novice (M42LN)
Expert (M22AE)
Full
Expert (H31FE)
Novice (H42JN)
Figure 6. Inter-code r reliability design.
A Cohen’s Κ analysis (Cohen, 1960) of inter-coder reliability produced the results shown in Figure 7. The second column for each coder takes into account the actual upper bound of reliability, rather than the theoretical upper bound of 1. Experimenter - Coder 1
Trial
L22CE M42LN H31FE L22IN M22AE H42JN
Cohen’s K with 95% confidence limits .87 ± .04 .78 ± .06 .78 ± .06
Cohen’s K adjusted for marginaldistribution based upper bound .93 .89 .94
Experimenter - Coder 2 Cohen’s K with 95% confidence limits
Cohen’s K adjusted for marginaldistribution based upper bound
.90 ± .04 .73 ± .05 .88 ± .05
.90 .83 1.0
Figure 7. Cohen’s K for inter-code r reliability.
7
An analysis of transitions data for each coder led to the results in Figure 8. Chi-square statistics are given for the correspondence between coders’ and experimenters’ transitions data. Clearly, all of the chi-square statistic values are well below the rejection level (24.994, α = .05, d.f. = 15), indicating a high degree of inter-coder reliability. The inter-coder reliability data tell us that the elements A, B, C, and D, can be identified reliably by multiple coders. The sequences of transitions among A, B, C, and D provide information about the extent to which the empirical sequences follow the sequence of “ABCD” given in the model (as depicted in Figure 3). The sequence data for each trial were analyzed by looking at the sub-sequences of letters that occurred between mouse clicks. Figure 9 displays the counts and proportions for these segments. While only 2.6% of the segments were full ABC’s, nearly half the segments contained some portion of ABC. There are two ways to regard the missing letters. One way is to assume that the measurement tool of verbalization did not pick up all of the steps of modeling with visualization. The existence of the missing steps would then be inferred; e.g., for the segment BC, the inference is that it was preceded by an A. The other way is to accept the measurement as accurate and note that looping and iteration take place, as postulated by Morris (1967) and found by Willemain (1995). Experimenter Trial
Coder 1
L22CE
9.326
M42LN
7.224
H31FE
7.736
χ
2
Experimenter Coder 2
L22IN
7.876
M22AE
5.339
H42JN
10.06
χ
2
Counts 27 160 158 25 56 11 24 461 932
Proportions .029 .172 .170 .027 .060 .012 .026 0.496 1.000
Skill Level
Preference
Figure 9. Counts and proportions for “ABC” segments and partial segments.
Modeler
Figure 8. Matrix agreement table for pairs of coder transitions.
Segment A B C AB BC AC ABC Subtotal of partial and full “ABC” Total segments of all segments
A
E
N>P
“Can simultaneously see the error screen and head value screen and K screen — I make mental estimates of the gradients, so don’t need to rely on the gradients being calculated.”
B
E
P>N
“Slightly [prefer partial heuristics visualization], seemed to have more info. Would have been nice to have four windows available simultaneously for [partial heuristics visualization].”
C
E
F>N
“Love of statistics. 1) Not just single points, more spatial, and 2) ability to combine different [heuristics].”
D
E
F>N
“Seems more user friendly being able to layer heuristics, layer is easier than visual comparison.”
E
E
F>P
“Overlays of ‘error’ with other info was useful in pinpointing areas that needed more in-depth analysis.”
F
E
F>P
“Being able to view heuristics singularly or in combination aids in the decision making process.”
G
N
P>N
“I can return to the choices to see what I need and what happened [to the heuristics visualizations] after I made my decision.”
H
N
P>N
“In [partial heuristics visualization] the error heuristics screen was much easier to use and understand because it showed the error for points around the well.”
Comments
I
N
N>F
“Error box was more helpful. I felt like I could understand what was going on better.”
J
N
F>N
“I could combine the heuristics rules, which made it easier to see where I wanted to drill a well.”
K
N
F>P
“It makes it easier to compare two or more displays at a time and combined the thoughts [rather than making me] memorize it.”
L
N
F>P
“It allowed you to visualize two separate ideas superimposed upon each other, eliminating the time it takes to think that way.”
Figure 10. Comments from post-experiment questionnaires.
5.1
Analysis of questionnaire data Participants were asked, “Did you find the displays in one of the two sessions more helpful than the displays in the other?” Figure 10 lists the participants, their skill levels, and their display preferences (for example, N>P means the modeler preferred No heuristics visualization to Partial heuristics visualization). All participants but two preferred higher levels of heuristics visualization. This suggests that, generally speaking, “more is better” in terms of 8
information density of visualizations; however, it is important to provide options for less complex visualizations for novices who might be overwhelmed by a high degree of information density. Similarly, it also is important to provide customization options for experts who will want to fine-tune the visualizations to fit their particular pattern of skills and knowledge.
6
DISCUSSION
The theoretical framework for modeling with visualization (as represented in Figure 3) facilitated our exploration of how cognitive problem solving processes interact with visualization. We found that the components of the framework were in evidence in the experiment. However, using measurement tools such as verbalization and the location of the mouse pointer, we found it difficult to tell whether the sequence given in the theory describes the mental processes of visualization and problem solving. Despite the lack of evidence for a particular sequence of the theory’s elements, however, the theory does have validity as an organizing principle for parsing observed behavior, as demonstrated by the high inter-coder reliability results. It is a useful way to describe and compare modeling behavior. Note that the lack of strong evidence confirming a particular sequence of stages does not invalidate the theory of visualization in modeling. As mentioned earlier, researchers in the process of problem solving have noted that stage models are not rigid, and that looping and iteration take place. The Modeler’s Assistant prototypes a method for visualizing modeling heuristics, that is, basic rules of thumb on which modelers rely. The software took fundamental intuitions that all modelers use and clarified and heightened them by making them visual and allowing the visualizations to be overlaid in various combinations. The generalizability of this method of visualizing modeling heuristics may make it possible to develop a standardized way to visualize the fundamental aspects of any modeling problem. Based on the post-experiment questionnaires, there seemed to be three key areas where the participants had strong preferences: simultaneity, layering, and complexity of information. Together, these areas contribute to an overall level of information density. Simultaneity refers to how many different displays are visible at the same time. Several modelers expressed a preference for greater degree of simultaneity, and no one complained that there was too much. Layering refers to displaying multiple layers of data at the same time. Our results suggest that while having the capability to layer data is important, it is also important to have a graceful way to view both layered heuristics data and data from a single heuristic. Three types or degrees of complexity of information were provided in the Modeler’s Assistant: raw data, first differences, and interpolations. The participants’ written and verbal comments suggest that people have varying comfort levels with differing degrees of information complexity in visualizations. The primary contribution of the theoretical framework for visualization in modeling is that it transforms Johnson-Laird’s conceptual mental models work into a measurable model, an operationalized theory that can be studied empirically. The model may also be useful in education, software design, and team modeling, all areas which would benefit from a better understanding of how users interact cognitively with visualization-assisted modeling tools. The authors gratefully acknowledge the support of grant SBR-9730465 from the National Science Foundation.
7
References Cited
Bartee, E. M. (1973). A holistic view of problem solving. Management Science, 20(4), 439-448. Bell, P. C., & O'Keefe, R. M. (1995). An experimental investigation into the efficacy of visual interactive simulation. Management Science, 41(6), 1018-1038. Churchman, C. W., Ackoff, R. L., & Arnoff, E. L. (1957). Introduction to Operations Research. New York: John Wiley & Sons. Cohen, J. (1960). A coefficient of agreement for nominal scales. Educational and Psychological Measurement, 20(1), 37-46. Cowan, D. A. (1986). Developing a process model of problem recognition. Academy of Management Review, 11(4), 763-776. Devore, J. L. (1991). Probability and Statistics for Engineering and the Sciences. (3rd ed.). Pacific Grove, CA: Brooks/Cole Publishing Company. Duce, D. A., & Duke, D. J. (1995, 7-9 June 1995). Interaction, cognition and visualization. Paper presented at the Second Eurographics Workshop on Design, Specification, Verification of Interactive Systems. DSV-IS '95, Toulouse, France. pp. 1-20. 9
Eilon, S. (1985). Structuring unstructured decisions. Omega, International Journal of Management Science, 13(5), 369-377. Ericsson, K. A., & Simon, H. A. (1993). Protocol Analysis: verbal reports as data. Cambridge, MA: MIT Press. Evans, J. R. (1991). Creative Thinking In the Decision and Management Sciences. Cincinnati, OH: South-Western Publishing Company. Gassman, H. I. (1998). Modelling support for stochastic programs. Annals of Operations Research, 82, 107-137. Hadamard, J. (1945). The Psychology of Invention in the Mathematical Field. Princeton, NJ: Princeton University Press. Intons-Peterson, M. J. (1993). Imagery's role in creativity and discovery. In B. Roskos-Ewoldsen, M. J. IntonsPeterson, R. E. Anderson, & P. A. Vroon (Eds.), Imagery, Creativity, and Discovery: A Cognitive Perspective (pp. 1 - 37). Amsterdam: Elsevier Science Publishers B.V. Johnson-Laird. (1983). Mental Models: Towards a Cognitive Science of Language, Inference, and Consciousness. Cambridge, MA: Harvard University Press. Johnson-Laird, P. N. (1988). The Computer and the Mind. Cambridge, MA: Harvard University Press. Lee, S., & O'Keefe, R. M. (1994). Developing a strategy for expert system verification and validation. IEEE Transactions on Systems, Man and Cybernetics, 643 - 655. Markham, S. E. (1998). The scientific visualization of organizations: a rationale for a new approach to organizational modeling. Decision Sciences, 29(1), 1-23. Morris, W. T. (1967). On the art of modeling. Management Science, 13(12), B707-B717. O'Keefe, R. M., Balci, O., & Smith, E. P. (1987). Validating expert system performance. IEEE Expert, 2(4), 81-89. Payne, J. W., Bettman, J. R., & Johnson, E. J. (1993). The Adaptive Decision Maker. Cambridge, UK: Cambridge University Press. Powell, S. (1995a). Six key modeling heuristics. Interfaces, 25(4), 114-125. Powell, S. (1995b). Teaching the art of modeling to MBA students. Interfaces, 25(3), 88-94. Reisberg, D., & Logie, R. (1993). The ins and outs of working memory. In B. Roskos-Ewoldsen, M. J. IntonsPeterson, & R. E. Anderson (Eds.), Imagery, Creativity, and Discovery: A Cognitive Perspective (pp. 39-76). Amsterdam: Elsevier Science Publishers B.V. Rogers, E. (1995). Visual interaction: a link between perception and problem solving. In J. Glasgow, N. H. Narayanan, & B. Chandrasekaran (Eds.), Diagrammatic Reasoning (pp. 481-500). Cambridge, MA: MIT Press. Savage, S. (1996). Innovative use of spreadsheets in teaching. OR/MS Today, 23(5), 41. Schnoor, J. L. (1996). Environmental Modeling: Fate and Transport of Pollutants in Water, Air, and Soil. New York: Wiley. Schwenk, C., & Thomas, H. (1983). Formulating the mess: the role of decision aids in problem formulation. Omega, International Journal of Management Science, 11(3), 239-252. Simon, H. A. (1960). The New Science of Management Decision. New York: Harper & Brothers. Smith, G. F. (1989). Defining managerial problems: a framework for prescriptive theorizing. Management Science, 35(8), 963-981. Urban, G. L. (1974). Building models for decision makers. Interfaces, 4(3), 1-11. VanGundy, A. B. (1988). Techniques of Structured Problem Solving. New York: Van Nostrand Reinhold Company. Wallas, G. (1926). The Art of Thought. New York: Harcourt, Brace and Company. Weisberg, S. (1985). Applied Linear Regression. (2nd ed.). New York: John Wiley & Sons. Willemain, T. R. (1995). Model formu lation: What experts think about and when. Operations Research, 43(6), 916932. Zmud, R. W., Anthony, W. P., & Stair, R. M., Jr. (1993). The use of mental imagery to facilitate information identification in requirements analysis. Journal of Management Information Systems, 9(4), 175-191.
10