May 27, 2015 - stepwise optimization of complex queries in patent searches. The design ideas are ... Select Database, Formulate Query, Examine Results, Extract. Info/Report .... the question arises if and how the searchers can abstract from the ... iterations. Interviews with domain experts from several technical fields have.
Visualizing Query Comparisons in Patent Retrieval Systems Julia J. Jürgens Thomas Mandl Christa Womser-Hacker Dept. of Information Science & Natural Language Processing University of Hildesheim Universitätsplatz 1 - 31141 Hildesheim, Germany
{juerge, mandl, womser}@uni-hildesheim.de
ABSTRACT Patent retrieval is a very complex process where users need to be supported in order to finish their tasks efficiently and effectively. There are many tasks in the process that can benefit from such tools, one being the phase of query formulation. Being a highly manual task, it is only possible to precompute possible helpful data and to then visualize it for the user. The process of querying and the pertaining results of information retrieval systems can be visualized in many ways. We present two prototypical system designs for comparing the queries in patent retrieval. The prototypes include elements of the query structure as well as the results set size. Both are crucial elements for patent experts to explore the effect of changes in a query. Our system supports the stepwise optimization of complex queries in patent searches. The design ideas are based on knowledge engineering with domain experts.
Keywords Patent Retrieval, Information Retrieval, User Centered Design.
1.
Visualization,
Information
INTRODUCTION
tools. Two concrete prototypical visualizations are suggested. They were gained by using a user-centered development approach. The paper is structured as follows. Section 2 gives a short introduction into patent information retrieval and explains the motivation for our prototypes. In Section 3, the field of information visualization is described and the potential for patent retrieval tasks is highlighted. Related work is presented in Section 4. Our prototypes are described in Section 5 before concluding the paper in Section 6.
2. PATENT INFORMATION RETRIEVAL Patent retrieval differs from other retrieval processes in several ways [Lupu et al. 2011]. Of particular importance is the professional character of patent searches which emphasizes diligence and which leads to complex queries. Patent queries can be one page long and may encompass many fields and may contain dozens of parameters. The development and maintenance of such a query strategy requires elaboration and iterative optimization [Bonino 2010].
Patents are one of the most important sources for recent technology information. Over 2 million new patents are registered worldwide with high growth rates especially in Asia nowadays. The retrieval of relevant information from patents is of crucial importance for investments of enterprises.
One way to support the complexity for patent searchers is the implementation and integration of more value-added components like trend analysis [Kim et al. 2009] or network analysis [Han 2014], advanced linguistic analysis [Becks 2013] or even forecasting and predictive analysis [Jung & Ha 2015].
In this paper, we analyze the role of information visualization in patent retrieval and present how the field can benefit from visual
Currently, approaches taking a broader view at search processes and information behavior [Widen et al. 2014] are applied also to patent retrieval. A behavior model was developed which takes into account the phases of patent retrieval processes by patent experts [Jürgens & Womser-Hacker 2014].
Copyright © 2015 for the individual papers by the papers' authors. Copying permitted for private and academic purposes. This volume is published and copyrighted by its editors Published at CEUR-WS.org Proceedings of the 2nd International Workshop on Patent Mining and Its Applications (IPaMin 2015). Beijing, May. 27-28, 2015.
This model defines and explains the following seven subprocesses of patent retrieval: Recognize/Accept, Define Problem, Select Database, Formulate Query, Examine Results, Extract Info/Report, Reflect/Stop. The iterative character is clarified by the many arrows between the sub-phases. Jürgens & WomserHacker (2014) further highlight the difficulties in these steps. The query formulation phase e.g. is one of the most critical tasks in the
process since the problem needs to be translated into a query. The quality of the query is highly dependent on the expertise and the experience of the patent searcher. This means that automatic approaches alone fall short during this step, they can only be a means for inspiration. Systems therefore need to deliver precomputed data which then has to be presented to the user so (s)he can further interact with it to be able to make better decisions. A field that is concerned with exactly such a scenario is information visualization.
3.
of the classes comply with the percental change in the number of documents in comparison to the previous interval: green classes denote an increase in patents and red ones a decrease. A third color is introduced when it comes to the analysis of specific portfolios by assignees. Here, yellow rectangles signify that the applicants had not been granted patents in that specific class. The author also visualizes these treemaps on a timeline to better understand the evolution of the patent landscapes [Kutz 2004].
INFORMATION VISUALIZATION
Visualization intends to make data more easily understandable for humans. By making use the tremendous visual processing capabilities of human brains, system engineers can present more data than in textual or numerical modes. Visualizations can be applied either as a presentation tool to communicate ideas, explain data or provide support or they can be used for analysis where very complex data is illustrated and users can make use of a variety of interaction techniques. Especially this latter use of visualizations can lead to a dialog between the analyst and the data that promotes exploration and learning. Visualization is thus helpful in gaining insights, not only in the meaning of spontaneous “aha”-moments but also from the perspective of knowledge building [Chang et al. 2009]. In patent retrieval, both forms of visualizations can be of avail. In some search scenarios (like the state-of-the-art search), it is sufficient to get a general understanding of the field. Here, visualizations that give the user an overview, e.g. over the top inventors or technologies, can be valuable. In other situations (like the validity search), a large number of patents needs to be examined in depth to extract the relevant passages. Here, visual tools that support this analytical task could be applied. In critical scenarios, the visual exploration of similar patents is also imaginable. The use cases for visualizations during complex patent searches are numerous. Visualizations currently offered in patent search systems and discussed in research are described in the next section.
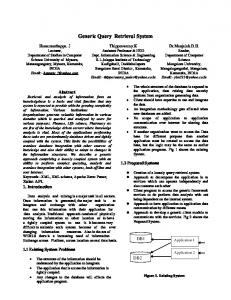
Figure 1. Visualization of a result set based on publication countries [Questel]
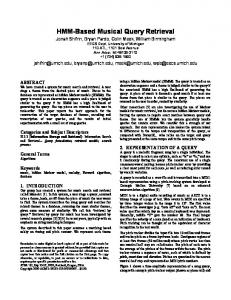
4. RELATED WORK: VISUALIZATION IN PATENT RETRIEVAL Patent retrieval systems on the market integrate more and more visualization techniques. They mostly integrate classical diagrams and presentation techniques into the result analysis (see Figure 1). Some software products also contain more sophisticated visualizations such as 3D-landscapes (see Figure 2). Independent from their specific visualizations, all systems focus on the presentation of result sets so that the potential of visualization for the retrieval process is often not fully exploited. On the one side, research concerning the use of visualizations in patent systems is rather limited. On the other side, very different applications for visualizations have been examined, ranging from the presentation of the whole patent space to result set visualization and visualizations that should ultimately help users with improving their search queries. Kutz (2004) used treemaps to visualize all patents of the USPTO archive between 1976 and 2002 on the basis of their 466 IPC classes. The data set was examined in 5 year intervals. The colors
Figure 2: Patent Landscape [STN Anavist]
The close coupling of query formulation and result assessment has long been discovered in traditional information retrieval and its effectiveness been demonstrated in systems such as the alpha slider system by Ahlberg & Shneiderman (1994). The prototype by McLean (2000) follows exactly this idea and aims to “integrate retrieval with interaction“. On the basis of requirements collected from patent searchers, he built a system where users can create “query stacks“. The users start from a broader query and then refine it using certain filters. The results are immediately shown on a 2-dimensional plot of results so that the consequences of
changes in the query can be quickly viewed in the plot. Each patent is shown as a small rectangle, its position on the plot is determined by similarity measures. Certain attributes such as the IPC class can be colored as shown in Figure 3 [McLean 2000].
was modeled by introducing relevance feedback for individual documents. The effects of the relevance decisions of the user were immediately interpreted by the system and the ranking was adapted. Here, visualization was used to increase the transparency of the ranking algorithm. As seen on Figure 6, the changes of positions compared to the last ranking were shown for each document. That way the user could explore extreme changes and find more interesting documents with potentially more relevant terms [Hackl 2009].
Figure 3: Query Stack and Result Visualization [McLean 2000] The system PatViz by Koch et al. (2009) has the same goal. It also lies its focus on the integration of insights from the analysis of result sets into the reformulation of queries. The authors developed ten views (e.g. a patent graph and a geo-timeline) that show different perspectives on the current result set and that are linked so that users can make use of brushing. A further view called Filter Graph was developed to use different sets of results as building blocks to produce complex extraction strategies (see Figure 4). The different kinds of nodes allow the user to produce subsets of the result set using filters and other operators and to combine these in customized ways. Although this idea could be further adapted to query formulation, its application is currently restricted to result sets. Another visualization by the same authors also picks up the idea by McLean (2000) of presenting the different query facets of a search. Since their tool PatViz is based on work in the PatExpert project, where different search functionalities like full text search, metadata search, image similarity search, semantic search, and document similarity search are provided, the authors constructed a visual tool that allowed the user to combine these different searches. As depicted in Figure 5, the various search types are all presented in unique colors (Image similarity search (blue), semantic search (grey), keyword search (green), and metadata search (orange)), making it easy and obvious for the user to see how a query is constructed. The system by Hackl (2009) also aspires to optimize the patent search query, although by a different approach, namely relevance feedback. The system PatentAide aims to make weighting and advanced scoring models more transparent for patent retrieval where Boolean matching is still most widely used. PatentAide allows Boolean as well as probabilistic matching and ranking. The typical information behavior of stepwise optimization of a query
Figure 4: Filter Graph [Koch et al. 2009]
Figure 5: Visual integration of different search facilities [Koch et al. 2009 ]
spend a lot of time and effort in constructing the queries and demand a high degree of control over them. They desire a wide variety of search possibilities and appreciate systems that take the special requirements into account. We developed and designed two prototypes which allow the comparison of queries from two different points of view. The effect of changing parameters is shown to the user by different means. The prototypes are well suited to explore and optimize complex queries in interaction sequences.
Figure 6: Dynamic Relevance Feedback [Hackl 2009] The prototype by Herr et al. (2014) consists of two views that should support the user in identifying relevant IPCs to improve their search queries. The authors adapted tag clouds to visualize co-occurrences between IPC classes. They compute the pair-wise similarities of IPC subclasses based on their co-use in patents and map these onto a 2D-plane. Two different views are available to the user. In the first one, called map view, it is possible to gain a general overview of all IPC subclasses used in a patent set. The similarity between these classes is depicted by their distance and the font size displays the overall frequency of the IPC subclass in the set. The darts view lets users specify a class as a focus. Like on a dartboard, co-occurring subclasses are presented on concentric circles. As can be seen from the above literature, there have been some attempts to support patent searchers during query formulation. The users can learn from consequences on result sets or from metadata such as IPC classes. The first idea seems very logical but the question arises if and how the searchers can abstract from the presentation of results to making the right decisions concerning query reformulations. Maybe, other visualizations can support the users in making this task easier. This forms the starting point for the authors’ research which is described in detail in the next section.
5. DESIGN OF QUERY COMPARISON SYSTEMS Our approach is based on intensive knowledge engineering with experts and a user centered design process with several design iterations. Interviews with domain experts from several technical fields have shown that for the development of complex queries for typical patent information needs, it is crucial to compare the effects of different queries and find the optimal query for a certain information need [Struß et al. 2014]. The state of the art in patent search in general also stresses the importance of iterative query construction and query comparison. The study by Joho et al. (2010) emphasizes the importance of search functionalities in the patent domain. The users differ very much from the typical web searcher in that they are willing to
In the first case, different queries can be directly compared to enhance the user’s understanding concerning the scope of result sets and their overlaps or differences. The view that was developed for this scenario is called Query Comparison. The second suggestion is to support the patent searcher in the development of query combinations. The view Query Combination should inspire the user to produce effective combinations of queries without having to undertake too many iterations of query formulation. By giving the user an immediate impression on result set sizes, unsuitable combinations of queries might be prevented, thereby making the process more transparent and efficient. Both concepts and prototypes are described in detail below. Figure 7 shows the paper prototype of the Query Comparison view. On the left, the user can choose which queries (s)he would like to compare. These queries have been executed before and are now available in a history. The selected queries are then depicted as symbols in the center of the screen. A query is represented by a circle and a combination of queries (connected through Boolean operators) looks rather cloud-like to visually remind the user of its formation. The bars below contain the specified logic behind the comparisons of the queries. They can either be formulated manually or loaded from earlier comparisons. It is also possible to specify a group of default comparisons that is automatically loaded when the view opens. The result set that fulfills the Boolean logic is calculated upon clicking the „Execute comparison“ button in the lower right and is then represented as a circle beneath the corresponding bar. The number of documents is shown in the circles’ center, which provides the user with helpful information concerning the further development of the search strategy. To see a list of the patents in a new window, the user needs to double-click the circles. That way, the user can immediately check if e.g. an expansion of a query led to more relevant results. These subsequent steps of query evaluation are especially important in patent retrieval since the result set needs to comprise all relevant documents but must at the same time be manageable. The second visualization, Query Combination, is shown in Figure 8. Its goal is to let the user visually explore which query combinations might lead to manageable result sets. Patent searchers often formulate initial subqueries that describe parts of the search (e.g. certain materials or the use of a technology) and combine them later on to final queries that comprise all relevant aspects of the search. Since the first combination of queries usually doesn’t produce the final result set, it would be advantageous to specify a few candidates for query parts and let the system calculate all combinations. The user can choose on the left which query parts should be included, thereby triggering the system to calculate all combinations. These are then depicted as circles where the color and the size redundantly represent the result set sizes. All document sets can be opened and assessed by
Figure 7: Query Comparison view
double-clicking the particular circle. It must be noted that the calculation of all possibilities and their visual representation should be limited to a reasonable number. The immediate and direct visualization of the size allows the experts to easily optimize the size of their final result set. We conducted an informal evaluation of these two prototypes with seven professional patent searchers. The patent searchers were recruited at the PatInfo 2014 in Ilmenau, Germany. Since this conference is highly domain-specific, all participants were familiar with the patent domain. The patent searchers were invited to take part in an interview that lasted about an hour. This was structured as follows: The experts were first asked to present their professional experience in patent retrieval to learn something about their background. Then, they were given an introduction into the study and were afterwards confronted with the prototypes and the ideas behind them. The patent searchers were allowed to ask questions and were encouraged to give their opinion and to suggest possible improvements. Out of the seven professionals, six experts commented favorably on the Query Comparison view. The visualization was evaluated as meaningful and more efficient compared to current search facilities. One expert mentioned that the idea offered more information than currently available in the systems; another one highlighted its use as an analytical tool for a better understanding of the result sets. Negative comments were the unclear use of color, the lack of a drag and drop interaction and the question whether such functionality would be helpful at that point of the research process. The Query Combination view was rated positively by four experts. They saw value in the clear overview, liked the aesthetic design, and argued that one would not have to try out as many queries anymore. Also, one could see when a query would
“crash”, i.e. not deliver the anticipated amount of patents. Two professionals were not sure about the benefit; one described the size of the result set as being a “dangerous criterion” for the appropriateness of the result set. The meaning of the color scheme was again criticized by one expert and the request for more information concerning each set was also expressed once. In summary, the evaluation of thye ideas was very encouraging and indicated that the ideas tackle real problems of patent searchers. The discussion with the professionals and their suggestions will be taken into account in the further development of the visualizations.
6. CONCLUSION AND FUTURE WORK In this paper, we argued that patent retrieval and especially query formulation is a complex process that needs to be supported by tools. Our research aims to provide such tools on the basis of visualizations. We presented two prototypical visualizations that give users another perspective on query formulation and that were evaluated with seven professional patent searchers. Since the feedback was encouraging, the prototypes will be further developed and integrated into a fully functional system. One of the authors is currently working on the implementation, using JavaScript and the JS library D3 for the visualizations. Apart from the sub-process of query formulation, there are other tasks during the patent retrieval process that can benefit from visualizations. For these scenarios, visual prototypes will be developed and further requirements of domain experts taken into account. The final prototype that will consist of a number of visual tools for patent searchers will be thoroughly evaluated in formal user test settings.
Figure 8. Query Combination
7.
ACKNOWLEDGEMENTS
The authors would like to thank FIZ Karlsruhe for supporting this research through a Doctoral Fellowship to the first author.
8. 1.
Konvens 2014. Hildesheim, Germany, October 6-7, 2014. http://ceur-ws.org/Vol-1292/ 7.
Jung, H. & Ha, Y. (2015): InSciTe advisory: Prescriptive analytics service for enhancing research performance. In: Knowledge and Smart Technology (KST), 2015 7th International Conference on Knowledge and Smart Technology. Chonburi, Thailand. 28-31 Jan. 2015. http://dx.doi.org/10.1109/KST.2015.7051448
8.
Herr, D.; Han, Q.; Lohmann, S.; Brügmann, S. & Ertl, T. (2014): Visual Exploration of Patent Collections with IPC Clouds. In: Proceedings of the First International Workshop on Patent Mining and Its Applications (IPaMin 2014) colocated with Konvens 2014. Hildesheim, Germany, October 6-7, 2014. http://ceur-ws.org/Vol-1292/
9.
Joho, H.; Azzopardi, L.A. & Vanderbauwhede, W. (2010): A survey of patent users: an analysis of tasks, behavior, search functionality and system requirements. In: Proceedings of the third symposium on Information interaction in context. ACM, 13-24.
REFERENCES Ahlberg, C. & Shneiderman, B. (1994): Visual information seeking: tight coupling of dynamic query filters with starfield displays. In: Celebrating Interdependence. CHI’94 conference proceedings on Human Factors in Computing Systems. Boston, New York: ACM, 313-317.
2.
Becks, D. (2013): Die Nutzung von Head-Modifier Phrasen für Patent-Retrieval. Fachinformationszentrum Karlsruhe, FIZ.
3.
Bonino, D.; Ciaramella, A. & Corno, F. (2010): Review of the state-of-the-art in patent information and forthcoming evolutions in intelligent patent informatics. In: World Patent Information vol. 32, Issue 1, March 2010, 30-38
4.
Chang, R.; Ziemkiewicz, C.; Green, T. M., & Ribarsky, W. (2009): Defining insight for visual analytics. Computer Graphics and Applications, IEEE, 29(2), 14-17.
5.
Hackl, R. (2009): Transparentes Ranking und RelevanzFeedback im Patentretrieval . Fachinformationszentrum Karlsruhe, FIZ
6.
Han,H.; Xu,S.; Zhu, L.; Qiao, X.; Gui,J. & Zhang, Z. (2014): Mining Technical Topic Networks from Chinese Patents. In: Proceedings of the First International Workshop on Patent Mining and Its Applications (IPaMin 2014) co-located with
10. Jürgens, J.J.; Womser-Hacker, C. & Mandl, T. (2014): Modeling the interactive patent retrieval process: an adaptation of Marchionini's information seeking model. In Proceedings of the 5th Information Interaction in Context Symposium (IIiX '14). New York, NY, USA: ACM, 247-250. http://doi.acm.org/10.1145/2637002.2637034 11. Jürgens, J.J. & Womser-Hacker, C. (2014): Limitations of Automatic Patent IR. In: Datenbank-Spektrum. March 2014, Volume 14, Issue 1, 5-17. 12. Kim, Y.; Tian, Y.; Jeong, Y.; Jihee, R.& Myaeng, S.-H. (2009): Automatic Discovery of Technology Trends from
Patent Text. In: Proceedings of the 2009 ACM Symposium on Applied Computing. SAC. Honolulu, Hawaii, USA, March 812, 2009. New York, NY, USA: ACM, 1480–1487. Available online at http://doi.acm.org/10.1145/1529282.1529611 13. Koch, S.; Bosch, H.; Giereth, M.,& Ertl, T. (2009): Iterative integration of visual insights during patent search and analysis. In: IEEE Symposium on Visual Analytics Science and Technology, VAST 2009, 203-210. 14. Kutz, D. O. (2004): Examining the evolution and distribution of patent classifications. In: Proceedings of the Eighth International Conference on Information Visualisation, IV 2004, IEEE, 983-988. 15. Lupu, M.; Mayer, K.; Tait, J. & Trippe, A. (2011): Current Challenges in Patent Information Retrieval. Springer. 16. McLean, A. W. (2000): Patent Space Visualization for Patent Retrieval. In: Proceedings of the ACM SIGIR 2000
Workshop on Patent Retrieval. Athens, Greece, July 28, 2000. http://research.nii.ac.jp/~ntcadm/sigir2000ws/ 17. Questel: https://www.questel.com/ 18. STN Anavist: http://www.stninternational.de/stn_anavist.html 19. Struß, J.M.; Mandl, T.; Schwantner, M. & Womser-Hacker, C. (2014): Understanding Trends in the Patent Domain. In: Proceedings of the First International Workshop on Patent Mining and Its Applications (IPaMin 2014) co-located with Konvens 2014. Hildesheim, Germany, October 6-7, 2014. http://ceur-ws.org/Vol-1292/ 20. Widén, G.; Steinerová, J. & Voisey, P. (2014): Conceptual modelling of workplace information practices: a literature review. In: Proceedings of ISIC: the information behaviour conference, Leeds, 2-5 September, 2014: Part 1. In: Information Research vol. 19 no. 4, December, 2014. http://www.informationr.net/ir/19-4/isic/isic08.html#.VSOPOESqVA