VISUALIZING THE ICA – A CONTENT-BASED APPROACH André Skupin Department of Geography San Diego State University San Diego, California, 92182 USA
[email protected]
Charles de Jongh CARIS Parkstraat 51 3581PG Utrecht The Netherlands
[email protected]
ABSTRACT In this paper, we present an experiment aimed at visualizing the contents of the ICA conference proceedings. Its main goal is to provide visual means for exploring the topical structure of the cartographic discipline. The source data for our analysis are the proceedings of the 2001 and 2003 ICA meetings, as published on the conference CDs. The first step is to bring them into a semistructured form as XML files, which are then parsed into a relational database. What follows is a series of text transformations, including stemming, stop word removal, and representation of each document as an n-dimensional vector. Those vectors are used to train an artificial neural network. A number of transformations of geometric and attribute data finally lead to map-like visualizations of ICA conference papers. In this paper, we discuss the methodology and its implementation in detail, interpret some of the major observed patterns, and comment on a number of issues requiring further research.
1. INTRODUCTION 1.1 Spatialization and Knowledge Domain Visualization Cartography and geography are increasingly recognized as endeavors that can contribute more then just knowledge regarding the observation, representation, and interpretation of geographic phenomena. Map, space, region, and related notions can instead serve as powerful metaphors to help make sense of ever-growing repositories holding large volumes of n-dimensional, non-georeferenced data. A concept known as spatialization has emerged in recent years, which encompasses the use of spatial metaphors to present high-dimensional data in a low-dimensional, geometric form supportive of the capabilities of the human cognitive system (Skupin and Buttenfield 1997). The geospatial sciences have contributed to this on multiple fronts, addressing important cognitive and computational questions (Couclelis 1998; Fabrikant and Buttenfield 2001; Skupin 2004; Fabrikant and Skupin 2005). Spatialization has been applied to diverse data types, including numerical, graphical, and text data. The latter data type has included sources of varying volume, structure, and topical focus, from as few as one hundred news stories (Skupin and Buttenfield 1996) to as many as several million patent applications (Kohonen 2001). The creation and consumption of written text constitutes a major portion of scientific activities. There is an everincreasing number of print and online outlets for scientific and technical writing. Combine this with a trend towards interdisciplinary work and the result is increased difficulty when trying to make sense of structures and changes in the research landscape. This applies to both the specialist, who wants to spot emerging trends early, and the beginning student, who needs to understand the broad structures of a discipline and the relationships among constituent parts. Knowledge domain visualization attempts to address these issues and a number of interdisciplinary symposia and publications have recently been devoted to this subject (Shiffrin and Börner 2004; Börner, Chen, and Boyack 2002).
XXII International Cartographic Conference (ICC2005)
ISBN: 0-958-46093-0
A Coruña, Spain, 11-16 July 2005 Hosted by: The International Cartographic Association (ICA-ACI) Produced by Global Congresos
Cartographic involvement in knowledge domain visualization has included visualizations of the geographic discipline derived from abstracts submitted to the Annual Meeting of the Association of American Geographers (Skupin 2004).
1.2. Visualizing Cartography The ICA meeting provides a unique opportunity for gauging the state of cartography, in that it constitutes an inclusive forum for discussing cartographic activities. While peer-reviewed journal publications may provide a more focused glimpse at the state-of-the-art and future of our discipline, the ICA conference proceedings are reflective of the true breadth of what cartography and allied disciplines are involved with. The conference also allows gauging the status of cartography internationally. While the conference boasts global participation, the printed proceedings are published in English. This makes it possible to apply many of the standard techniques developed in information science, without having to worry about the larger complexity of multi-language approaches. In terms of trying to model the development of the discipline, the biannual ICA meeting can be seen as providing a sampling of cartography’s evolutionary continuum at a regular temporal interval. It is in this context that a knowledge domain visualization derived from the ICA proceedings is presented in this paper.
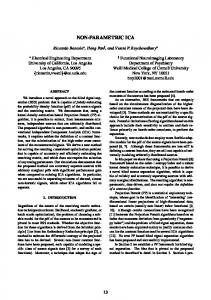
2. TRANSFORMING THE ICA PROCEEDINGS Cartography is about transformation (Tobler 1979). Cartographic transformation typically starts with georeferenced source data, consisting of both geometric and attributes elements. Geometry may be given in the form of coordinates on a curved two-dimensional surface (i.e., latitude and longitude) requiring projection on the flat display surface. Contrast this with knowledge domain visualization where source data tend to be not only very high-dimensional, but are often stored in a format not supportive of meaningful computation. As a result, one needs to go through a series of additional transformations before low-dimensional, geometric structures emerge, to which cartographic design principles and even GIS technology can then be applied. This section discusses these pre-visualization transformations, leading from the ICA proceedings, as published on the conference CDs, to two-dimensional feature geometry and associated attributes (Figure 1).
Figure 1. Flowchart for creating visualizations presented in this paper.
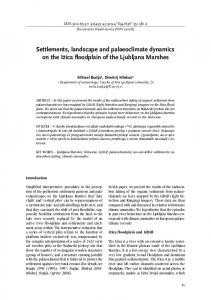
Figure 2. Sample paper from the 2003 conference, as published in PDF format on CD-ROM.
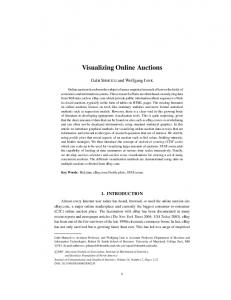
Figure 3. Sample paper from the 2003 conference, after transformation into XML.
2.1. From Unstructured to Semistructured Data The proceedings of the ICA conference have in recent years been published as PDF or Microsoft Word files on CDROM. These digital formats support on-demand printing and allow searching for occurrences of specific terms. Electronic publishing provides a logical workflow from word processing to a uniform appearance on screen and in hardcopy (Figure 2). The digital form of conference proceedings makes them an obvious candidate to base a visualization of the cartographic knowledge domain on. However, there is a lack of explicit structural elements that would make automated processing much easier. For example, there is no explicit semantic encoding of what constitutes the title versus the author’s name versus the text of a paper’s abstract. Like HTML, PDF and Word formats are focused on the visual appearance of text, not on underlying semantic structures. As explained in the following section, the spatialization methodology pursued in this paper exploits structural elements in typical scientific writing. Therefore, the source data have to be transformed into a format that is able to distinguish between these structural elements. Among candidate formats, the Extensible Markup Language (XML) is an obvious choice, given its characteristics and wide acceptance. Not only does it provide explicit structural information, but also a means for transforming other XML schemas into the desired one, using XSL Transformations (XSLT). ICA papers from the meetings in 2001 (Beijing) and 2003 (Durban) constitute the input data. Each paper is stored as a Word file (2001) or PDF file (2003) on the conference CD. From these sources two XML files are created, one for each
of the two conferences. Among the structural elements distinguished are the document identifier, title, author name and address, email address, author-chosen keywords, and the abstract and full text of the paper (Figure 3). Further structuring could of course be performed. For example, one may want to break up address information into finer detail in order to analyze the geographic distribution of authors. For the purpose of text content analysis demonstrated in this paper the chosen level of structural decomposition is sufficient.
2.2. Text Transformations Once the ICA papers are available in XML form, the contained papers are parsed into structured tables in a standard relational database. A number of transformations are then applied that originate in information science and resemble those found in standard search engines. First, stop words are removed, such as prepositions, articles, and other words with little meaning-bearing potential. Then, all text is stemmed by using the popular Porter algorithm (Porter 1980). This includes stripping suffixes, reducing plural/singular versions to a common root, and similar manipulations. The stemmed text documents are then transformed into a term-document matrix as the basis of a vector-space model (Salton 1968). Rows and columns in this matrix are formed according to an alphabetically sorted list of term stems (from here on simply referred to as terms) and the list of documents (Skupin and Buttenfield 1996). Matrix entries indicate whether and how often a term is contained in each document. The vocabulary is constructed automatically based on information contained in the ICA papers. Different elements of the papers could be used to that end, notably the titles, the abstract, the full text, or the keywords provided by authors. The latter approach has proven useful in past studies (Skupin 2002), since keywords tend to be nouns with highly concentrated semantic potential. However, author-chosen keywords are absent from most ICA papers, which means that the derived vocabulary would miss large portions of the cartographic knowledge domain. On the other hand, all ICA papers have a title, and it tends to be a fitting condensation of what is contained in the whole paper, without being overburdened by grammatical constructs and other elements relatively poor in semantic relevance, when compared to noun phrasings. In order to determine actual values/weights in the term-document matrix, one again has a choice of which elements of each document to consider (title, abstract, full text, etc.). In order to construct an overall richer, more nuanced model, the term vocabulary (m=1152) is compared to the title, abstract, full text, and author-chosen keywords of all papers (n=894). The resulting term-document matrix thus consists of 894 rows and 1152 columns, with values indicating term counts by document. In other words, every document becomes represented by an 1152-dimensional vector. In further processing, the total dimensionality of the vector space model and the degree of sparseness within document vectors (i.e., the proportion of non-zero entries) can become significant factors in model performance and quality. To address this, a filter mechanism is employed to reduce dimensionality and sparseness. The former is reduced by eliminating terms that actually only appear in very few articles. These are terms which add to the overall dimensionality
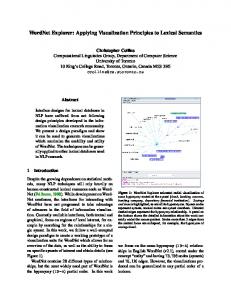
Figure 4. Histogram of the number of papers each term appears in (graph stopped at 100 papers).
Figure 5. Histogram of the number of terms indexed for each paper.
of the vector-space model, without adding much power to organize documents in high-dimensional space. The frequency distribution of terms tends to be highly skewed, with most terms appearing in few documents (Figure 4). Eliminating low-count terms can thus significantly reduce the overall dimensionality. In this case, terms appearing in four or less articles are eliminated. A similar graph was created for the distribution of the number of terms per document. From past experience, this tends to exhibit a normal distribution, with the majority of documents appearing around the mean of the distribution. For the 2003 ICA papers, this was indeed the case. Curiously, the 2001 papers exhibit two peaks, indicating that one is dealing with two distinctly different subgroups in this dataset. This propagates into the histogram constructed from the combined 2001 and 2003 data sets (Figure 5). Further investigation revealed that a significant number of papers published on the CD for the 2001 meeting are not full papers at all, but rather consist of only an abstract. This leads to extremely sparse document vectors, when compared to normal-length papers, which is especially problematic when the Euclidean metric is used during later processing stages. Consequently, the filter threshold is set to approximately the minimum between the two peaks, in the process eliminating papers containing less than 120 indexed terms. The resulting, filtered term-document matrix consists of 708 papers and 1018 terms.
2.3. Neural Network Training The filtered term-document matrix becomes the input data set for neural network training. The specific neural network method used is known as self-organizing map (SOM) or Kohonen map. SOM_PAK, a freely available software package (Kohonen 2001), performs the training. What distinguishes the network created for the purpose of this study from typical SOMs are the high dimensionality of input data (m=1018) and the large number of neurons (nneurons=2500), which is based on a finely grained, two-dimensional array of neurons (xmax=50; ymax=50). Neurons are arranged in a hexagonal pattern; the resulting SOM thus has a rectangular shape. Please refer to Kohonen (2001) for a detailed description of the SOM algorithm or to Skupin (2002; 2004) for its application to text documents from a geographic conference. In the case of ICA papers, training proceeds in two stages. First, global structures are established by using a large neighborhood diameter. With one million training runs, this took 646 minutes on a 2.8GHz Xeon PC (wall-clock time). For the second training stage, a smaller neighborhood was used and training continued for another five million runs, which took 6745 minutes (4.7 days). Finally, the best-matching neuron vector is determined for every document vector. This only took 13 seconds in the given hardware environment.
2.4. Geometric Transformations With the goal of visualizing the ICA papers in a commercial off-the-shelf (COTS) GIS, some further transformations are necessary. The two-dimensional lattice of neurons becomes represented as a layer of 2500 hexagon polygons. This lattice is transformed into a term dominance landscape stored as raster geometry (Skupin 2004). Higher “elevations” in this landscape correspond to regions in which papers exhibit shared usage of certain dominant terms, as possible indicator of a shared topical focus. This landscape is further transformed by tessellating its two-dimensional extent into contiguous regions based on neighboring neurons with identical dominant terms. Those terms are later used for labeling. Another layer is created to hold point geometry for individual ICA papers. This is done by randomly placing papers around the best-matching neuron, to accommodate neurons with multiple assigned papers (Skupin 2002). Other transformations relate to the creation of scale-dependent geometry through clustering. This is described in Skupin (2002) where hierarchical clustering allows introducing the metaphor of a nested hierarchy of administrative subdivisions. In the work presented here, a k-means clustering solution is computed from the n-dimensional document vectors. In connection with a Voronoi tessellation of the display space based on 2D document locations, one can then dissolve Thiessen polygon boundaries if the documents on either side are assigned to the same cluster.
2.5. Label Extraction Before the various geometric layers can be visualized, suitable label terms must be found that can be attached to regions of the spatialization. In the case of the term dominance landscape this is straightforward, with the terms of the derived polygon tessellations serving as regional labels. Labeling of k-means clusters requires identifying the most salient dimensions (i.e., terms) based on a consideration of which portions of the n-dimensional input space are included in or excluded from each cluster. This is a difficult proposition, as discussed later in this paper.
Figure 6. Term dominance landscape and labeling.
3. VISUALIZATION Among visualizations derived from a self-organizing map one can distinguish two main categories: (a) visualizations of the SOM itself; and (b) visualizations of other data mapped onto the SOM. Both are illustrated in this section. This distinction is significant when judging the results. For example, when examining the SOM trained with the 2001 and 2003 ICA papers, we are looking at the cartographic discipline via the model itself. On the other hand, when document vectors are mapped onto the SOM, we are dealing with a model applied to whatever these vectors represent. One could even map whole data sets of other conferences onto it and observe how those data are structured in the light of a model derived from ICA papers.
3.1. Visualizing the ICA Model One of the most common forms of visualizing a SOM is to display sets of component planes as small multiples. Faced with a large number of components (m=1018), this paper instead presents a single unified visualization, where the 2D space structured during neural network training serves as a type of shared coordinate system onto which various layers are then simultaneously displayed (Figure 6). Shown here is the term dominance landscape (blue to brown tones represent low to high values) derived from the degree to which the three highest ranked terms in each neuron’s ndimensional vector dominate that vector. Those terms are placed as labels, with font size expressing their relative, local rank. Label terms are used in the stemmed form.
3.2. Visualizing Individual ICA Papers The point geometry of individual papers can be visualized with simple point symbols and linked to data from the original source tables (Figure 7). Shown here is the complete layout of 708 point symbols plus a zoomed-in view of a small portion, including labeling with paper titles. The four papers shown here are clearly all dealing with similar
topics, i.e., children’s spatial and mapping abilities. Notice how the corresponding region in the model visualization is labeled “children” (Figure 6).
3.3. Visualizing Clusters of ICA Papers While the term dominance landscape is based on a transformation of the neuron vectors, the k-means clusters are computed from the original, high-dimensional document vectors, whose corresponding Thiessen polygons are then merged (see the flowchart in figure 1 and section 2.4). That explains the irregular boundaries inside the k-means cluster visualization (Figure 8). Meanwhile, the outer boundary shows the remnants of the more regular hexagon geometry. Labeling cluster solutions is difficult, because one needs to find terms that are specific enough to meaningfully distinguish the cluster from the rest of the text corpus and general enough to actually be representative of most of the cluster content. To illustrate this difficulty, two label versions are shown. In Figure 8a, a labeling algorithm is used that simply counts the number of occurrences of terms in each cluster. In Figure 8b, that term count is linked with the inverse overall cluster frequency, so that terms with high occurrence throughout the corpus receive a lower weight. There are noticeable differences in how general or specific the computed labels are and how this may relate to cluster size and to the degree of term dominance (Figure 6). For example, for smaller areas with high term dominance, the simple term frequency formula produces fairly meaningful labels, while for larger, topically less focused areas, the labels seem too general (Figure 8a). Using the other labeling formula, label terms are more specific, but may only apply to a portion of the cluster (Figure 8b). Finding the right balance is a topic of ongoing research.
Figure 7. Spatialization of individual papers.
Figure 8. Labeling a k-means cluster solution of individual papers. Two different algorithms are used, one focused on terms appearing often inside the cluster (a), the other emphasizing terms found in the cluster, but rarely outside of it (b).
4. INTERPRETATION AND DISCUSSION 4.1. Structure of Cartography The main purpose of this paper was to demonstrate a complete workflow for creating a spatialization of a knowledge domain and implement it for a concrete data set. Like with traditional and contemporary cartographic depictions, the range of applications for the visualizations shown in figures 6 through 8 is wide and it is outside the scope of this paper to explore this fully. However, given the subject matter of the chosen data set, some observations can be made. Information visualizations are typically explored via highly interactive interfaces, where one can easily switch between perspectives on the data varying in thematic and spatial scope and in the visual variables employed. Among the static examples shown here, the term dominance landscape (Figure 6) comes closest to allowing the kind of exploration that is typically the domain of interactive computer interfaces. The following interpretation is mostly informed by that figure. One major goal of this interpretation is to guide readers in how to make sense of the visualizations, rather than making ultimate statements about the structure of cartography. Among top-level categories, data and map stand out as labels for the elevated areas in the upper left and upper right, respectively. They are almost exclusionary, with map only appearing as a minor category within a portion of the data mountain range (notably next to USGS, which produces U.S. topographic maps and data). At the level of dominant labels shown here, data is completely absent from the map range in the upper right. Other terms show clear associations. The data range encompasses such terms raster, structure, federal, interpolation, or quadtree. Meanwhile, scale, publish, and electronic are found under the map header. There are interesting topological relationships to observe, at global, regional, and local scale. Notice how symbol is the dominant feature separating data from map. Object, feature, and generalization are what stand between data and symbol. Scan and print are neighbors, but the latter is closer to map. GIS is not as prominent as one would expect. Instead it owns a small area on the left edge between the data and information ranges. This is not to say that the term GIS is not used much, but that it is used in the context of other topics where it does not rise to the status of a dominant term. These cursory observations should be sufficient to illuminate the potential value of these kinds of visualizations. Those dedicated to the study of the field of cartography itself could move one to ponder when, how, or why certain parts of the discipline develop in ways that are revealed by the language being used. Remember also that these examples were solely based on the model of cartography (i.e., the SOM itself), and that much value could be gained from mining the actual papers that are mapped onto the same coordinate system (e.g., see Figure 7).
4.2. Discussion The previous section presented some brief observations regarding the structure of cartography as reflected in the terms used by those who write about it. The study of the visualizations created from the ICA papers also reveals a number of issues that call for further investigation, including stop word selection, stemming, spatial layout, and label extraction and placement. A detailed discussion of each of these is beyond the scope of this paper. This section thus focuses on only one of them: stemming. The stemming algorithm used here (Porter 1980) is completely domain-independent. This makes it applicable to diverse data sets, but the visualizations reveal some issues. Map and maps are not recognized as singular and plural forms of the same term. This adds to the model’s dimensionality and possibly introduces structures that may not be significant. On the other hand, it may be that authors do indeed use the two forms in slightly different contexts, distinguishing between how maps are used in general as opposed to being concerned with the methodology for creating a particular map. A more clearly problematic case is the differentiation between word forms in U.S. English versus British English. In this visualization, generalize/generalization is stemmed to gener, but generalise/generalisation becomes generalis. The two stems are treated as completely independent and are indeed separated in the final visualization. The stemming algorithm can of course be modified to account for this. One modification already implemented prevents the stemming of three-letter acronyms ending in the letter “s” (like GPS and GIS), which the original algorithm interprets as plural nouns. The appearance of stemmed terms in the visualization may appear odd, but has the useful effect of enabling placement of labels that in their original form are much longer and would be difficult to fit. Examples are such stems as gener, inform, or commun.
5. CONCLUSIONS During the last ten years spatialization has established itself as an area of serious inquiry among a growing number of cartographers (e.g., Skupin and Buttenfield 1996; Fabrikant and Buttenfield 2001; de Jongh 2003; Koua and Kraak 2005). One of the main aims of this paper was to demonstrate that there are numerous research issues worthy of attention by the cartographic community. The paper focused mostly on the computational aspects of spatialization, as opposed to cognitive and usability questions, by describing a domain-independent methodology for deriving map-like information visualizations from the content of text documents. It showed that such a methodology can be used to study the field of cartography itself, with input data derived from articles published in the ICA conference proceedings. The self-organizing map algorithm leads to a preservation of major topological relationships, but this happens at the cost of distorting relative distances. In addition, the fixed, bounded two-dimensional shape of the SOM may lead to the possible separation of regions that are neighbors in the n-dimensional input space. Automated labeling of clusters and of user-defined regions is another difficult issue that must be investigated in future work. The work presented here treats the 2001 and 2003 ICA papers as a single snapshot of the cartographic discipline. Investigating changes in cartography over time seems like an obvious proposition. This should be pursued in the future, utilizing techniques that are mostly yet to be developed.
6. REFERENCES Börner, K., C. Chen, and K. W. Boyack. 2002. Visualizing knowledge domains. In Annual Review of Information Science and Technology, ed. B. Cronin, 179-255. Couclelis, H. 1998. Worlds of Information: The Geographic Metaphor in the Visualization of Complex Information. Cartography and Geographic Information Systems 25 (4):209-220. de Jongh, C. 2003. Mapping a cartographic conference: The experimental spatialisation of non-spatial information. Paper read at 21st International Cartographic Conference, August 10-16, at Durban, South Africa. Fabrikant, S. I., and B. P. Buttenfield. 2001. Formalizing Semantic Spaces for Information Access. Annals of the Association of American Geographers 91 (2):263-280. Fabrikant, S. I., and A. Skupin. 2005. Cognitively plausible information visualization. In Exploring Geovisualization, eds. J. Dykes, A. M. MacEachren and M.-J. Kraak, 667-690. Amsterdam: Elsevier. Kohonen, T. 2001. Self-Organizing Maps. 3rd ed. Berlin: Springer-Verlag. Koua, E. L., and M.-J. Kraak. 2005. Evaluating self-organizing maps for geovisualization. In Exploring Geovisualization, eds. J. Dykes, A. M. MacEachren and M.-J. Kraak. Amsterdam: Elsevier. Porter, M. F. 1980. An algorithm for suffix stripping. Program 14 (3):130-137. Salton, G. 1968. Automatic information organization and retrieval. New York: McGraw-Hill. Shiffrin, R. M., and K. Börner. 2004. Mapping Knowledge Domains. Proceedings of the National Academy of Sciences 101 (Suppl. 1):5183-5185. Skupin, A. 2002. A Cartographic Approach to Visualizing Conference Abstracts. IEEE Computer Graphics and Applications 22 (1):50-58. ———. 2004. The World of Geography: Visualizing a knowledge domain with cartographic means. Proceedings of the National Academy of Sciences 101 (Suppl. 1):5274-5278. Skupin, A., and B. P. Buttenfield. 1996. Spatial Metaphors for Visualizing Very Large Data Archives. Paper read at GIS/LIS '96 Annual Conference and Exposition, November 19-21, at Denver, CO. ———. 1997. Spatial Metaphors for Visualizing Information Spaces. Paper read at ACSM/ASPRS Annual Convention and Exhibition, April 19-21, at Seattle, WA. Tobler, W. R. 1979. A Transformational View of Cartography. The American Cartographer 6 (2):101-106.
ACKNOWLEDGEMENTS Shujing Shu and Balaji Sivakumar, research assistants in the Department of Geography at the University of New Orleans, implemented the software used to index the ICA abstracts. The research presented here was partially supported by the Louisiana Board of Regents Support Fund, grant # LEQSF(2002-05)-RD-A-34. Travel support from the U.S. National Committee for the ICA is gratefully acknowledged.