Web-based City Maps for Blind and Visually Impaired Wolfgang Wasserburger, Julia Neuschmid, Manfred Schrenk (Dipl.-Ing. Wolfgang Wasserburger,
[email protected], CEIT ALANOVA – Institute of Urbanism, Transport, Environment and Information Society, Concorde Business Park 2/F, 2320 Schwechat, Austria, www.ceit.at) (Mag. Julia Neuschmid,
[email protected], CEIT ALANOVA – Institute of Urbanism, Transport, Environment and Information Society, Concorde Business Park 2/F, 2320 Schwechat, Austria, www.ceit.at) (Dipl.-Ing. Manfred Schrenk,
[email protected], CEIT ALANOVA – Institute of Urbanism, Transport, Environment and Information Society, Concorde Business Park 2/F, 2320 Schwechat, Austria, www.ceit.at)
1 ABSTRACT Today cities can be explored easily with the help of web-based city maps. Web-based maps support virtual and live discovery of cities, provide spatial information and improve orientation. Web-based city maps can be accessed either from home with a PC or on tour thanks to mobile devices, which may also be connected to GPS. However, this is not the case for blind and visually impaired people. To properly access and view digital maps is often challenging for this user group. Therefore, a methodology based on geographic information technologies is developed to automatically generate a textual spatial description of the map (map in words) and a user specified interface respecting the requirements of users with visual impairment. 2 THE GOAL: ACCESSIBILITY OF MAPS Although digital maps become more and more popular, they still belong to those elements of the web which are not accessible to all user groups. So far, visually impaired and especially blind people do not get the chance to fully discover web-based city maps. One way to make web-based maps accessible for people with visual impairments is to describe the map in words. The goal is to develop a semantic description of the urban space that can be generated automatically so that worldwide deployment is possible. The idea is not to navigate the user, but to open up the chance for the user to navigate himself by interactively discovering web-based city maps. The aim is to provide a holistic description of the urban space which means that the user should be able to discover as many attributes of a street section as possible to get a better image of the city. This image – or mental map – should include information about streets, intersections, blocks, points of interest, possible causes of risk, etc. and their spatial relation to each other. The elements of the map need to be described in a semantic way that is adapted to the requirements of pedestrians, especially blind and visually impaired ones. 3 STATE OF THE ART Research activities are rather low and literature is rare in the field of orientation of blind and visually impaired people, and their requirements on the design of digital maps. So far research and development activities exist mainly in the field of navigation for blind people. Navigation systems have been developed primarily for car navigation and most often are only downsized for pedestrians without adding special features. The development of navigation systems for pedestrians is just at its start (Ways4all, Nav4blind, Loadstone). Still a weak point is the semantic description of the route as it is not adapted to the needs of pedestrians and their different requirements. This is why there is a need for deeper research and development concerning this issue. In addition, spatial information for pedestrians has mainly been collected manually which requires a lot of time and financial resources, not only for the data acquisition but also for maintenance. Therefore, semantic spatial description only exists for small areas (Poptis – a project on giving directions in the Vienna underground stations). One project which aimed at improving semantics, holistic spatial description, and the development of automatic methods is AmauroMap. The project was funded by the Internet Foundation Austria within the program Netidee between November 2009 and October 2010. In the frame of e-inclusion and webaccessibility AmauroMap focused on accessibility of digital maps particularly for blind people. AmauroMap also includes an empirical study on the orientation and requirements of blind people in urban space. In addition the project succeeded in developing a first prototype of the “speaking map” which proves that the technical solution is feasible. AmauroMap is a first step towards accessibility of web-based maps which is the basis for further development, extensions and new ideas.
Proceedings REAL CORP 2011 Tagungsband 18-20 May 2011, Essen. http://www.corp.at
ISBN: 978-3-9503110-0-6 (CD-ROM); ISBN: 978-3-9503110-1-3 (Print) Editors: Manfred SCHRENK, Vasily V. POPOVICH, Peter ZEILE
1429
Web-based City Maps for Blind and Visually Impaired
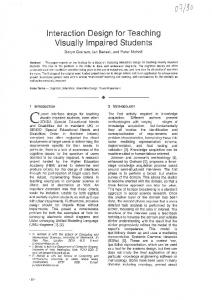
4 TARGET GROUP The target group of the presented approach are people with visual impairment that need to be divided into several sub-groups. These are people with low visual impairment, high visual impairment, blindness, and colour blindness – the latter almost making up to 10 % of the population, men being the majority (Keusekotten 2006). A further sub-target group is elderly because visual impairment increases especially at higher age caused by macula degeneration. 5 THEORETICAL BACKGROUND: COGNITIVE MAP APPROACH The theoretical background is the “mental map” or “cognitive map” approach (Tolman 1948). Each person has an individual mental ‘image’ (or map) of the surrounding which is important for orientation and way finding. In this regard Lynch (1960) defines five elements of the urban space which are needed for the creation of cognitive maps: paths, edges, nodes, districts and landmarks (figure 1). According to Golledge et al. (1996) people develop certain way finding skills by ‘studying’ the surrounding area and memorising those elements. Basically the description of maps in words builds on this theoretical background and the five elements of urban space.
Fig. 5: Elements of the urban space according to LYNCH (1960). From left to right: path, edge, district, node, landmark.
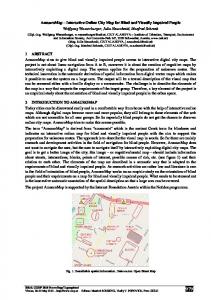
6 TECHNICAL APPROACH The service is based on geographic information systems (GIS) extended with algorithms that can create semantic spatial descriptions automatically. The spatial description derives from vector data so that a largescale mapping is possible. This method makes it possible to describe the shape of crossings, blocks, etc. in words and in a standardised way. Core of the service is a platform (database). Interfaces can provide automatic data updates. The semantic and the automated generated textual description of the urban space is created on the server with GIS methods in the background or directly running within. For the mobile version the position of the user is identified by the application or by the online version, both deriving from GPS or mobile cell locations. The position of the user is sent to the server, where together with the target point of the user, the semantic description is generated. This description is transmitted back to the mobile device where a voice output of the surrounding with all its attributes is performed. In this case a permanent communication link between mobile device and server is required. The basic geographic data is open data based (OpenStreetMap). OpenStreetMap data has been created by its community, is free to download, contains a great variety of attributes and is kept up-to-date in a satisfying way. Besides that, the geodatabase is prepared to add more exact data, for example data provided by the local community governments. As a first sample the City of Vienna will provide data as a test region. The technologies chosen to access the textual output are screenreaders or Braille displays for blind and high visually impaired people. Screenreaders are available commercially or open source. In addition to the textual description a visual map for people with lower visual impairment will be developed using SLD (Styled Layer Description; OGC specification) as well as acoustic mouse-over systems on such maps. In this context WCAG 2.0 Guidelines (Web Content Accessibility Guidelines) are of high importance. These are part of a series of web accessibility guidelines published by the W3C's Web Accessibility Initiative and aim at making content accessible, primarily for disabled users, but also for all user agents, including highly limited devices such as mobile phones.
1430
REAL CORP 2011: CHANGE FOR STABILITY: Lifecycles of Cities and Regions
Wolfgang Wasserburger, Julia Neuschmid, Manfred Schrenk
Fig. 6: System architecture of the web-based city map
7 USE CASES In practice the digital map will apply to several situations: the user can either prepare in advance for new routes by using the web-based system or can have access on the way via a mobile device (mobile phone, netbook, notebook, etc.). The main functionality is interactive discovery of the digital map either at home (preparation) or directly on tour. For example does the user want to receive additional information about one location and its surrounding (“Where is a certain point of interest?”). The map provides information such as address, coordinates, type of street (e. g. city centre, residential street, pedestrian street, main road), etc. Another important question is what is next to this point of interest. The map provides information such as public building, supermarket, house with a certain address, medical facility, acoustic traffic light, park/green areas, crossing, square, other streets, etc. In addition the map highlights potential dangers for the user which can be main roads, big crossing, bicycle lanes, etc. Also of high interest is if there are any assistive facilities in the surrounding. The map provides information such as acoustic traffic lights, elevators, etc. and the spatial relation of the objects to each other. The information mentioned above is always provided for one selected street section. In addition the crossing(s) that is/are at end of this selected street section are described to indicate further possible directions (figure 3). By clicking on a continuing street section, the user moves further in the map and receives new detailed spatial information. In this way a holistic cognitive picture of an area can be build.
Fig. 7: Continuing detailed description of selected street sections and their crossings (selected street sections in blue)
8 PROSPECTS The presented methodology, to make easier the access to web-based maps for visually and blind people, could be integrated into other existing web-based maps and technologies, e. g. audio technologies and navigation systems for pedestrians. In terms of pedestrian navigation the aim should not be to navigate the user in a linear way from A to B (“turn right after 300 meters”) but to describe the way with the help of
Proceedings REAL CORP 2011 Tagungsband 18-20 May 2011, Essen. http://www.corp.at
ISBN: 978-3-9503110-0-6 (CD-ROM); ISBN: 978-3-9503110-1-3 (Print) Editors: Manfred SCHRENK, Vasily V. POPOVICH, Peter ZEILE
1431
Web-based City Maps for Blind and Visually Impaired
landmarks (“turn right after the second street, in front of the park”). The presented GIS-based methodology which can generate spatial information automatically, as well as an improved semantic description, can be an added-value for pedestrians. The results could not only be input for further development in pedestrian navigation but also for optimised design of the web-based map’s user interface, especially when it comes to mobile applications. 9
REFERENCES
Golledge, R.G., R.L. Klatzky, J.M. Loomis: Cognitive Mapping and Wayfinding by Adults without Vision. In: J. Portugali (ed.): The Construction of Cognitive Maps, pp. 215-246. 1996. Keusekotten, Johannes: Innovationen durch IT. Mehr Bürgernähe durch Barrierefreiheit. 2006 Loadstone: http://www.loadstone-gps.com/, accessed on 14.03.2011 Lynch, Kevin: The Image of the City. Cambridge, 1960. Nav4blind: http://www.nav4blind.de/, accessed on 14.03.2011 Poptis: System of the Vienna Transportation System (Wiener Linien): http://www.wl-barrierefrei.at/index.php?id=8034; accessed on 17.04.2010. Tolman, E.Cc: Cognitive Maps in Rats and Men. In: Psychological Review, Vol. 55, pp. 189-208. 1984. Ways4all: http://www.ways4all.at/index.php?lang=de, accessed on 14.03.2011 Web Content Accessiblity Guidelines: http://www.w3.org/TR/WCAG20/, accessed on 14.03.2011
1432
REAL CORP 2011: CHANGE FOR STABILITY: Lifecycles of Cities and Regions


![A REFERENCE GUIDE FOR THE BLIND AND VISUALLY- IMPAIRED [PDF]](https://m.moam.info/img/260x300/a-reference-guide-for-the-blind-and-visually-impai_648774c8098a9e71478b4691.jpg)


![Suggested Teaching Strategies: blind and visually impaired students ... [PDF]](https://m.moam.info/img/260x300/suggested-teaching-strategies-blind-and-visually-i_6479f99e098a9eb5108b456f.jpg)