WG2 session Farid Benboudjema – ENS-Cachan, France Agnieszka Knoppik – Silesian University of Technology, Poland Mateusz Wyrzykowski – Empa, Switzerland
WG2 description | Farid BENBOUDJEMA, Agnieszka KNOPPIK & Mateusz WYRZYKOWSKI
RAPID DESCRIPTION (www.tu1404.eu) BENCHMARK PROGRAM STAGE 1: Simple examples Macroscopic calculations: Farid BENBOUDJEMA – 1340 Microscopic calculations: Mateusz WYRZYKOWSKI – 1400
STAGE 2: RRT+ and durability STAGE 3: Real structures INVITED LECTURE Benchmarking of complex systems: application to cement based materials, Janez PERKO – 1420
DURABILITY ASPECT IN WG2 Benchmark related to durability aspects: Modelling of chloride transport in non-saturated concrete, Jaime C. GALVEZ – 1440 COST ACTION TU1404
SLIDE 2 | 44
WG2 description | Farid BENBOUDJEMA, Agnieszka KNOPPIK & Mateusz WYRZYKOWSKI
Global philosophy Objective 1: Predict properties of concrete only by knowing its concrete mix design (WG1)
Objective 2: Knowing properties of concrete (prediction/experiment), to perform calculations on real structures ( cracking) durability
Allow for numerical experiments in order to optimize composition regarding requested properties: mechanical, cost, ecological etc. Objective 3: Link with design software and recommendations (WG3) COST ACTION TU1404
SLIDE 3 | 44
WG2 description | Farid BENBOUDJEMA, Agnieszka KNOPPIK & Mateusz WYRZYKOWSKI
WORKING GROUP 2 Modelling and Benchmarking GP2.a – Microstructural modelling Guang Ye, The Netherlands & Smilauer Vit, Czech Republic
GP2.b – Multiscale modelling Dunant Cyrille, Switzerland & Pichler Bernhard, Austria
GP2.c – Macroscopic modelling Gawin Dariusz, Poland & Briffaut Matthieu, France
GP2.d – Probabilistic modelling (sensitivity analysis) Hendriks Max , Norway & Caspeele Robby, Belgium
GP2.e – Durability Galvez Jaime C., Spain & Ravi Patel, Belgium
New!
GP2.f – Benchmarking calculations
Buffo-Lacarrière Laurie, France & Knoppik-Wróbel Agnieszka, Poland
COST ACTION TU1404
SLIDE 4 | 44
WG2 description | Farid BENBOUDJEMA, Agnieszka KNOPPIK & Mateusz WYRZYKOWSKI
BENCHMARK PROGRAM STAGE 1: Simple examples STAGE 2: RRT+ STAGE 3: Real structures
COST ACTION TU1404
SLIDE 5 | 44
WG2 description | Farid BENBOUDJEMA, Agnieszka KNOPPIK & Mateusz WYRZYKOWSKI
BENCHMARK Stage 1 The idea: to compare different modelling tools used by the participants, to try to settle a guide for verification and validation of computations at early-age.
The examples: • fully open, i.e. the participants have access to all input data as well as final results; • based mostly on published experimental data.
The simulations are focused both on material properties and structural phenomena.
COST ACTION TU1404
SLIDE 6 | 44
WG2 description | Farid BENBOUDJEMA, Agnieszka KNOPPIK & Mateusz WYRZYKOWSKI
Stage 1 results presentation 1. Publication in a indexed journal – at least one paper co-authored by participants. 2. Educational booklet for future generations of engineers and researchers working on modelling of early-age concrete.
COST ACTION TU1404
SLIDE 7 | 44
WG2 description | Farid BENBOUDJEMA, Agnieszka KNOPPIK & Mateusz WYRZYKOWSKI
Dissemination: • Complete benchmark materials openly published in the Internet (Google Drive) • Personal invitation sent to registered WG2 members (109 emails sent).
• Open invitation posted on Google+ • Project page set up on Research Gate. Participants invited, 21 followers (in & out of Cost Action).
COST ACTION TU1404
SLIDE 8 | 44
WG2 description | Farid BENBOUDJEMA, Agnieszka KNOPPIK & Mateusz WYRZYKOWSKI
BENCHMARK PROGRAM STAGE 1: Simple examples Macroscopic calculations: Farid BENBOUDJEMA – 1340 Microscopic calculations: Mateusz WYRZYKOWSKI – 1400
COST ACTION TU1404
SLIDE 9 | 44
WG2 BENCHMARK STAGE 1: MACROSCOPIC MODELLING | FARID BENBOUDJEMA & AGNIESZKA KNOPPIK
Benchmark stage 1: MACRO-modelling
Example 1: simple theoretical example
Example 2: experimental example focused on thermal analysis Example 3: experimental example focused on stress analysis
COST ACTION TU1404
SLIDE 10 | 44
WG2 BENCHMARK STAGE 1: MACROSCOPIC MODELLING | FARID BENBOUDJEMA & AGNIESZKA KNOPPIK
Participation (teams)
EXAMPLE 1 EXAMPLE 2 EXAMPLE 3
DECLARED
CONTRIBUTED
12 10 9
5 4 2
More to come Invitation to participation is still open! COST ACTION TU1404
SLIDE 11 | 44
WG2 BENCHMARK STAGE 1: MACROSCOPIC MODELLING | FARID BENBOUDJEMA & AGNIESZKA KNOPPIK
Participants Farid Benboudjema ENS/LMT-Cachan, France Giuseppe Sciumè University of Bordeaux, France & Stefano Dal Pont Université Grenoble Alpes UGA, France Arnaud Delaplace LafargeHolcim Research Center, France Dirk Schlicke & Peter Joachim Heinrich Technical University of Graz, Austria
Vít Šmilauer & Karolína Hájková Czech Technical University in Prague, Czech Republic
Miguel Azenha University of Minho, Portugal Vyacheslav Troyan Kyiv National University of Construction and Architecture, Ukraine COST ACTION TU1404
SLIDE 12 | 44
WG2 BENCHMARK STAGE 1: MACROSCOPIC MODELLING | FARID BENBOUDJEMA & AGNIESZKA KNOPPIK
BENCHMARK STAGE 1
BENCHMARK RESULTS
COST ACTION TU1404
SLIDE 13 | 44
WG2 BENCHMARK STAGE 1: MACROSCOPIC MODELLING | AGNIESZKA KNOPPIK-WRÓBEL
Access to results 1.
Data can be access on Google Drive (request access if necessary). Each example has a dedicated spread sheet with input data & format for results (B1_EX1-MACRO_data_and_results_format) and instructions of the example given in a description file (B1_EX1MACRO_description).
2.
Results of each person/team are located in dedicated folders named with the authors’ full name in the folder of an appropriate example, e.g. Example1/Farid_Benboudjema/.
3.
This folder contains detailed information, i.e.:
– a file with the results (spread sheet with data and diagrams) named with the authors’ initials (B1_EX1-MACRO_results_FB) – a file with description of the modelling procedure named with the authors’ initials (B1_EX1-MACRO_procedure_FB) COST ACTION TU1404
SLIDE 14 | 44
WG2 BENCHMARK STAGE 1: MACROSCOPIC MODELLING | FARID BENBOUDJEMA & AGNIESZKA KNOPPIK
Provided by: F. Benboudjema
[email protected]
EXAMPLE no. 1
Modelling of thermo–chemical and mechanical behaviour of basic elements.
Input: • mix composition and conditions of testing, • adiabatic temperature development for two different initial temperatures, • thermo–chemical and mechanical properties • Initial and boundary conditions etc.
Output: • temperature development in time, • stress development in time (elastic and visco-elastic analysis).
COST ACTION TU1404
SLIDE 15 | 44
WG2 BENCHMARK STAGE 1: MACROSCOPIC MODELLING | FARID BENBOUDJEMA & AGNIESZKA KNOPPIK
EXAMPLE no. 1
COST ACTION TU1404
SLIDE 16 | 44
WG2 BENCHMARK STAGE 1: MACROSCOPIC MODELLING | FARID BENBOUDJEMA & AGNIESZKA KNOPPIK
EXAMPLE no. 1 CASE 1
CASE 2
• experimentally-determined adiabatic temperature,
• imposed semi-adiabatic temperature,
• perfectly restrained,
• end-restrained,
• uniform field of temperature,
• uniform field of temperature,
• uniform stress (3D),
• uniform stress (1D),
• Total strain ε = 0.
• uniform strain.
COST ACTION TU1404
SLIDE 17 | 44
WG2 BENCHMARK STAGE 1: MACROSCOPIC MODELLING | FARID BENBOUDJEMA & AGNIESZKA KNOPPIK
EXAMPLE no. 1 CASE 3
COST ACTION TU1404
SLIDE 18 | 44
WG2 BENCHMARK STAGE 1: MACROSCOPIC MODELLING | FARID BENBOUDJEMA & AGNIESZKA KNOPPIK
EXAMPLE no. 1: Adiabatic temperature Evolution of temperature in adiabatic test 1
90
Ti = 22°C
80
60
Exp. results
50
1
Evolution of temperature in adiabatic test 2
40
Ti = 12°C
2
80
30
3 70
20
4
60
10 0 0
20
Temperature (°C)
Temperature (°C)
70
5
50 40
40
60
80
100
Time (hours)
Exp. results
30
1
20
2 3
10
4
0 0
20
40
60
5
80
100
Time (hours)
COST ACTION TU1404
SLIDE 19 | 44
WG2 BENCHMARK STAGE 1: MACROSCOPIC MODELLING | FARID BENBOUDJEMA & AGNIESZKA KNOPPIK
EXAMPLE no. 1 CASE 3
COST ACTION TU1404
SLIDE 20 | 44
WG2 BENCHMARK STAGE 1: MACROSCOPIC MODELLING | FARID BENBOUDJEMA & AGNIESZKA KNOPPIK
EXAMPLE no. 1: Temperature in a wall Dot A (center of the specimen) Thermo-chemical simulations
80 1
70
2
Temperature (°C)
60
3
50
4
40
5
30 20 10 0 0
100
200
300
400
500
600
700
800
Time (hours)
COST ACTION TU1404
SLIDE 21 | 44
WG2 BENCHMARK STAGE 1: MACROSCOPIC MODELLING | FARID BENBOUDJEMA & AGNIESZKA KNOPPIK
EXAMPLE no. 1: Temperature in a wall Dot B (surface of the specimen) Thermo-chemical simulations
60 1
Temperature (°C)
50
2
Old BC
40
3
4 5
30
New BC
20 10 0 0
100
200
300
400
500
600
700
800
Time (hours)
COST ACTION TU1404
SLIDE 22 | 44
WG2 BENCHMARK STAGE 1: MACROSCOPIC MODELLING | FARID BENBOUDJEMA & AGNIESZKA KNOPPIK
EXAMPLE no. 1: Autogenous shrinkage Simulation no. 1 • shrinkage proportional to degree of hydration with final value -107 μm/m
5 1
Simulation no. 5
• fib Model Code 2010 with final value -220 μm/m
COST ACTION TU1404
SLIDE 23 | 44
WG2 BENCHMARK STAGE 1: MACROSCOPIC MODELLING | FARID BENBOUDJEMA & AGNIESZKA KNOPPIK
EXAMPLE no. 1: Modulus of elasticity and creep Simulation no. 1 • Modulus of elasticity: after de Schutter • Creep: Burger model with dependance on hydration degree
5 1
Simulation no. 5 • Modulus of elasticity: B3 model • Creep: B3 model with ageing expressed by equivalent age COST ACTION TU1404
SLIDE 24 | 44
WG2 BENCHMARK STAGE 1: MACROSCOPIC MODELLING | FARID BENBOUDJEMA & AGNIESZKA KNOPPIK
EXAMPLE no. 1: Autogenous shrinkage and Modulus of elasticity
Evolution of autogeneous shrinkage at 20°C
40 35 30 25 20 15 10 5 0
0
Experiments 2 3 0
50
4
100 Time (hours)
150
200
Autogeneous shrinkage (µm/m)
Young modulus (GPa)
Evolution of Young modulus at 20°C
50
100
150
200
0 -20
-40
Experiments
-60
2
-80
3
-100
4
-120
Time (hours)
Either Young modulus or autogeneous shrinkage is relatively well reproduced?
COST ACTION TU1404
SLIDE 25 | 44
WG2 BENCHMARK STAGE 1: MACROSCOPIC MODELLING | FARID BENBOUDJEMA & AGNIESZKA KNOPPIK
EXAMPLE no. 1 CASE 1 • experimentally-determined adiabatic temperature, • perfectly restrained, • uniform field of temperature, • uniform stress (3D), • Total strain ε = 0.
COST ACTION TU1404
SLIDE 26 | 44
WG2 BENCHMARK STAGE 1: MACROSCOPIC MODELLING | FARID BENBOUDJEMA & AGNIESZKA KNOPPIK
EXAMPLE no. 1 Boundary conditions 1 without creep
0
200
400
600
Same results were expected without the take into account of creep
800
2
-10
3
-15
4
Semi-Analytical calculations can be done
-20
-25 -30
-35
0 Time (hours)
More simulations are to come
E t sh
-2 0
Stresses (MPa)
Stresses (MPa)
-5
0
Boundary conditions 1 with creep 200
400
600
-4
2
-6
3
-8
4
-10 -12 -14 -16
-18
COST ACTION TU1404
Time (hours)
SLIDE 27 | 44
800
WG2 BENCHMARK STAGE 1: MACROSCOPIC MODELLING | FARID BENBOUDJEMA & AGNIESZKA KNOPPIK
EXAMPLE no. 1 CASE 3
COST ACTION TU1404
SLIDE 28 | 44
WG2 BENCHMARK STAGE 1: MACROSCOPIC MODELLING | FARID BENBOUDJEMA & AGNIESZKA KNOPPIK
EXAMPLE no. 1 Example of stress analysis: boundary conditions 2 Huge differences!
7,00 6,00 5,00 4,00 3,00 2,00 1,00 0,00 -1,00 0,00 -2,00 -3,00 -4,00
𝜎 ≈ 𝐸 𝑡 𝜀𝑠ℎ
2 4
100,00
200,00
300,00
Boundary conditions 3 with creep (dot B)
400,00
3,00
2,00
Time (hours)
Cracking is expected according to team 4
Stresses (MPa)
Stresses (MPa)
Boundary conditions 3 without creep (dot B)
1,00
2
0,00 -1,00
0,00
100,00
200,00
4 300,00
400,00
-2,00 -3,00 -4,00
COST ACTION TU1404
Time (hours)
SLIDE 29 | 44
WG2 BENCHMARK STAGE 1: MACROSCOPIC MODELLING | FARID BENBOUDJEMA & AGNIESZKA KNOPPIK
EXAMPLE no. 1 Example of stress analysis: boundary conditions 2 Huge differences!
7,00 6,00 5,00 4,00 3,00 2,00 1,00 0,00 -1,00 0,00 -2,00 -3,00 -4,00
𝜎 ≈ 𝐸 𝑡 𝜀𝑠ℎ
2 4
100,00
200,00
300,00
Evolution of Young modulus at 20°C
400,00
Time (hours)
Young modulus evolution seems to be important to characterize precisely! More results to come
Young modulus (GPa)
Stresses (MPa)
Boundary conditions 3 without creep (dot B)
40 35 30 25 20 15 10 5 0
Experiments 2 3 0
50
100
4
150
200
Time (hours)
COST ACTION TU1404
SLIDE 30 | 44
WG2 BENCHMARK STAGE 1: MACROSCOPIC MODELLING | FARID BENBOUDJEMA & AGNIESZKA KNOPPIK
DISCUSSION OF EXAMPLE 1 • Temperature predictions are very close • Some softwares do not allow 2D stress plane conditions, or to impose evolution of internal temperature • Some models are based on code models, which are not in accordance with some of experimental results, finite element results are no more comparable in the sense of an educational booklet but it is interesting when blind numerical simulations have to be done (if experimental results are not available) • More calculations are expected soon, no significant differences in elastic calculations should be expected if evolutions of material properties are precisely fitted?
COST ACTION TU1404
SLIDE 31 | 44
WG2 BENCHMARK STAGE 1: MACROSCOPIC MODELLING | FARID BENBOUDJEMA & AGNIESZKA KNOPPIK
Provided by: M. Azenha
[email protected]
EXAMPLE no. 2
Modelling of 3D temperature field in a concrete cube. Input: • concrete composition, • geometry of the cube,
• environmental conditions (50% RH, 20°C), • isothermal calorimetry curves at different temperatures (20, 30, 40, 50, 60°C), • temperature development in different locations (with sensors) and thermographic images of cube surfaces.
Output: • temperature distribution in space and development in time.
COST ACTION TU1404
SLIDE 32 | 44
WG2 BENCHMARK STAGE 1: MACROSCOPIC MODELLING | FARID BENBOUDJEMA & AGNIESZKA KNOPPIK
EXAMPLE no. 2: Temperature Comparison of temperature evolution measured by sensors in different locations in the sample. Sensor TP3 Surface sensor The effect of formwork removal should be visible
1 2 3
COST ACTION TU1404
SLIDE 33 | 44
WG2 BENCHMARK STAGE 1: MACROSCOPIC MODELLING | FARID BENBOUDJEMA & AGNIESZKA KNOPPIK
EXAMPLE no. 2: Temperature Comparison of temperature evolution measured by sensors in different locations in the sample. Sensor TP9 Surface sensor The effect of formwork removal should be visible
1 2 3
COST ACTION TU1404
SLIDE 34 | 44
WG2 BENCHMARK STAGE 1: MACROSCOPIC MODELLING | FARID BENBOUDJEMA & AGNIESZKA KNOPPIK
EXAMPLE no. 2: Temperature Comparison of temperature evolution measured by sensors in different locations in the sample. Sensor TP18 Core sensor Allows to determine maximum temp.
1 2 3 4
COST ACTION TU1404
SLIDE 35 | 44
WG2 BENCHMARK STAGE 1: MACROSCOPIC MODELLING | FARID BENBOUDJEMA & AGNIESZKA KNOPPIK
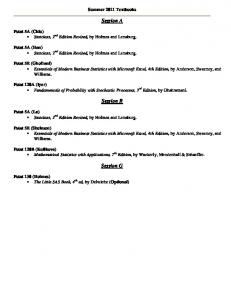
EXAMPLE no. 2: Temperature Comparison of identification of material parameters Team 2 Heat generation rate (W/kg)
Team 4 400
model
350
50ºC
300 250 200
30ºC
150 100
50
CEM I 52.5R
0 0
𝑡eff 𝑄 𝑡 = 𝑄max ⋅ exp 𝑏 ⋅ ln 1 + 𝜏k 𝑡eff =
exp
10
𝑎
𝐴 1 1 ⋅ − 8.3143 293 273 + 𝑇 𝑡
d𝑡
20 Time (h)
30
Thermo-activation should be taken into account!
COST ACTION TU1404
SLIDE 36 | 44
40
WG2 BENCHMARK STAGE 1: MACROSCOPIC MODELLING | FARID BENBOUDJEMA & AGNIESZKA KNOPPIK
DISCUSSION OF EXAMPLE 2 • Temperature predictions are very close as in example 1, if boundary conditions are taken into account and if isothermal calorimetry experiments are well reproduced.
COST ACTION TU1404
SLIDE 37 | 44
WG2 BENCHMARK STAGE 1: MACROSCOPIC MODELLING | FARID BENBOUDJEMA & AGNIESZKA KNOPPIK
Provided by: D. Schlicke
[email protected]
EXAMPLE no. 3
Modelling of temperature and stress development in time of an element in a passive restraining frame. Input: • concrete mix composition, • thermo–chemical and mechanical properties, • geometry of a sample and testing setup, • adiabatic temperature rise, • temperature development in the core/in the corner, • average stress.
Output: • temperature development in time, • stress development in time (elastic behaviour and with identification of creep). COST ACTION TU1404
SLIDE 38 | 44
WG2 BENCHMARK STAGE 1: MACROSCOPIC MODELLING | FARID BENBOUDJEMA & AGNIESZKA KNOPPIK
EXAMPLE no. 3 Restraining frame experiment (at TU Graz) Set-up:
Idealisation:
Specimen is insulated
COST ACTION TU1404
SLIDE 39 | 44
WG2 BENCHMARK STAGE 1: MACROSCOPIC MODELLING | FARID BENBOUDJEMA & AGNIESZKA KNOPPIK
EXAMPLE no. 3
Team 1 Constant value of heat exchange coefficient was taken into account.
h = 0.5 W/m²K
COST ACTION TU1404
SLIDE 40 | 44
WG2 BENCHMARK STAGE 1: MACROSCOPIC MODELLING | FARID BENBOUDJEMA & AGNIESZKA KNOPPIK
EXAMPLE no. 3
Team 1 Insulant need to be simulated in order to retrieve temperature in the corner and the core
COST ACTION TU1404
SLIDE 41 | 44
WG2 BENCHMARK STAGE 1: MACROSCOPIC MODELLING | FARID BENBOUDJEMA & AGNIESZKA KNOPPIK
DISCUSSION OF EXAMPLE 3 Properties of insulant will be added if needed.
COST ACTION TU1404
SLIDE 42 | 44
WG2 BENCHMARK STAGE 1: MACROSCOPIC MODELLING | FARID BENBOUDJEMA & AGNIESZKA KNOPPIK
Thanks to all the participants Farid Benboudjema ENS/LMT-Cachan, France
Giuseppe Sciumè University of Bordeaux, France & Stefano Dal Pont Université Grenoble Alpes UGA, France
Arnaud Delaplace LafargeHolcim Research Center, France Dirk Schlicke & Peter Joachim Heinrich Technical University of Graz, Austria
Vít Šmilauer & Karolína Hájková Czech Technical University in Prague, Czech Republic
Miguel Azenha University of Minho, Portugal Vyacheslav Troyan Kyiv National University of Construction and Architecture, Ukraine
MORE TO COME SOON!!!! COST ACTION TU1404
SLIDE 43 | 44
THANK YOU FOR YOUR ATTENTION WWW.TU1404.EU