YouTube in the Move: Understanding the. Performance of YouTube in Cellular Networks. Pedro Casas, Pierdomenico Fiadino, Andreas Sackl, Alessandro D' ...
2014 IFIP Wireless Days (WD)
YouTube in the Move: Understanding the Performance of YouTube in Cellular Networks Pedro Casas, Pierdomenico Fiadino, Andreas Sackl, Alessandro D’Alconzo FTW - Telecommunications Research Center Vienna {surname}@ftw.at Abstract—YouTube is the most popular and volume-dominant service in today’s Internet, and is changing the way ISPs manage their networks. Understanding the performance of YouTube traffic is paramount for ISPs, specially for mobile operators, who must handle the huge surge of traffic with the constraints and challenges of cellular networks. In this paper we present an empirical analysis of the performance of YouTube flows accessed through a national-wide cellular network, considering download throughput as well as end-user Quality of Experience (QoE) metrics. The analysis considers the characteristics and impacts of the Content Delivery Network hosting YouTube, and compares its behavior with other popular HTTP video streaming services accessed through cellular networks. The QoE analysis is performed through end-user device measurements, which directly reflect the experience of the end-users. Our study additionally shows the potentiality of monitoring YouTube performance in cellular networks directly from the smart-phones of the users, bypassing the traffic visibility loss at the core of the network introduced by traffic encryption (e.g., HTTPS). Keywords—YouTube; Content Delivery Networks; Cellular Networks; Traffic Measurements; End-device Measurements; QoE.
I.
I NTRODUCTION
YouTube is the most popular video streaming service in today’s Internet. Its enormous popularity poses complex challenges to network operators, who need to design and operate their systems properly to cope with the high volume of traffic and the large number of users. The challenges are bigger for mobile operators, who have to deal with an everincreasing traffic volume with the capacity constraints of cellular networks. Indeed, mobile makes up to almost 40% of todays YouTube’s global watch time, and the trend is growing1. There is an additional source of pressure on top of the shoulders of the operators, which recently made its appearance in the YouTube performance domain: Google has recently launched the Video Quality Report (VQR) initiative2 , which aims at certifying that a given ISP is capable of delivering YouTube videos in consistent and reliable performance levels. ISPs are currently ranked in three performance levels, including YouTube HD (720p videos capable), YouTube SD (360p videos capable), and YouTube LD (Lower Definition), being the latter a label reflecting unreliable YouTube performance. The provisioning of YouTube through the massive Google Content Delivery Network (CDN) makes the overall picture even more complicated, as the video requests are served from different caches at different times, impacting on the 1 http://youtube.com/yt/press/statistics.html 2 http://google.com/get/videoqualityreport/
978-1-4799-6606-6/14/$31.00 ©2014 IEEE
performance of the service and resulting in large traffic fluctuations at the network paths of the ISP. These observations have motivated a large research effort in understanding how YouTube works and performs, covering aspects such as content delivery and caching mechanisms, video popularity, CDN server selection policies and Quality of Experience (QoE)based monitoring among others. In this paper we take a step further in understanding the performance of YouTube, focusing on the specific case of cellular networks. The analysis is performed on top of the live traffic of a EU national-wide mobile operator, observed at the core network, and complemented by performance measurements performed at end.devices. Our main contribution is on the analysis of the YouTube service performance in cellular networks from an end-user perspective, focusing on video flows download throughput and simplified QoE metrics. By comparing YouTube to other HTTP video streaming services provisioned through large CDNs and accessed in cellular networks, we show that the wide-spread usage of caching in mobile networks and/or the deployment of CDN servers at the edge of the ISPs provides high benefits in terms of delay to the contents as well as download throughput. As a side benefit, we show that end-users QoE improves, and user engagement increases. The remainder of the paper is organized as follows: section II presents a brief overview of the related work in YouTube analysis. Section III presents the characterization of YouTube in cellular networks, specially considering the hosting/provisioning infrastructure, the traffic properties, and the achieved performance in terms of download throughput. This characterization additionally compares YouTube to another similar HTTP video streaming service consumed in cellular networks, to additionally understand the impacts of the CDN in the performance of the video delivery. In section IV we study the performance of YouTube from a QoE perspective, considering measurements performed directly at the end-user devices. Finally, section V concludes the paper. II.
R ELATED W ORK
YouTube is the most popular and bandwidth intensive service today. It accounts for more than 30% of the traffic in the Internet [4], with more than 1 billion unique user visits each month. To provide users with low-latency to the content and high QoE [2], Google operates a highly distributed CDN of tens of data-centers and server clusters hosting YouTube videos in 61 different countries. Such a popularity has attracted the interest of the research community to shed light on the functioning of this overwhelming service [1]–[5], covering
2014 IFIP Wireless Days (WD) INTERNET CDN Network Core Network (CN)
Front End (FE)
GGSN Passive
CDN Network (1) client requests video to FE
(3) client resolves content server name
upstream AS path
Front End (FE) Probe
Ingress Router
SGSN Front End (FE)
Radio Access Network (RAN)
RNC YouTube Flows
client client
downstream AS path
(a) Video retrieval workflow.
Egress Router
(b) Google’s CDN.
(c) Monitoring framework in cellular networks.
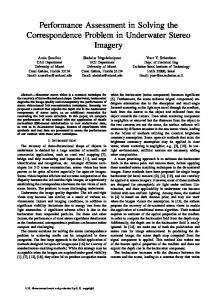
Figure 1. YouTube workflow for video retrieval and content location. Google’s CDN uses a complex content location and server selection strategy for optimizing client-server latency, increase QoE in general, and perform load balancing. DNS is used for request re-directioning. Figure (c) sketches the monitoring framework used in the analysis of core-cellular measurements.
Autonomous System
# IPs
#/24
#/16
YouTube IPs (all ASes) 15169 (Google) 43515 (YouTube) LISP
2030 1121 844 35
63 38 15 4
10 2 2 3
AVS IPs – 22822 (Limelight)
1189
65
7
Table I.
N UMBER OF IP S AND PREFIXES HOSTING Y OU T UBE (G OOGLE CDN) AND AVS (L IMELIGHT ).
multiple different aspects of YouTube. Some of these works include traffic and usage characteristics [1], [4], content delivery and CDN server selection policies [2], [3], and QoE-based monitoring [5]. The growing usage of YouTube in mobile devices has recently motivated a surge of papers focusing on the analysis of YouTube in cellular networks [6]–[9]. These papers focus mainly on the characteristics of the YouTube traffic as compared to other types of traffic in cellular networks, including the analysis of YouTube content cacheability in mobile contexts. Our study focuses on the analysis of the YouTube performance in cellular networks from an end-user perspective, considering video flows download throughput and simplified QoE metrics. III.
YOU T UBE C HARACTERIZATION
YouTube replicates content across geo-distributed datacenters worldwide to improve the overall performance of the video content provisioning. Google’s CDN uses a complex content location and server selection strategy for optimizing client-server latency, increase QoE in general, and perform load balancing. User requests are normally redirected to the closest servers, based on Round Trip Time (RTT) measurements. For doing so, YouTube keeps a periodically updated latency map between its servers and BGP prefixes aggregating geo co-located users [13]. As depicted in figure 1(a), Google uses the DNS service for redirecting requests to the preferred servers, additionally using dynamic cache selection strategies to balance the load among YouTube servers. YouTube Front End (FE) servers are those handling the original user request
% bytes
% flows
LISP 15169 (Google)
69.3 30
66.7 32.7
22822 (Limelight)
100
100
Autonomous System
Table II.
F RACTION OF BYTES AND FLOWS PER AS HOSTING Y OU T UBE AND AVS.
for a specific video, which can then redirect the user to additional YouTube servers mirroring the content. In some cases, YouTube servers located at multiple Autonomous Systems (ASes) of distance are selected (see figure 1(b)), resulting in higher delays and potentially impacting the performance of the video delivery in terms of download throughput. Next we study this complex YouTube delivery infrastructure and the generated traffic properties, comparing the service to a similar HTTP video streaming one, highly popular in cellular networks. This service corresponds to an Adult Video Service (AVS), spanning a content category which has become highly popular in nowadays Internet [15]. Indeed, the total AVS volume in the observed traffic makes almost a third of the total YouTube volume, stressing its importance. A. YouTube and AVS Dataset The dataset we analyze corresponds to almost 90 hours (from Monday till Thursday) of YouTube and AVS flows collected at the mobile network of a major European ISP during the second quarter of 2013. As depicted in figure 1(c), flows are captured at the well known Gn interface, and filtered using the HTTPTag traffic classification tool [11] to keep only YouTube and AVS flows. To preserve user privacy, any user related data (e.g., IMSI, MSISDN) are removed on the fly, whereas any payload content beyond HTTP headers is discarded. The filtered traffic flows are imported and analyzed on-line through the data stream warehouse DBStream [12]. The dataset is complemented with the name of the ASes hosting the content, provided by the IP – AS mappings available from MaxMind geo-localization databases3 and the Team Cymru community services4 for IP to AS mappings. 3 https://maxmind.com 4 http://team-cymru.org/
2014 IFIP Wireless Days (WD) 100
100
90
90
90
80
80
80
70
70
70
60 50
% served flows per IP
all IPs AS 15169 AS 43515 AS 36040 LISP
70
40
60 50 40
60 50
10
0
0
0 0 10
22 4. 0. 0. 0
22 4. 0. 0. 0
19 2. 0. 0. 0
16 0. 0. 0. 0
12 8. 0. 0. 0
96 .0 .0 .0
64 .0 .0 .0
(a) Flows per IP - YouTube.
19 2. 0. 0. 0
10
16 0. 0. 0. 0
10
12 8. 0. 0. 0
20
96 .0 .0 .0
20
64 .0 .0 .0
20
32 .0 .0 .0
30
(b) Flows per IP - AVS.
Figure 2. IP ranges hosting YouTube and AVS, weighted by served flows. More than 60% of the YouTube/AVS flows are served by a well defined /16 block in each case, corresponding to the LISP in YouTube, and to Limelight in AVS.
5 Limelight
Networks: Content Delivery Network http://limelight.com/
6 https://peering.google.com/about/ggc.html
20
2
3
4
0 0 10
5
1
2
10 10 num served flows per server IP (log scale)
3
10
(b) Num. flows per IP - AVS.
Figure 3. Number of video flows per IP. Separated steps on the distributions evidence the presence of preferred IPs or caches serving a big number of flows, which are most probably selected by their low latency to the end customers. 100
100 all flows AS 15169 LISP
90 80
70
70
60
60
% flows
% flows
B. YouTube Provisioning Infrastructure
Figure 4 reports the dynamics of the traffic provisioning from the aforementioned ASes in terms of active IPs and flow counts. The active IPs serving YouTube from AS 15169 show an abrupt increase at specific times of the day, almost tripling at peak hours, between 17:00 and 23:00. Note that the number of active IPs from the LISP is constant during the whole period. The number of active IPs serving AVS videos shows a much more constant behavior during the day. A very interesting observation is that both services are actively hosted by no less than 200 server IPs during the day, and that in both
40
10 1
80
To appreciate which of the aforementioned IP blocks host the majority of the video flows, figure 2 depicts the distribution of the server IP ranges, weighted by the number of delivered flows. According to figs. 2(a) and 2(b), the majority of the YouTube/AVS flows are served by three/four well separated /16 blocks. Very interesting is the fact that more than 65% of the YouTube flows are served by the LISP. To complement this picture, table II reports the fraction of bytes and flows served per AS hosting YouTube and AVS. Figure 3 additionally depicts the number of flows served per each single IP, for both services. Separated steps on the distributions evidence the presence of preferred IPs or caches serving a big number of flows, which are most probably selected by their low latency to the end customers as previously explained, at least for YouTube.
50
30
10 10 10 10 10 num served flows per server IP (log scale)
90
Table I reports the number of unique server IPs hosting YouTube and AVS videos, the IPs per network prefix, and the ASes holding the major shares of servers. While YouTube IPs are distributed among several Google ASes, the AVS service is hosted by a single AS owned by Limelight5 , a major player in the CDN domain, highly specialized in video delivery. Multiple IPs of the Local ISP (LISP) host YouTube contents, suggesting the usage of content caching. However, we can not say whether these IPs correspond to content caching performed by the LISP and/or to Google servers deployed inside the ISP, which is a common approach followed by Google to improve end-user experience, known as Google Global Cache (GGC)6 . In any case, we shall see that such a topology provides high benefits in terms of download throughput of the video flows.
60
(a) Num. flows per IP - YouTube.
IP address range
IP address range
all IPs AS 15169 AS 43515 LISP
40
30
30
32 .0 .0 .0
% served flows per IP
80
% server IPs
100
90
% server IPs
100
50 40
50 40
30
30
20
20 10
10 0 0
10
20
30 40 50 min RTT (ms)
60
70
(a) min RTT to YouTube servers.
80
0 0
50
100 150 200 min RTT (ms)
250
300
(b) min RTT to AVS servers.
Figure 5. min RTT to servers in different ASes. Steps in the CDF suggest the presence of different data-centers or clusters of co-located servers. YouTube LISP servers are located inside the ISP. About 40% of the AVS flows come from Limelight European servers, whereas the biggest numbers come from very far servers, at more than 190 ms.
cases, about 750 unique server IPs are observed at peak hours. Having such a large usage of active IPs serving AVS flows, which equals the values attained for YouTube itself, shows the major popularity of the AVS service. In terms of flow counts, the AVS shows a less marked peak-hour effect, as the number of downloaded flows remains rather uniform daily, between 12:00 and 00:00. We investigate now the latency and the location of the previously identified servers, considering their distance to the vantage point in terms of minimum RTT. The minimum RTT from the monitoring point to a specific IP is an approximated measure of the propagation delay, which is directly related to the location of the underlying server. It follows immediately that IPs showing similar min RTT values are potentially co-located, whereas IPs with very different min RTTs are potentially located in different places. RTTs are estimated through active ping-based measurements. Figure 5 shows the distribution of the min RTT values for the flows observed in both services. Steps in the CDF suggest the presence of different data-centers or clusters of co-located servers. The largest share of the YouTube flows come from the LISP servers, which are located inside the ISP (min RTT < 2 ms). The rest of the flows served from AS 15169 are located at potentially two geographically different locations, one closer at around 40 ms from the vantage point, and one farther at about 70 ms. About 40% of the AVS flows come from Limelight European servers (min RTT < 30 ms), whereas the biggest numbers come from very far servers, at more than 190 ms. This redirectioning to servers most probably located outside
2014 IFIP Wireless Days (WD)
400 300
100
700
90
600 Srv IPs per hour
500
500 400 300
200
200
100
100
0 0
6 12 18 0 6 12 18 0 6 12 18 0 Time of day (hours)
0 0
(a) IPs per hour hosting YouTube.
100 all ASes LISP AS 15169 AS 43515
80
90
70 60 50 40 30 20 10
6 12 18 0 6 12 18 0 6 12 18 0 Time of day (hours)
(b) IPs per hour hosting AVS.
0 0
80 70 60 50 40 30 20 10
6 12 18 0 6 12 18 0 6 12 18 0 Time of day (hours)
(c) YouTube flow counts per hour.
0 0
6 12 18 0 6 12 18 0 6 12 18 0 Time of day (hours)
(d) AVS flow counts per hour.
Figure 4. Active IPs and number of flows per hour and per AS. The active IPs serving YouTube from AS 15169 show an abrupt increase at specific times of the day, almost tripling at peak hours, between 17:00 and 23:00. The number of active IPs serving AVS videos shows a much more constant behavior during the day. The glitch in the counters are caused by maintenance of the monitoring probe. 100
100
90
90
90
80
80
80
70
70
70
60
60
60
50 40 all YT flows AS 15169 AS 43515 LISP AS 22822
30 20 10 0 0 10
1
10 Flow size (MB) − log scale
(a) Flows size.
% flows
100
% flows
% flows
Srv IPs per hour
600
800
Flows per hour (normalized)
all ASes AS 15169 AS 43515 LISP
700
Flows per hour (normalized)
800
50 40 all YT flows AS 15169 AS 43515 LISP AS 22822
30 20 10 2
10
0 0
0.5
1 1.5 2 Flow duration (min)
(b) Flows duration.
2.5
50 40 all YT flows AS 15169 AS 43515 LISP AS 22822
30 20 10 3
0 0
1 2 3 4 5 Average download throughput per flow (Mbps)
6
(c) Flow download throughput.
Figure 6. Flows characteristics and performance. YouTube videos present a much better performance than in the case of AVS. Flows served by the LISP are the ones achieving the highest download throughput, evidencing the benefits of local content caching and low-latency servers.
Europe (RTT > 60 ms) is probably due to the location of the largest share of AVS consumers, which is the U.S., but also due to content hosting legal issues. As we see next, this has a major impact in the performance of the AVS video delivery. C. YouTube Traffic and Performance We study now the characteristics of the YouTube and AVS flows, as well as the performance achieved in terms of download throughput. Figure 6(a) depicts the distribution of flow size for the different hosting ASes. AVS flows are generally longer than YouTube flows, as also evidenced by their duration in figure 6(b). This is coherent with the specific characteristics of the contents: while YouTube is mainly about short videos or “clips”, the AVS service hosts a large share of films. An exception comes from the YouTube flows served from AS 43515, which actually hosts flows with very similar characteristics. YouTube flows served by the LISP have a very marked size between 2 MB and 4 MB, suggesting that shoter videos are hosted locally. This is also coherent with the fact that highly popular videos generally correspond to short videos [10], and that caching at the edge is mainly based on popularity. In terms of delivery performance, figure 6(c) reports the distribution of the average download throughput per flow, discriminating by hosting AS. The download throughput is generally considered as the main network performance indicator that dictates the experience of a user watching YouTube videos. The download throughputs achieved in both services
are markedly different, with a much better performance in the case of YouTube videos. This evidences the main advantages of the Google CDN infrastructure as compared to the Limelight case, at least for the considered video services. When analyzing the performance results per AS, it is evident that the YouTube flows served by the LISP are the ones achieving the highest performance, with an average flow download throughput of 2.7 Mbps. This out-performance evidences the benefits of local content caching and low-latency servers for provisioning the YouTube flows. IV.
YOU T UBE P ERFORMANCE AND Q O E E ND - DEVICE M EASUREMENTS
FROM
Even if the download throughput has a direct impact on the performance of the video provisioning, we showed in previous studies [5] that the main impairment affecting the QoE of the end-users watching HTTP video-streaming videos are playback stallings, i.e., the events when the player stops the playback. In [5] we present an approach to estimate stallings in YouTube from passive measurements at the core network; however, our techniques can not be applied when YouTube flows are sent over HTTPS, because we can not access to the video payload. The increased application of end-to-end traffic encryption forces the usage of traffic measurements at end-devices. For example, let us consider the specific case of YouTube: if the video flows are encrypted, then the filtering of YouTube flows becomes highly error-prone at the core network, as most
100
100
90
90
90
80
80
80
70
70
70
60
60
60
50 40
% flows
100
% flows
% flows
2014 IFIP Wireless Days (WD)
50 40
50 40
30
30
30
20
20
20
10
10
10
0 0
1 2 3 4 5 Average download throughput per flow (Mbps)
(a) Flow throughput – smartphones.
6
0 0
1 2 3 4 5 Average download throughput per flow (Mbps)
(b) Flow throughput - core.
6
Low SNR flows High SNR flows
0 0
1 2 3 4 5 Average download throughput per flow (Mbps)
6
(c) Flow throughput vs. signal strength.
Figure 7. YouTube flows throughput as measured at smartphones. End-device measurements become critical when HTTPS is adopted, as analysis results from measurements at the core network are highly prone to errors, mainly due to mis-classifications. The flow throughput distribution from end-device measurements shows the same behavior as measurements at the core network. End-device measurements provide additional visibility, for example, to signal strength measurements, which constrain the achieved throughput.
traffic classification techniques targeting YouTube are based on Deep Packet Inspection (e.g., HTTPTag requires access to the HTTP headers to recognize YouTube flows, and general monitoring systems rely on DPI techniques). To avoid such limitations and as a proof of concept, we conducted throughput measurements at smartphone devices connected to the same cellular network, and compared the results to those observed at the core. Throughput measurements are performed in Android devices using a tcp-dump like tool, directly installed on the devices. We manually downloaded a set of 100 most-popular videos (according to YouTube video rankings) during a span of 1 week, considering different video formats and contexts (i.e., static, on the move, indoor, outdoor, etc.). The obtained results are presented in figure 7. Figure 7(a) corresponds to the YouTube download throughputs measured at the end-devices. The average download throughput measured for the aforementioned 100 videos is 1.5Mbps. For the sake of comparison, figure 7(b) shows the throughput distribution measured at the core network for the YouTube dataset analyzed in the paper, which comes directly from figure 6(c). The interesting observation is that both core network and end-device throughput measurement distributions are highly similar, verifying that the information obtained from both vantage points are consistent. Thus, future YouTube monitoring systems targeting HTTPSbased applications could rely on end-device measurements to avoid obfuscation and traffic recognition issues. In addition, and to show the richness that end-device measurements potentially offer, figure 7(c) shows the same throughput measurements presented in figure 7(a), but discriminating by flows downloaded with high and low signal strength at the end device. Signal strength measurements are directly obtained from the Open Signal Android app7 . YouTube flows downloaded from the end device when the signal strength is below −80 dBm (indicated as Low SNR flows) achieve an average download throughput of 1.3Mbps, whereas flows downloaded in better signal performance conditions (SNR higher than −80 dBm, indicated as High SNR flows) achieve an average download throughput 60% higher, of about 2.1Mbps. The last part of the study focuses on understanding how the previous throughout-based performance observations are actu7 http://opensignal.com/
ally perceived by the end users. For doing so, we conducted QoE-based measurements at the end devices of real users watching YouTube videos, connected to the same cellular network of previous study. After each video view, users rated their overall experience in terms of Mean Opinion Scores (MOS) and acceptance of the service quality. MOS ranges are defined by an ordinal ACR-9 scale [16], ranging from “bad” (MOS=1) to “excellent” (MOS=5). Acceptance corresponds to a binary assessesment of the specific video watching experience (i.e., accepts or not), and reflects whether the user is satisifed with the service quality and accepts or not to watch YouTube videos unedr the experienced conditions. Different video features such as Video encoding Bit Rate (VBR) and Video Duration (VD) were tracked at the enddevices, as well as playback events such as stallings and Video Played Time (VPT). In this campaign users employed only the HTTP-based version of YouTube, thus throughput measurements were directly retrieved from the core vantage point. In particular, the Average Download Throughput (ADT) of the YouTube flows was additionally passively monitored at the Gn interface of the cellular network, following the same approach producing figure 6(c) results. As we said before, the main QoE impairments for the end-user watching YouTube are playback stallings. Intuitively, when the ADT is lower than the corresponding VBR, the player buffer becomes gradually empty, ultimately leading to the stalling of the playback. We therefore define β = ADT/VBR as a metric reflecting QoE. Figure 8 reports (a) the measured number of stallings events and (b) the QoE user feedbacks as a function of β for the videos of the measurement campaign. We particularly discriminate three different value-gaps for β: the number of video stallings is too annoying for the user when β < 0.75; average quality (MOS ≈ 3.5) is obtained for 0.75 < β < 1.25, but stallings still occur in some videos; finally, no stallings are observed for β > 1.25, and user experience is rather optimal (MOS > 4). As a direct application of these results, if we consider standard 360p YouTube videos, which have an average VBR = 550 kbps [4], an ADT = 700 kbps would result in high user QoE, which is the value recommended by video providers in case of 360p videos [14]. According to [4], the largest majority of videos played in mobile devices corresponds to 360p videos.
2014 IFIP Wireless Days (WD) 40
5
100
100
90
35
20
3
50
15 10
2
25
5 0 0
MOS ACC 0,5
1
1,5 β
2
2,5
3
(a) # stallings vs. β.
1
β < 0.75
0.75 < β < 1.25
β > 1.25
(b) MOS and acceptance vs. β.
80 70 60 λ (%)
75
Acceptance rate (%)
4
25 MOS
# stallings
30
50 40 30 20 Measurements Fitting Curve
10 0
0 0
0.5
1
1.5 β
2
2.5
3
(c) User engagement (λ) vs. β.
Figure 8. β = ADT/VBR as a metric reflecting user experience and engagement. Users have a much better experience and watch videos for longer time when β > 1.25. This threshold corresponds to an ADT = 700 kbps in 360p videos, which is the value recommended by video providers in case of 360p videos.
Therefore, as a very raw estimation from figure 6(c), we can partially claim that about 60% of the total YouTube video flows are downloaded with optimal QoE, i.e., with an ADT > 700 kbps (assuming only 360p videos). Most interesting is the fact that flows served directly from LISP servers obtain optimal QoE for more than 95% of the downloads. To conclude, figure 8(c) additionally shows that the fraction λ = VPT/VD of the video time actually viewed by the end users actually increases when β increases, specially above the β = 1.25 threshold. Such a result confirms that user engagement increases when the resulting QoE is higher, resulting in a stronger motivation for ISPs to increase the performance of the video delivery, particularly in cellular networks. V.
C ONCLUDING R EMARKS
In this paper we have presented an empirical study of the performance of YouTube in cellular networks, covering all the steps from the hosting servers till the QoE of the endusers. The most interesting finding of the study is to show that the complex and dynamic CDN architecture of YouTube has a major payback in terms of service performance in video over cellular networks as compared to other CDNs providing HTTP video streaming services, and that local content caching/hosting by servers at the edge of the ISP provides high benefits in terms of improved QoE and user engagement. In addition, we have shown that throughput measurements at enddevices offer an excellent means to understand the performance of YouTube from the perspective of the users, opening the door to novel monitoring systems which can perform even in the case of traffic encryption. VI.
ACKNOWLEDGMENTS
This work has received funding from the European Union under the FP7 Grant Agreement n. 318627, “mPlane”. The research leading to these results has been partially performed within the framework of the N-0 and U-0 projects at the Telecommunications Research Center Vienna (FTW), and has been partially funded by the Austrian Government and the City of Vienna through the program COMET.
R EFERENCES [1]
P. Gill, M. Arlitt, Z. Li, A. Mahanti, “YouTube Traffic Characterization: A View From the Edge” in ACM IMC, 2007.
[2]
R. Krishnan, H. Madhyastha, S. Jain, S. Srinivasan, A. Krishnamurthy, T. Anderson, J. Gao, “Moving Beyond End-to-End Path Information to Optimize CDN Performance”, in ACM IMC, 2009.
[3]
R. Torres, A. Finamore, J. Kim, M. Mellia, M. Munafo, S. Rao, “Dissecting Video Server Selection Strategies in the YouTube CDN”, in ICDCS, 2011.
[4]
A. Finamore, M. Mellia, M. Munafo, R. Torres, S. Rao, “YouTube Everywhere: Impact of Device and Infrastructure Synergies on User Experience”, in ACM IMC, 2011.
[5]
P. Casas, M. Seufert, R. Schatz, “YOUQMON: A System for On-line Monitoring of YouTube QoE in Operational 3G Networks”, in IFIP Performance, 2013.
[6]
J. Ramos-Munoz, J. Prados-Garzon, P. Ameigeiras, J. Navarro-Ortiz, J. Lopez-Soler, “Characteristics of Mobile Youtube Traffic”, in IEEE Wireless Communications, vol. 21(1), pp- 18-25, 2014.
[7]
M. Shafiq, L. Ji, A. Liu, J. Wang, “Characterizing and Modelling Internet Traffic Dynamics of Cellular Devices”, in ACM Sigmetrics, 2011.
[8]
F. Abdesslem, A. Lindgren, “Cacheability of YouTube Videos in Cellular Networks”, in ACM All Things Cellular, 2014.
[9]
Y. Zhang, A. Arvidsson, “Understanding the Characteristics of Cellular Data Traffic”, in ACM CellNet, 2012.
[10]
J. Erman, A. Gerber, S. Sen, O. Spatscheck, K. Ramakrishnan, “Over The Top Video: the Gorilla in Cellular Networks”, in ACM IMC, 2011.
[11]
P. Fiadino, A. B¨ar, P. Casas, “HTTPTag: A Flexible On-line HTTP Classification System for Operational 3G Networks”, in IEEE INFOCOM, 2013.
[12]
A. B¨ar, P. Casas, L. Golab, A. Finamore, “DBStream: an Online Aggregation, Filtering and Processing System for Network Traffic Monitoring”, in TRAC, 2014.
[13]
Y. Zhu, B. Helsley, J. Rexford, A. Siganporia, S. Srinivasan, “LatLong: Diagnosing Wide-Area Latency Changes for CDNs”, in IEEE TNSM, vol. 9(3), pp. 333-345, 2012.
[14]
J. Jiang, V. Sekar, I. Stoica, H. Zhang, “Shedding Light on the Structure of Internet Video Quality Problems in the Wild”, in ACM CoNEXT, 2013. [15] G. Tyson, Y. Elkhatib, N. Sastry, S. Uhlig, “Demystifying Porn 2.0: a Look into a Major Adult Video Streaming Website”, in ACM IMC, 2013. [16] International Telecommunication Union, “Methods for Subjective Determination of Transmission Quality”, ITU-T Rec. P.800, 1996.