BIOINFORMATICS APPLICATIONS NOTE Bioimage informatics
Vol. 29 no. 10 2013, pages 1359–1360 doi:10.1093/bioinformatics/btt154
Advance Access publication April 10, 2013
DP2: Distributed 3D image segmentation using micro-labor workforce Richard J. Giuly*, Keun-Young Kim and Mark H. Ellisman National Center for Microscopy and Imaging Research, Center for Research in Biological Systems, Department of Neurosciences, University of California, San Diego, La Jolla, CA 92093, USA Associate Editor: Jonathan Wren
ABSTRACT Summary: This application note describes a new scalable semi-automatic approach, the Dual Point Decision Process, for segmentation of 3D structures contained in 3D microscopy. The segmentation problem is distributed to many individual workers such that each receives only simple questions regarding whether two points in an image are placed on the same object. A large pool of micro-labor workers available through Amazon’s Mechanical Turk system provides the labor in a scalable manner. Availability and implementation: Python-based code for non-commercial use and test data are available in the source archive at https://sites.google.com/site/imagecrowdseg/. Contact:
[email protected] Supplementary information: Supplementary data are available at Bioinformatics online. Received on October 15, 2012; revised and accepted on March 26, 2013
1 INTRODUCTION The improved resolution and amount of detail afforded by emerging electron microscopy (EM) techniques, such as serial block scanning EM (SBEM) (Denk and Horstmann, 2004; Leighton, 1981), is enabling researchers to explore scientific questions pertaining to morphology and network connectivity that were previously impossible (Eisenstein, 2009). SBEM techniques, coupled to new staining protocols (Deerinck et al., 2010), are able to reveal cell boundaries, sites such as synapses, and many intracellular components, such as synaptic vesicles and mitochondria. Manual segmentation represents a well-recognized bottleneck in cellular imaging. In a typical scenario, segmentation involves a single trained expert using automated algorithms or manual methods to examine and mark up each individual slice and trace contours around the structures of interest using a program such as TrakEM2 (Cardona, 2006) or other specialized software programs. Dual Point Decision Process (DP2) streamlines and parallelizes the process by distributing it to a large number of workers. Amazon’s Mechanical Turk system enables rapid completion of jobs as a consequence of the large number of workers continuously available and attracted to this resource (In our tests, tens of thousands of decisions were accomplished in 51 day.). Average cost was 1.2 dollars per cubic micron for Dataset 1, a mouse optic nerve sample, and 56 dollars per *To whom correspondence should be addressed.
cubic micron for Dataset 2, a mouse cerebellar neuropil sample (shown in Supplementary Information). The tests were performed with a payment of one cent (US Dollars) per decision.
2
BACKGROUND
Although progress has been made to develop automatic segmentation techniques appropriate for cells (Andres et al., 2008; Jain et al., 2007; Jurrus, 2010; Kaynig et al., 2010; Mishchenko, 2009), there remains a need for more accurate, rapid and robust techniques to delineate cells in SBEM data. Jeong and Chklovskii use a combination of 3D visualization and semi-automatic segmentation to address the segmentation challenge (Chklovskii et al., 2010; Jeong et al., 2009). Our method differs from these in that we use micro-labor workers with a simple web interface rather than a trained user with a more complex interface. This makes our method scalable in that a large number of workers are readily available for a given job. Roberts describes a method using sparse scribbles from users (Roberts et al., 2011) to semi-automatically trace neural processes. Additionally, the Eyewire project led by Sebastian Seung uses volunteers who learn to perform 3D semi-automatic segmentation with a specialized web viewer (Wiecek, 2012). Our method differs from these in that user decisions are completely binary based on images of points within superpixels. Additionally, our application uses the micro-labor environment of Amazon’s Mechanical Turk so that work can be accomplished practically by the existing pool of visitors who survey Mechanical Turk offerings. To make our process appropriate for such a system, users are given a simple presentation of dots automatically rendered on an image and only asked to answer yes or no decisions. Also, in contrast to Eyewire, we test with membranes and intracellular components stained, whereas Eyewire currently addresses data where only extracellular regions are stained. Finally, although some other methods such as (Jain et al., 2007) use machine learning for automatic segmentation, our method does not; therefore, we do not need a large amount of human-labeled training data or a large of amount of training time for machine learning.
3
METHODS
The overall DP2 process consists of an initial over-segmentation followed by a manual merging process to create a segmentation. The 3D dataset is represented as a stack of 2D images. To pre-process the data, we first smooth the original images with a 2D Gaussian filter. Then a 2D watershed operation from the Insight Toolkit (Yoo et al., 2002) is applied on the gradient magnitude of the
ß The Author 2013. Published by Oxford University Press. This is an Open Access article distributed under the terms of the Creative Commons Attribution License (http://creativecommons.org/licenses/by/3.0/), which permits unrestricted reuse, distribution, and reproduction in any medium, provided the original work is properly cited.
R.Giuly et al.
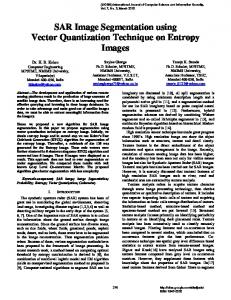
are cropped so that the field of view only covers the two superpixels relevant to the decision. For each merge decision, the job of the user is to decide whether the two dots lie on the same object. If both dots lie in the same object, then the superpixels should be merged. The implementation of the merging process is demonstrated using Mechanical Turk. Two types of tasks are assigned to users. One is to merge two adjacent superpixels in one image plane (Case 1), and the other is to connect superpixels in adjacent planes (Case 2). For Case 1, the user makes merge decisions based on whether two dots on a single image corresponding to two adjacent superpixels are within the same cell. For Case 2, the worker must identify superpixels that should be connected from one image slice to the next. To accomplish this, a two-frame animated image is presented that repetitively switches between the two image slices, showing a dot on each the two superpixels that are being evaluated. In this case, the user must judge whether the dot is staying inside the same cell as frames alternate.
ACKNOWLEDGEMENTS The authors thank David Lee and Eric Bushong for useful advice. Funding: Grant 1R01NS075314 from National Institute of Neurological Disorders and Stroke and NIH grant P41GM103412 from NIGMS to M.H.E. Conflict of Interest: none declared.
REFERENCES
Fig. 1. (A) Image of axons and myelin in optic nerve. (B) Red dots placed on two different superpixels. (C) Two superpixels associated with two dots presented to the user. (D) All superpixels in the view, highlighted in different colors. (E) Segmentation after all superpixels merge decisions have been made. (F) 3D rendering showing two axons in red and blue
Gaussian-filtered image to create superpixels. Each region of the watershed operation is a superpixel, and the watershed operation is tuned to favor over-segmentation rather than under-segmentation. This superpixelization process is applied to every slice of the 3D volume to produce an initial over-segmentation. To begin the merge decision process, a graph is created to represent the superpixels and possible merge operations. Each of the superpixels is a node of the graph, and each pair of adjacent superpixels represents a possible edge in the graph. Any two neighboring superpixels in a 2D image are considered adjacent (Case 1). Additionally, any two superpixels in neighboring planes that touch are considered adjacent (Case 2). The goal of the workers is to decide what adjacent superpixels should be merged to transform the over-segmentation into a more accurate segmentation. Therefore, if users judge that adjacent superpixels should be connected, the corresponding edge in the graph is added. Two positive votes from independent users are required for the merge to be accepted. After graph edges are added, the final step consists of computing connected components in the graph. Each component represents a single object of the image, such as an axon belonging to a nerve cell. Careful presentation of decisions to the workers in the merging decision process is important. To keep presentation clear and elegant, they are not shown the outline of superpixels explicitly. Rather, for each pair of adjacent superpixels, an image is generated (as shown in Fig. 1B) that shows two dots superimposed on the original image data placed at the two superpixel centers (If the center of a superpixel lies outside of the superpixel, a random point inside of the superpixel region is used instead.). The images
1360
Andres,B. et al. (2008) Segmentation of SBFSEM volume data of neural tissue by hierarchical classification. In: Rigoll,G. (ed.) Proceedings of the 30th DAGM symposium on Pattern Recognition, Lecture Notes in Computer Science 5096. pp. 142–152, Springer, Berlin. Cardona,A. (2006) TrakEM2: an ImageJ-based program for morphological data mining and 3d modeling. In: Proceedings of the ImageJ User and Developer Conference, May 18-19th, Luxembourg. Chklovskii,D.B. et al. (2010) Semi-automated reconstruction of neural circuits using electron microscopy. Curr. Opin. Neurobiol., 20, 667–675. Deerinck,T.J. et al. (2010) Enhancing serial block-face scanning electron microscopy to enable high resolution 3-D nanohistology of cells and tissues. Microsc. Microanal., 16, 1138–1139. Denk,W. and Horstmann,H. (2004) Serial block-face scanning electron microscopy to reconstruct three-dimensional tissue nanostructure. PLoS Biol., 2, e329. Eisenstein,M. (2009) Neural circuits: putting neurons on the map. Nature, 461, 1149–1152. Jain,V. et al. (2007) Supervised learning of image restoration with convolutional networks. In: IEEE 11th International Conference on Computer Vision, pp. 1–8. IEEE Computer Society, Los Alamitos, CA, USA. Jeong,W.K. et al. (2009) Scalable and interactive segmentation and visualization of neural processes in EM datasets. IEEE Transactions on Visualization and Computer Graphics, 15, 1505–1514. Jurrus,E. (2010) Detection of neuron membranes in electron microscopy images using a serial neural network architecture. Med. Image Anal., 14, 770–783. Kaynig,V. et al. (2010) Neuron geometry extraction by perceptual grouping in ssTEM images. In: 2010 IEEE Conference on Computer Vision and Pattern Recognition (CVPR). IEEE, pp. 2902–2909. Leighton,S.B. (1981) SEM images of block faces, cut by a miniature microtome within the SEM—A technical note. Scan. Electron Microsc., 2, 11. Mishchenko,Y. (2009) Automation of 3D reconstruction of neural tissue from large volume of conventional serial section transmission electron micrographs. J. Neurosci. Methods, 176, 276–289. Roberts,M. et al. (2011) Neural process reconstruction from sparse user scribbles. Med. Image Comput. Comput. Assist. Interv., 14 (Pt 1), 621–628. Wiecek,A.S. (2012) Crowdsourcing microscopic analysis. Biotechniques. http://www. biotechniques.com/news/Crowdsourcing-Microscopic-Analysis/biotechniques331740.html?autnID=314861 (18 April 2013, date last accessed). Yoo,T.S. et al. (2002) Engineering and algorithm design for an image processing Api: a technical report on ITK-the Insight Toolkit. Stud. Health Technol. Inform., 85, 586–592.