Presented at the 19th ICA Meeting Ottawa Aug 14-21 1999
1
Dynamic Generalisation from Single Detailed Database to Support Web Based Interaction Elizabeth Glover and William A Mackaness Department of Geography The University of Edinburgh, Drummond St Edinburgh EH8 9XP, Scotland email:
[email protected] Abstract It is believed that Web-based visualisation of spatial information could be greatly enhanced through the use of dynamic or 'onthe-fly' map generalisation. This involves dynamically deriving scale- and theme-dependent displays from a single detailed dataset, thus eliminating the need to maintain duplicate datasets at different resolutions. Dynamic generalisation also prevents the generation of cartographically-poor maps that result from the display of spatial information at a considerably different resolution from that at which it was captured. The implementation involves combining automated generalisation and symbolisation techniques together in a simple rule-base to produce a virtual map of central Edinburgh in which both the level of detail and the symbology is dynamically tailored to a user-specified scale and map theme (tourist or topographic maps). The paper explores the inherent differences between the generalisation of a virtual map and that of a paper map, and also considers issues such as those arising from the relationship between map scale, map theme and utility. The research demonstrates that it is possible to achieve effective results using a limited number of simple mechanisms, and argues that the true potential of dynamic generalisation lies in two main areas - firstly, in an ability to narrowly-define the map theme, thus enhancing map clarity and more closely matching user requirements; and secondly, in using control over the map scale as a gateway to other types of map use and other themes.
1.0 Introduction Dynamic generalisation is the derivation of a temporary generalisation from a detailed geographic database, often for display on a computer screen (Van Oosterom, 1995). As every display is automatically derived on-the-fly from a single detailed dataset, database redundancy is avoided (Van Oosterom, 1995). Automated generalisation offers other advantages. Not only is the costly and time-consuming bottleneck of manual generalisation removed, but currency and consistency across the range of representations can be vastly improved (Gower et al, 1997). Secondly, the production of cartographically-poor maps can be prevented by dynamically generalising the map according to the requested display scale, thus producing smoother transitions over scale. Dynamic generalisation also enables a range of map themes to be produced through selection of the features displayed.
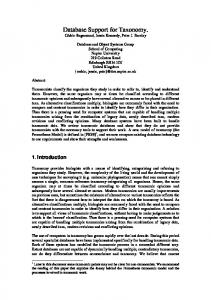
2.0 Modelling and Automating Map Generalisation The representation of a cartographic feature becomes increasingly abstract as map scale decreases, as illustrated in Figure 1a. It is possible to model this transformation in terms of the generalisation operators used. Most generalisation at larger scales occurs through the transformation of the feature's geometry. The mechanisms of simplification, enlargement and displacement are utilised, and changes occur quite smoothly. Particular generalisation solutions can therefore be envisaged as operating over a particular scale band defined by an upper and lower threshold scale. As the map scale reaches a threshold, a change in the level of generalisation is invoked. This cut-off point is in part determined by the feature’s geometry. Shape and size will dictate the scales at which firstly detail, and eventually the entire feature, become unidentifiable. Figure 1b shows the scale bands over which the representations in Figure 1a might operate. The generalisations used, and their associated scale bands, are however influenced by a number of other factors. As Ormsby and Mackaness (1999) have suggested in their phenomenological approach to generalisation, both map theme and object type play a part. Muller (1989:202) too points out that '... the threshold point which separates geometric and conceptual generalisation does not occur at the same scale for every cartographic feature and every thematic realm'. A further influence is the context of the object undergoing generalisation. For example, a small building in a city may be eliminated as map scale is reduced, but a similarly-sized building in a remote area would be retained.
Presented at the 19th ICA Meeting Ottawa Aug 14-21 1999
2
(a) a
d
c
b
(b) d c b
a 1:1250
1:10,000
1:25,000
1:50,000
Figure 1: a) Transformations with decreasing map scale; b) Corresponding scale bands for a topographic map. The dynamic generalisation presented in this paper attempts to cross a broad range of scales. Most commonly, automated generalisation is undertaken over scale reductions of factor 10 or perhaps less. For example, the Ordnance Survey 1:10,000 LANDPLAN data is derived from 1:1250 source data (Gower et al, 1997) and the Institut Géographique National in France is automating generalisation from a source scale of 1:50,000 to a target scale of 1:250,000 (Lecordix et al, 1997). Here, however, displays at 1:50,000 are derived directly from a source dataset at 1:1250 - a scale reduction of factor 40. Identification The study of both Ordnance Survey and tourist maps of Edinburgh yielded a number of generalisation solutions that could feasibly be automated. Given the urban nature of the area, the process of knowledge acquisition focused on key buildings such as hospitals, stations, and museums, general buildings, and road features. Examples of building generalisation are given in Figure 2 for two broad groups of buildings: key (or special buildings) and general buildings. Scale 1:1250 1:10,000 1:50,000 1:250,000 1:25,000 (a)
(b)
(c)
(d)
key building
CASTLE
Castle
general buildings
Figure 2. Examples drawn from paper maps of building generalisation at various scales
3.0 Key buildings Selection and simplification Representation (b) of Figure 2 can be approximately derived by eliminating the smaller buildings and simplifying the remainder. Simplification is performed using a previously-implemented algorithm designed for the simplification of features with right-angled geometries. The algorithm works by flipping out the corners of the building. See Glover (1998) for a more detailed explanation of the algorithm. Aggregation Representation (c) in Figure 2 requires the aggregation of all the buildings making up the castle. In order for aggregation to occur, the component objects first need to be grouped together. The derivation of meaningful groups of objects is a critical element of map generalisation and as such has received considerable attention in the literature. Methods proposed include the use of minimum spanning trees (Regnauld, 1996), graph theory (Mackaness and Beard, 1993) and multi-variate cluster analysis (Ormsby and Mackaness, 1999). These methods are designed to produce clusters within a particular feature layer, for example buildings that have not been explicitly defined. The buildings are then aggregated using an existing algorithm that returns the convex hull of the set of geometries. The convex hull is simplified using a Douglas Peuker line simplification
Presented at the 19th ICA Meeting Ottawa Aug 14-21 1999
3
algorithm to give a less rounded appearance. A full account of the grouping procedure and aggregation algorithm and can be found in Glover (1998). Collapse Representation (d) shown in Figure 2 involves deriving a point geometry from the original area geometries. If the centre of a single building is required, the centre of the building is used as the point location. If the centre of a number of buildings is required, the centre of the minimum bounding rectangle of the group is used. A more representative location might be achieved by computing the centre of gravity of the group.
4.0 General buildings Selection and simplification Representation (b) in Figure 2 can be approximately derived by eliminating smaller buildings and simplifying the remainder. Area patch generalisation Representation (c) of Figure 2 can be produced by using an approach based on Muller and Wang's (1992) area patch generalisation algorithm, designed to generalise sets of area features varying in shape and size but of the same type. Each feature is either expanded, contracted, or eliminated. Although the algorithm was originally developed for the generalisation of natural features, it has since been modified and successfully applied to buildings by Ormsby (1996). A simplified approach has been used here. Buildings below a minimum area are eliminated and those remaining are expanded through scaling. The enlargement causes the appearance of aggregation as buildings overlap to produce built-up areas. Solid built-up area A solid built-up area is represented by polygonising the areas in between the road network to form city blocks. These can then be plotted with a solid fill. Roads Roads are generalised simply by selection and the alteration of symbology. At the larger scales, roads are displayed as cased lines. As map scale decreases, minor roads are initially reduced to a single line and are finally eliminated.
5.0 Identification of scale bands Paper maps provide just a few snapshots of the whole generalisation continuum. Interpolation was therefore required to identify generic scale bands over which each solution operates. The points at which one representation gives way to another could, theoretically, occur at any point on along the continuum. In this research, the scale of the printed map was taken to be the upper threshold for that particular representation. Scale bands were then interpolated back to the point at which a more detailed map had been produced. For example, the scale band for the representation used on a 1:50,000 map would be 1:25,000 - 1:50,000. The scale bands identified in this manner are not directly applicable to a virtual map displayed on a computer screen due to differences in resolution. While raster printers and plotters can achieve resolutions ranging from 200 to 2000 dots per inch, the resolution of a computer screen is typically only 72 dots per inch (Jones, 1997). A map displayed on a computer screen can therefore support far less detail than a printed map of the same scale. This means each threshold must be shifted towards the large-scale end of the continuum. Generic scale bands for the virtual maps were identified by displaying each representation at its upper threshold scale as identified from the printed map, and then zooming in until the resolution was comparable to that of the printed map. The two sets of scale bands are displayed in Table 1. Scale band
Printed map Lower threshold Upper threshold a 1:1 1:6,000 b 1:6,000 1:25,000 c 1:25,000 1:50,000 d 1:50,000 1:250,000 Table 1. Scale bands for printed and virtual maps
6.0 Influences on generalisation
Virtual map Lower threshold 1:1 1:6,000 1:14,000 1:26,000
Upper threshold 1:6,000 1:14,000 1:26,000 1:50,000
Presented at the 19th ICA Meeting Ottawa Aug 14-21 1999
4
A number of factors beyond just geometric influence the form of representation. These are map theme, object type and context. Map theme Not only does the generalisation solution depend on the map theme, but generalisation operators can also be used to control the thematic content of the map. In order to demonstrate these relationships, two map types with strongly contrasting styles (topographic and tourist) were studied and automatically derived from the source dataset. Table 2 outlines the main differences between the two map types. Bertin (1967) was perhaps the first author to propose that map theme could influence the generalisation process, demonstrating that very different results could be produced according to whether the end product was to be a road map, air chart or for an atlas. The different styles were achieved by manipulating the threshold scales between solutions. TOPOGRAPHIC
TOURIST
Content
Wide range of features of general interest
Features of touristic interest or importance only
Primary consideration
Shape, size and distribution of features
Location and relative size of features
Style
Full of detail Geometric icons used
Simple, clear Pictorial icons common
Table 2. Differences between topographic and tourist maps. Map theme can also be controlled through the reclassification of features. Key buildings can be reclassified as general buildings if they are not 'key' to the particular map use. For example, schools need not be displayed on a tourist map so are displayed instead in the same way as the general buildings. Object type It is now commonly accepted that generalisations vary according to object type (see for example Mark, 1991). A buffering technique appropriate for the generalisation of natural features is, for instance, inappropriate for right-angled buildings as it does not preserve orthogonality (Ormsby and Mackaness, 1999). As demonstrated in Figure 2, generalisation solutions vary according to the type of building. They also vary between different key buildings; for example, the castle and station are collapsed to point symbols whereas university buildings and schools are eventually aggregated into a built-up area. Context Having discussed the importance of map theme and object type, it must now be acknowledged that generalisation needs to be sensitive to context. The solution must consider the neighbourhood of an object if it is to preserve the original relationships between objects. A number of mechanisms are introduced here that modify the generalisation in order to accommodate neighbouring objects. When generalising a key building object, it needs to be considered in the context of its surroundings. If it is surrounded by other buildings of the same type, the buildings are generalised as a group through aggregation. If the object is surrounded instead by general buildings, the building is instead generalised by using a previously-implemented algorithm that creates its minimum bounding rectangle, scales it to preserve the original building area, and rotates it to reflect the principle orientation of the original building. At smaller scales, the density of the surrounding buildings should be assessed, to evaluate whether they would be better generalised as a solid built up area. A measure of the density of buildings within the city block is gained by calculating the total area of all buildings within the block and dividing by the total block area. This gives an index between 0 and 1. A cut-off density was evaluated through empirical observation. If the index is 0.35 or above, the block is plotted as a solid built-up area. Otherwise, a sub-set of the original buildings are plotted using the area patch option outlined above. As the scale reduces towards 1:50,000, only the blocks are plotted as any individual building detail becomes unidentifiable.
7.0 Implementation of a Cartographic Rule Base The creation of transitions in representation such as those outlined above requires generalisation to be performed at the object level. It also necessitates a series of decisions to be made on the basis of factors such as map type and display scale. These two requirements have meant that the implementation has been carried out using a powerful object-oriented GIS, and using a rule-based approach. An explanation of the object-oriented approach and the details of the implementation within an object-
Presented at the 19th ICA Meeting Ottawa Aug 14-21 1999
5
oriented environment, can be found in Glover (1998). A decision tree or simple rule-base determines which of the solutions is to be carried out, invokes the actual generalisation and plots the chosen representation. The rule-based approach to generalisation is one that has received considerable attention in the literature (see for example Nickerson and Freeman, 1986; Beard, 1991; Richardson and Muller 1991; Buttenfield 1991; Weibel 1991, Heisser et al 1995). Rules are constructed using the if-then syntax - if the condition is met, the action is triggered. The rule base can be summarised as a three stage approach: 1. The display scale, map type and if necessary, the object class, are retrieved. Plot styles and threshold scales are set up accordingly. 2. Any other necessary analysis is then performed - for example, how large is the building? Is it detached? The appropriate generalisation solution is then retrieved. 3. The generalisation is plotted. The decision tree used for plotting key buildings and general buildings are shown in Figures 3 and Figure 4. Scale band 1 Get source dataset geometry
Scale band 2
YES
ELIMINATE
NO
SIMPLIFY
Building area < 150 ?
PROPORTIONAL MBR
Scale band 3 radius search single building?
ENLARGE
YES NO
get icon symbol
get building centre
CONVEX HULL
SIMPLIFY NO get convex hull centre
overlaps road?
REGROUP YES
Get centre of each subgroup
get icon symbol
convex hulls of subgroups
H get icon symbol
Scale band 4 get building centre
YES radius search single building? NO
get convex hull or convex hulls of subgroups
Figure 3. Decision tree for key buildings.
get convex hull centre(s)
get icon symbol
get icon symbol
H
Presented at the 19th ICA Meeting Ottawa Aug 14-21 1999
6 PLOT
Scale band 1 Get source dataset geometry
Scale band 2
YES
ELIMINATE
NO
SIMPLIFY
PLOT
Building area < 200 ? ENLARGE
Scale band 3 Land parcel density> 0.35?
get land parcel geometry
YES NO YES
Building area < 300 ?
ELIMINATE
NO YES SIMPLIFY
ENLARGE
Scale band 4 Land parcel density > 0.3?
overlaps road?
clip to road
NO
YES
get land parcel geometry
NO
ELIMINATE
Figure 4. Decision tree for general buildings.
8.0 Results and Evaluation Quality of output is commonly evaluated through comparison with manual generalisations. This is the approach adopted here, although it should be noted that some doubt exists as to whether automatically produced maps should attempt to imitate manual ones exactly. This is because manual solutions can be instinctive and subjective, with different cartographers producing very different results (Muller et al, 1995). Figure 5 shows derived products from a single detailed database, using the above decision trees, implemented as display methods in Laser Scan's Gothic GIS. Full descriptions of the implementation and evaluation are given in Glover (1998). The results are encouraging, particularly those gained at greater abstraction . The majority of maps are clear and easy to read. There are however a number of areas where improvements can be made and are considered to be important components of future work.
Presented at the 19th ICA Meeting Ottawa Aug 14-21 1999
7
SOURCE
TOURIST
TOPOGRAPHIC Mu Mu
Cas
Mu Uni
Sch
Figure 5. Different products according to theme and scale derived from the same source.
9.0 Conclusion Through the implementation of dynamic generalisation, this study has demonstrated that effective scale- and themedependent virtual maps can be produced using a limited number of simple mechanisms. The most promising results are achieved at greater abstraction levels and for a more specific map theme. In conclusion, the true potential of dynamic generalisation lies in two areas. Firstly, opportunities exist not only in its application to the derivation of scale-dependent displays, but also in its ability to produce a wide range of specific map themes, thus enabling the user to choose a map type closely matching their requirements. By narrowly defining the map theme, greater selectivity in the features displayed is possible. As the results demonstrate this will promote the production of clearer and more effective maps. Great potential also lies in the possibility of harnessing the implicit link between map theme, scale and utility, to develop a virtual map in which control over the map scale acts as a gateway to other types of map use and theme.
11.0 Acknowledgement The authors are extremely grateful for access to source data from the National Mapping Agency of the UK, the Ordnance Survey, under the Chest Agreement and for their support for research in this field.
Presented at the 19th ICA Meeting Ottawa Aug 14-21 1999
8
11.0 References Beard, K. 1991. Constraints on rule formation, in Buttenfield, B.P. and McMaster, R.B., eds. Map generalization: making rules for knowledge representation, Longman, Essex, pp121-135. Bertin, J. 1967. Semiologie graphique, Gauthier-Villars, Paris. Buttenfield, B.P. 1991. A rule for describing line feature geometry, in Buttenfield, B.P. and McMaster, R.B., eds. Map generalization: making rules for knowledge representation, Longman, Essex, pp150-171. Glover, E. 1998. The application of dynamic generalisation to virtual map design. The University of Edinburgh MSc Dissertation Research Paper. Unpublished. Gower, R., Pepper, J. and Edwards, T. 1997. Landplan - automated generalisation comes of age, ICA Proceedings, pp126133. Heisser, M., Vickus, G. And Schoppmeyer, J. 1995. Rule-orientated definition of small area selection and combination steps of the generalization procedure, in Muller, J-C., Lagrange, J-P., Weibel, R. GIS and Generalization: Methodology and Practice. Taylor & Francis, London, pp Jones, C.B. 1997. Geographical Information Systems and Computer Cartography, Longman, Harlow. Lecordix, F., Plazanet, C., Lagrange, J-P. 1997. PlaGe: a platform for research in generalisation. Unpublished. Mackaness, W.A. and Beard, K. 1993. Use of Graph theory to support map generalization. Cartography and Geographic Information Systems, 20(4), pp210-221. Mark, D.M. 1991. Object modelling and phenomenon-based generalization, in Buttenfield, B.P. and McMaster, R.B., eds. Map generalization: making rules for knowledge representation, Longman, Essex, pp103-108. Muller, J-C. 1989. Theoretical considerations for automated map generalization, ITC Journal, 3, pp200-204. Muller, J-C. and Wang, Z.S. 1992. Area-patch generalization: a competitive approach. The Cartographic Journal, 29, pp137144. Muller, J-C., Lagrange, J-P., Weibel, R. 1995. GIS and Generalization: Methodology and Practice. Taylor & Francis, London. Nickerson, B.G. and Freeman, H. 1986. Development of a rule-based system for automatic map generalisation, Proceedings, Second International Symposium on Spatial Data Handling, pp537-56. Ormsby, D. and Mackaness, W.A. 1999. The development of Phenomenological generalization within an object-oriented paradigm. (Unpublished). Ormsby, D.W. 1996. The development of a phenomenological approach to cartographic generalization. The University of Edinburgh, MSc dissertation. Unpublished. Regnauld, N. 1996. Recognition of building clusters for generalization. Proceedings of the 7th International Symposium on Spatial Data Handling, 1, pp185-198. Richardson, D.E. and Muller, J-C. 1991. Rule selection for small-scale map generalization, in Buttenfield, B.P. and McMaster, R.B., eds. Map generalization: making rules for knowledge representation, Longman, Essex, pp. Van Oosterom, P. 1995. The GAP-tree, an approach to 'on-the-fly' map generalization of an area partitioning, in Muller, J-C., Lagrange, J-P., Weibel, R. GIS and Generalization: Methodology and Practice. Taylor & Francis, London, pp 120-132. Weibel, R., 1991, Amplified intelligence and rule-based systems, in McMaster, B. P. B. a. R. B., ed., Map generalization: Making rules for knowledge representation, Essex, Longman Scientific & Technical, p. 172-186.