pISSN 1976-913X eISSN 2092-805X
J Inf Process Syst, Vol.9, No.1, March 2013
http://dx.doi.org/10.3745/JIPS.2013.9.1.001
Dynamic knowledge mapping guided by data mining: Application on Healthcare Menaouer Brahami*, Baghdad Atmani* and Nada Matta* Abstract—The capitalization of know-how, knowledge management, and the control of the constantly growing information mass has become the new strategic challenge for organizations that aim to capture the entire wealth of knowledge (tacit and explicit). Thus, knowledge mapping is a means of (cognitive) navigation to access the resources of the strategic heritage knowledge of an organization. In this paper, we present a new mapping approach based on the Boolean modeling of critical domain knowledge and on the use of different data sources via the data mining technique in order to improve the process of acquiring knowledge explicitly. To evaluate our approach, we have initiated a process of mapping that is guided by machine learning that is artificially operated in the following two stages: data mining and automatic mapping. Data mining is be initially run from an induction of Boolean case studies (explicit). The mapping rules are then used to automatically improve the Boolean model of the mapping of critical knowledge Keywords—Knowledge Management, Knowledge Mapping (Knowledge Cartography), Knowledge Representation, Boolean Modeling, Cellular Machine, Data Mining, Boolean Inference Engine
1. INTRODUCTION Currently most companies are aware of the need to manage their wealth of knowledge [38]. Sharing and knowledge transfer between generations is a topical issue related to the expected retirement of trade’s experts for years to come. The conclusion is that there is a risk of a loss of knowledge that will keep [21, 17]. In this method it is possible to formalize this strategic heritage of knowledge. We are interested in our study on the mapping of critical knowledge domains. Knowledge can be mapped to acquire, monitor, create, share, and finally to capitalize and transfer. The method of knowledge mapping is used to represent and analyze the knowledge of a company by grouping the company’s knowledge by area and then by viewing them as a map [5, 51, 22, 47, 27, 48]. Fascinated by the impressive ability of computer tools, companies have developed processing systems and reporting hoping, no doubt, dominate the problems associated with continuous and increasing information. However the information can now be stored and prepared for study by using the new techniques of Data Warehouse. Among the obstacles for successfully extracting knowledge from data mining, we point to the increasing amount of information generated and Manuscript received December 9, 2012; accepted February 20, 2013. Corresponding Author: Menaouer Brahami * Laboratory LIO, Dept. of Computer Science, Faculty of Sciences, University of Oran, Algeria ({mbrahami, atmani.baghdad}@gmail.com) ** Laboratory ICD/TechCICO, University of Technology of Troyes (UTT), France (
[email protected])
1
Copyright ⓒ 2013 KIPS
Dynamic knowledge mapping guided by data mining: Application on Healthcare
made available to the departments concerning access to the right information at the right time. As a result of the arrival of these two fields of application (Data Mining and Data Warehouse), a new idea becomes obvious, “Why not combine all of these techniques to create powerful methods for automated knowledge extraction to improve the mapping process, including all stages from data collection to the evaluation of knowledge gained?” Thus, the idea of mapping knowledge through a process of Knowledge Discovery in Data (KDD) was born. Our contribution in this area consists of designing and experimenting on a new approach of mapping the domains of critical knowledge by automatic learning. We did so by exploiting the proven performances with the techniques of the mathematical formal of a cell machine CASI (Cellular Automata for Symbolic Induction) [2]. The result of the mapping of critical knowledge domains, made by MASK II [3, 21], is refined by a symbolic automatic learning process graph-based induction. This refinement is done by the Boolean Inference Engine (BIE) who is attend of the symbolic induction to optimization of the induction graph and who going ensure, thereafter, the internal representation of the new map of critical knowledge domains.
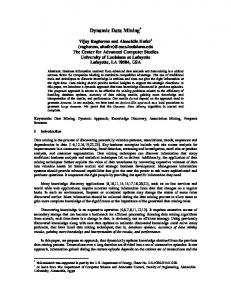
2. RELATED WORK In recent years, awareness about the strategic importance of knowledge of an organization that has its strategic value is linked to its knowledge and its exploitation. The potential damage caused by the loss of a key competence and the volume of departures, scheduled or not, most experienced staff alert, in a manner becoming stronger, the need to adopt management strategy knowledge. Indeed, tact/explicit knowledge management is extremely rich and dynamic and it has become necessary to model them. This modeling is used to transform large amounts of data, from interviews with experts to searching documents in multiple repositories that are related to business activities [9]. To this end, a multitude of tools and methods exist for knowledge discovery in data, expert interviews, and/or reference materials. These methods are classified into two categories: explicit methods (capitalization) and methods for automatically extracting knowledge [9, 36] (Fig. 1).
Fig. 1. Mining and explicit knowledge [9, 10]
2
Menaouer Brahami, Baghdad Atmani and Nada Matta
Knowledge mapping, which is considered as a method of knowledge explicitation, aims to showcase the trade’s critical knowledge of the company [21]. Knowledge mapping is primarily a managerial approach whose finality is to identify the patrimonies of know-how that are strategic in the actions of the trades in the organization. The identification of the latter in an organization is to sustain develop knowledge that is related to the company's business as its work strategy. Its main purpose consists in quickly showing the collaborators of an organization, a network or pathway, where is located the expertise sought. Similarly, it allows for the indication of the importance of knowledge that is at risk of being lost and that must be preserved [22]. Several approaches to the evolution of mapping have been proposed for organizing the cognitive resources of a company. Aubertin et al. [3] proposed three different approaches for the realization of mapping by functional classification, which respectively use the organization chart, classification by process, and classification by domains. Matta et al. [36] conducted a project for mapping the knowledge and the technical competence that are critical within the direction of the innovation and research of the INRS. Ermine J.L. [22] completed a project at Chronopost International (observatory of trades), which relies on the following two objectives: first, to identify the know-how of trades that are affected by the strategy; and second, to consider the evolution of critical skills in the future. For this, Ermine J.L. built upon the project in several phases: the first phase is the realization a mapping that is strategic in regards to business actions and that is formalized by the graphical model approach of “a map of knowledge domains.” The second phase consists of an analysis of the know-how of the trades that are critical. This is done through the use of criticality criteria and takes into account the specifics of Chronopost International. Chabot J.L. [18] proposed a complete mapping of the different areas of expertise to the company HYDRO-Quebec. However, the primary objective was to on one hand, identify the areas of knowledge, and on the other hand, to do a study of criticality in order to bring out the critical knowledge domains with the help of the French Society Kadrant. Barroso et al. [8] conducted a project at the center of radio pharmacy in Sao Paulo (IPEN). Since the nuclear domain suffers from problems related to this considerable accumulation of the knowledge, such as the risk of non-preservation, the difficulty of transfer, etc. they have developed the project in several steps by using a process approach. The process was described in a conventional manner in the form of flow diagrams linking the activities that in the process. In addition, there is a very wide range of works that propose data mining techniques for the extraction of hidden new knowledge from a large quantity of data. The main objective of this work is to analyze the content data to extract significant knowledge. This supports and enhances the decision process of knowledge management and in particular, the mapping of critical knowledge domains. Several types of cooperation between mining and knowledge management have been proposed to improve the knowledge already formalized in the organization. The problem with the fusion of mining and with knowledge management is complex and expensive. Several techniques have been proposed to exploit the specific data of the application domain in order to optimize the process of mapping domains of critical knowledge [24, 28]. Among the problems of the knowledge mapping, we quote notably dynamic research on knowledge domains decisional in a knowledge map which becomes more and more complex to because of several parameters (number of domains, criteria and degrees of criticality) well as the evolution of knowledge maps by exploiting of other sources of enterprise data.
3
Dynamic knowledge mapping guided by data mining: Application on Healthcare
In this field of knowledge extraction from data, several techniques of artificial intelligence are the basis of numerous studies. These studies include the work of Hai Wang et al. [29] on economic intelligence. Hai Wang et al. proposed a model of knowledge sharing based on various “blogs” to support the process of knowledge management. In biology, Fabien Jalabert et al. [32] recommended an integrated environment I2DEE (Integrated and Interactive of Data Exploration Environment) that was applied to the two distinct application areas of engineering terminology and ontology, and to data analysis gene expression from ADN chips. The main objective of (I2DEE) was the integration and visualization of heterogeneous data in the design process of an RTO (Terminological Resource or Ontological) that is specific to a given application. This environment allows, through a chain of analysis and data processing, filter concepts and relations that are pertinent to this application and to present them to the user through a knowledge map with which it can interact via a communication interface. Since the information system of each company contains a huge amount of data Jelena Mamcenko et al. [33] proposed a methodology to extract pertinent knowledge that has been previously hidden through correlations between data. Nhien Year Khac et al. [39] have created a distributed knowledge map that easily and effectively shows the new knowledge discovery in data sets that are stored in the distributed platforms (data grids). Finally, Emmanuel Blanchard et al. [12] proposed a method that is based on reasoning mechanisms to enhance the system of knowledge management and the reliability of the identification skills of an individual. The main objective is to propose a knowledge mining process that is defined by an analogy with the extraction of association rules, in order to induce a rule base from a knowledge base. In this context, we have set for ourselves the objective of processing the integration of the data mining to support the MASK II approach in the mapping of the critical knowledge domains of the health SEMEP (Services of Epidemiology and Preventive Medicine) service of the city of Mostaganem in Algeria.
3. PROPOSED APPROACH The objective of our approach, as illustrated in Fig. 2, is double. First, the construction of the mapping of service SEMEP and the evaluation of the different domains of the critical trade know-hows of epidemiologies as based on the extraction work of expert knowledge (doctors, health technicians, psychologists, etc.). For this construction, we have used one of the methods of modeling and knowledge representation, the method MASK II [3, 21]. After getting the global mapping of the domains of critical knowledge of epidemiological [12, 14], we conducted the Boolean modeling that was inspired by the cellular machine CASI [2]. On the other hand, we improved the mapping of critical knowledge domains by a process that is guided by data mining. A contribution in this area consists of conceiving and experimenting on a new Boolean approach of critical knowledge mapping domains. The result of the mapping of critical knowledge by MASK II is refined through a symbolic automatic learning process graph-based induction.
4
Menaouer Brahami, Baghdad Atmani and Nada Matta
Fig. 2. General architecture of the proposed “MB3C” approach
3.1 Boolean Modeling of a Graph (BMG) The process of a Boolean modeling graph (BMG) that adopts our approach is structured in three phases: - BOG (Boolean Optimization and Generation) is for optimizing and generating the Boolean model from a graph and for generating a Boolean knowledge base (BKB); - The BIE (Boolean Inference Engine) is able, from a Boolean model of a graph (BMG), to simulate the operation of the basic cycle of an inference engine using two layers of finite state machines. It uses CELSUMMIT, for the summits and CELARC, for arcs. The states of cells are composed of three parts: ES, IS, and SS, respectively, and EA, IA, and SA, which designate the input, the internal state, and the output of a cell CELSUMMIT, respectively, of the cell CELARC. - BV (Boolean Validation) is devoted to the validation process of the model that has been developed.
Fig. 3. Boolean modeling of a graph (BMG)
5
Dynamic knowledge mapping guided by data mining: Application on Healthcare
To illustrate the principle of the Boolean modeling of a graph (BMG) that has been inspired by the cellular machine CASI [2], we consider the graph model shown in Fig 4, using the top partitions S0 {summit (s0)}, S1 {(s1), (s2)}, S2 {(s3), (s4)}.
Fig. 4. Generating partitions S0, S1, and S3
After the graph is transformed into a graph induction that has been generated by partitions, four (4) rules have been deduced using the BOG module in the form of, “if Condition then Conclusion.” Where condition is a logical expression composed of conjunctions, which will be called premise and where the conclusion majority class in the summit is described by the condition. For example, the knowledge base of rules generated with BMG is given in Table 1. Table 1. Knowledge base (symbolic representation of the graph) Rules
Premises
Conclusion
Rule 1
if
{s0}
then
{(X1=0), s1}
Rule 2
if
{s0}
then
{X1=1), s2}
Rule 3
if
{s2}
then
{(X2=0), s3}
Rule 4
if
{s2}
then
{(X2=1), s4}
Table 2 shows how the knowledge base extracted from this graph is represented by the layers CELSUMMIT and CELARC of the Boolean inference engine (BIE). The internal state of an IS a cell from the CELSUMMIT indicates the role of fact. In our graph IS = 0 corresponds to a fact of the form (si), IS = 1 corresponds to the fact of the form: attribute=value (Xi = value). Table 2. Initial configuration G0 ES
IS
SS
EA
IA
SA
Summit 1
s0
1
0
0
Arc 1
A1
0
1
1
Summit 2
X1 = 0
0
1
0
Arc 2
A2
0
1
1
Summit 3
s1
0
0
0
Arc 3
A3
0
1
1
Summit 4
X1 = 1
0
1
0
Arc 4
A4
0
1
1
Summit 5
s2
0
0
0
Summit 6
X2 = 0
0
1
0
Summit 7
s3
0
0
0
Summit 8
X2 = 1
0
1
0
Summit 9
s4
0
1
0
Summits
CELSUMMIT
6
Arcs
CELARC
Menaouer Brahami, Baghdad Atmani and Nada Matta
Denote the two matrices incidences of input and output representing the vicinity of cells by RE and RS. Using l cells in CELSUMMIT and r cells in CELARC the vicinity (RE, RS) is formulated as follows: - The input relation, denoted iREj, is formulated as follows: ∀i
1. . l, ∀j
1. . r, if the summit i ∈ Premise of arc j then R i, j ← 1
(1)
- The output relation, denoted iRSj, is formulated as follows: ∀i
1. . l, ∀j
1. . r, if the summit i ∈ Conclusion of arc j then R i, j ← 1
(2)
The incidence matrices RE and RS are used to traverse the graph from the root to the leaves (forward chaining). For chaining backwards is a runs through ascending from a leaf towards the root, you can simply to permute between the two matrices of RE and RS. Finally, in Table 3 we present respectively the two incidence matrices of RE and RS in graph below. Table 3. The impact of the input matrices, RE, and output RS R1
R2
R3
R4
R1
R2
R3
R4
s0
1
1
0
0
s0
0
0
0
0
X1=0
0
0
0
0
X1=0
1
0
0
0
s1
0
0
0
0
s1
1
0
0
0
0
0
RE
RS
X1=1
0
0
0
0
X1=1
1
0
s2
0
0
1
1
s2
0
1
0
0
X2=0
0
0
0
0
X2=0
0
0
1
0
s3
0
0
0
0
s3
0
0
1
0
X2=1
0
0
0
0
X2=1
0
0
0
1
s4
0
0
0
0
s4
0
0
0
1
The dynamics of the Boolean Inference Engine (BIE) are defined by two functions of transiand δ , where, δ corresponds to the phase of evaluation, selection, and tions δ corresponds to the execution phase and that all cells obedient in parallel to filtering, and δ the same rule, which is called the local transition function. :
- The transition function δ
ES, IS, SS, EA, IA, SA
- The transition function δ
δ
R ES , IA, SA
(3)
:
ES, IS, SS, EA, IA, SA
Where R
ES, IS, ES, EA
δ
ES
R EA , IS, SS, EA, IA, EA
is the transpose of the matrix of RE and EA is the negation of EA.
7
(4)
Dynamic knowledge mapping guided by data mining: Application on Healthcare
Launching the BIE automata in the width synchronous mode, where all candidate arcs have an incentive, to reach a summit si in forward chaining in following the steps below: - Search for applicable arcs (Evaluation and Selection) ; - Choose one of these arcs, for example (A) (Filtering) ; - Apply and add the conclusion part of A (arc) to the summit base (execution). The following table shows the forward chaining (root to leaf): Table 4. Forward Chaining according to the width synchronous mode Cycle
Set fact base evolution
1
{s0} {(X1=0), (X1=1), s1, s2}
Rules 1,2
2
{s0, (X1 =0), (X1=1), s1, s2)} {(X2=0), (X2=1), s3, s4}
3,4
Similarly we can launch the inference engine BIE, in forward chaining, depending on how, in either width or in depth. Using the Boolean principle, Table 5 below shows the overall status of the two layers, CELSUMMIT and CELARC, after evaluation, selection, and filtering according to the forward . chaining in the synchronous mode and the application of the first law of transition δ Table 5. Configuration obtained with the δsummit Summits
ES
IS
SS
Arcs
EA
IA
SA
s0
1
0
1
A1
1
1
1
X1=0
0
1
0
A2
0
1
1
s1
0
0
0
A3
0
1
1
X1=1
0
1
0
A4
0
1
1
s2
0
0
0
X2=0
0
1
0
s3
0
0
0
X2=1
0
1
0
s4
0
0
0
CELARC
CELSUMMIT
We consider G0 to be the initial configuration of the cellular automata (see the Table 2) and, ◦ δ to be the global transition function: Δ (G0) = G1. Δ= After the application of the second law of transition Δ we obtain the configurations G1 and at last configuration G2 (see the Tables 6 and 7).
8
Menaouer Brahami, Baghdad Atmani and Nada Matta Table 6. Configuration G1= Δ (G0) obtained with δ Summits
G
et δ
ES
IS
SS
Arcs
EA
IA
SA
s0
1
0
1
A1
1
1
0
X1=0
1
1
1
A2
1
1
0
s1
1
0
1
A3
0
1
1
X1=1
1
1
1
A4
0
1
1
s2
1
0
1
X2=0
0
1
0
s3
0
0
0
X2=1
0
1
0
s4
0
0
0
G
CELARC
CELSUMMIT
Table 7. The final configuration G2 obtained after two synchronous iterations ES
IS
SS
Arcs
EA
IA
SA
s0
Summits
1
0
1
A1
1
1
0
X1=0
1
1
1
A2
1
1
0
s1
1
0
1
A3
1
1
0
X1=1
1
1
1
A4
1
1
0
s2
1
0
1
X2=0
1
1
1
s3
1
0
1
X2=1
1
1
1
s4
1
0
1
CELARC
CELSUMMIT
To automatically produce conjunctive rules, the BOG module cooperates with the Boolean inand δ with the permuference engine (BIE) that uses the same transition functions δ tations of RE and RS of the graph, starting from the terminal node (s3 or s4) to the root s0. Thus, from our graph, we deduce tree rules that are of the form: “If Condition Then Conclusion”. The condition is a logical expression that is composed of a conjunction, which will be called the premise and the conclusion is the knowledge target in the summit. The three rules based on the model graph of induction in Fig. 4 are as shown below in Table 8. Table 8. Conjunctive rules produced Rule 1
if
(X1 = 1
and
X2= 0) Then
the knowledge of target is s3
Rule 2
if (X1 = 1
and
X2 = 1) Then
the knowledge of target is s4
Rule 3
if (X1 = 0) Then
the knowledge of target is s2
9
Dynamic knowledge mapping guided by data mining: Application on Healthcare
At the completion of this process, the module BV is ready to launch the validation phase using the same Boolean basic principle of the Boolean inference engine (BIE) and the same transiand δ . tion functions δ Finally, according to the results obtained, we note with the MBG that we can model and manage graphical models and/or a tree form. The objective is to reduce the storage capacity of the graph and the running time. This is due to the use of Boolean representation matrices, RE and RS, and δ . and to the Boolean operations that are used by the transition functions, δ
3.2 Boolean Modeling of critical knowledge mapping (PHASE I) Our project is registered under the context of the National Program of Research (NPR)1, which was launched in collaboration between the SEMEP health sector of Mostaganem and our research team SIF (Simulation, Integration, and Data mining) of the laboratory LIO (Computer Science Laboratory of Oran). Phase I (see Fig. 2) of our approach proceeds in the following two steps: a graphical representation of the knowledge map using the graphical model of the method MASK II [3, 21] and a second step of Boolean modeling mapping of critical knowledge domains (MB3C). 3.2.1 Realization of the mapping of domain knowledge Experience has demonstrated that the implementation of an effective knowledge management goes through the establishment of knowledge mapping. Thus, the knowledge mapping is a means of navigation (cognitive) to access the resources of a patrimony of knowledge in an organization, and to be implied or explicit. More so, the knowledge mapping allows having a fine understanding, by a criticality analysis, the domains of knowledge on where efforts should be made in terms of capitalization, sharing, or innovation [3]. Moreover, the field of knowledge mapping presents itself as an emerging research domains where there has been little work done that can be identified in literature and the work that has been done is not thorough. [21]. There are various approaches to organizing the cognitive resources of an enterprise or agency. However, we can distinguish two types of cartographic approaches. The first focuses on classification by process and on the classification by domains that organize the knowledge around the subjects, objects, or purposes of common interest that have been identified in the organization. The method of mapping critical knowledge, MASK II, is classified in the latest approach. The latter (MASK II) proposes in parallel to formalize the strategy and to identify strategic competencies and other items by achieving a criticality analysis of knowledge domains with the trades. The evaluation of the latter is elaborated on the basis of a library of the criteria or a grid CFK (Critical Knowledge Factor) that has been elaborated on by the Knowledge Management Club and tested in various contexts. The strategic alignment allows crossing the two points of view and for identifying strategic actions to improve the performance of the organization. To begin Boolean modeling, the map (see Fig. 5) was created to visually represent the domains critical knowledge (or different know-how critical trades) of the SEMEP in a synthetic and intelligible way. We recall, in this step, that the realization of the map was based on an analysis of references documents (organizational chart, description of the distributions of activity services, directory of staff activities, plan medium term of the vaccination, studies, balance sheet 1
The project is entitled « A Service Oriented Architecture for the Expanded Program on Vaccination», Code 12/u310/65.
10
Menaouer Brahami, Baghdad Atmani and Nada Matta
of vaccination, etc.) and interviews with business experts (doctors, health technicians, psychologists, midwives, etc.) and others who are responsible in the health sector. The adopted principle of knowledge mapping is to group the different activities’ knowledge domains, of them get in shape format via a representation vulnerable then the complete and validate the mapping produced with experts, in an iterative manner. These iterative validations allow having co-construction work. They also guarantee the maximum involvement and appropriation of the interviewees. The result is a map of knowledge domains or know-how map trades. This mapping is a description of a level of the meta-knowledge [42] of SEMEP know-how. It provides a system for being able to address know-how in order to facilitate access to knowledge domains. From this map, a study, thought, criticality was realized, which took into account the specificities of SEMEP service and expected project mapping. The criteria presented in the map are organized into 4 families (Difficulty to capture knowledge, Difficulty of usage of the knowledge, Rarity of the knowledge, and Utility of the knowledge) [22]. Each criterion is designed to be valued. For this to happen, we have established an evaluation scale for each criterion, based on the evaluation method that was developed by the Knowledge Management Club or on the Critical Knowledge Factors (CKF) [49, 7], and [21]. We recall that critical knowledge is knowledge that has value but is difficult to exploit. In our case it is for each knowledge domain (from interviews), to assess the risks and opportunities related to the availability, nature, utility for the SEMEP, and accessibility of know-how it covers. From [4, 22], the criticality of a knowledge domain is to assign a score from 0 to 4 in order to represent the degree of realization of the criterion of grid analysis for each domain2. The purpose of criticality analysis, which is viewed through the grid of criticality criteria, is to objectively determine which knowledge domains are the most critical for the future of the company and to recommend actions to prevent risks in these domains. More the domain is critical within the meaning the criterion evaluated, higher the note is high. Each evaluation of criterion rests on a synthesized question. When the respondent does not know the answer, a score of “0” is assigned. This note will not be taken into account during the analysis. A complementary analysis was conducted on the basis of combinations from the criterion and/or groups of criteria that were chosen in relation to the objectives of the criticality of the study. An interesting aspect of this analysis is that it allows bringing out some specifics (i.e., the niches of expert current/future domains to enhance the highly sensitive domains, etc.). A tool (i.e., Excel) was used for the restitution of these results in graphical form, especially for the radar chart (Kiviat diagram) format. The radar charts compare the values of criticalities of knowledge domains that have been aggregated into multiple data series that have been collected from different interviewees. The result is a map of areas of critical knowledge or a map of know-how/strategically critical trades (Fig. 5). This mapping is a description of the level of the meta- knowledge [43] of knowhow SEMEP. This mapping provides a system for the addressing of the know-how critical in order to facilitate sharing.
2
The analysis grid is that of the Club of Knowledge Management (http:// www.club-gc.asso.fr). She has twenty criteria grouped in four thematic areas: rarity, usefulness of knowledge, difficulty in capturing knowledge, difficulty of use of knowledge.
11
Dynamic knowledge mapping guided by data mining: Application on Healthcare
Fig. 5. Critical knowledge domains mapping of SEMEP
3.2.2 Boolean Modeling of critical knowledge mapping After getting the global critical knowledge domains epidemiological mapping of SEMEP, we conducted the Boolean modeling. In this context, we consider the graph shown in Fig. 6 extract from the critical knowledge domains mapping of SEMEP. Fig. 6 shows the axe psychology with its themes and domains by the system CARTOCEL [15].
Fig. 6. The knowledge map of School Health by CARTOCEL
Fig. 7 represents the obtained map using the partitions S0 (partition Core activity) = (s0), S1 (partition Axes) = (s1), S2 (partition Themes) = (s2, s3), S3 (partition Sub-themes) = (s4) S4 (partition Domains) = (s5, s6, s7, s8), S5 (partition Sub-domains) = (s9).
12
Menaouer Brahami, Baghdad Atmani and Nada Matta
Fig. 7. Illustration of the extract of the map with generation of partitions
After transformation of the knowledge domains mapping in a directed graph generated by partitions, nine (09) rules have been deduced using the BOG module in the form: « initial summit → final summit ». Table 9 describes the symbolic representation of the graph. Table 9. Symbolic representation of the partitions illustrated by Fig. 7 Initial summits
Attributes
Final summits
s0
Psychology
s1
s1
Screening
s2
s1
Consultation
s3
s3
Psychological tests
s4
s4
Psychomotor
s5
s4
Intelligence
s6
s4
Personality
s7
s7
Test of Beck
s9
We present in Table 10 how the knowledge base extracted from the precedent graph (Fig. 7) is represented by the layers CELSUMMIT and CELARC. Initially, all input in the layer of the cells for CELSUMMIT are passive (ES=0), except for the ones that represent the initial summit (ES (0) = 1).
13
Dynamic knowledge mapping guided by data mining: Application on Healthcare Table 10. Cellular representation of the knowledge base (the initial configuration G0) Summits / Values s0 s1 s2 s3 s4 s5 s6 s7 s9 axe=Psychology theme= Screening theme=Consultation sub-theme= Psycho tests domain= Personality domain =Intelligence domain =Psychomotor sub-domain = Test of Beck
ES IS SS 0 0 1 0 1 0 0 0 0 0 1 0 0 0 0 0 1 0 0 0 0 0 1 0 0 1 0 0 0 0 0 1 0 0 0 0 0 1 0 0 1 0 0 0 0 0 1 0 0 0 0 CELSUMMIT
Arcs A1 A2 A3 A4 A5 A6 A7 A8
EA 0 0 0 0 0 0 0 0
IA 1 1 1 1 1 1 1 1 CELARC
SA 1 1 1 1 1 1 1 1
The two incidence matrices ME input and MS output, which were developed in detail in [2], represent the relation of input/output summits and are used in forward and backward chaining (Table 11). Table 11. Input (ME) / Output (MS) incidence matrices MS (Output matrice)
ME (Input matrice)
A3
A4
A5
A6
s0
1
0
0
0
0
0
0
0
0
0
0
0
0
0
s1
0
1
1
0
0
0
0
1
0
0
0
0
0
0 0
A1 A2 A3 A4 A5 A6 A7
A1
A2
A7
s2
0
0
0
0
0
0
0
0
1
0
0
0
0
s3
0
0
0
1
0
0
0
0
0
1
0
0
0
0
s4
0
0
0
0
1
1
1
0
0
0
1
0
0
0
s5
0
0
0
0
0
0
0
0
0
0
0
1
0
0
s6
0
0
0
0
0
0
0
0
0
0
0
0
1
0
s7
0
0
0
0
0
0
0
0
0
0
0
0
0
1
s9
0
0
0
0
0
0
0
0
0
0
0
0
0
0
axe = Psychology
0
0
0
0
0
0
0
1
0
0
0
0
0
0
theme = Screening
0
0
0
0
0
0
0
0
1
0
0
0
0
0
theme = Consultation
0
0
0
0
0
0
0
0
0
1
0
0
0
0
sub-theme = Psycho tests
0
0
0
0
0
0
0
0
0
0
1
0
0
0
domain = Personality
0
0
0
0
0
0
0
0
0
0
0
0
0
1
domain = Intelligence
0
0
0
0
0
0
0
0
0
0
0
0
1
0
domain = Psychomotor
0
0
0
0
0
0
0
0
0
0
0
1
0
0
sub-domain = Test of Beck
0
0
0
0
0
0
0
0
0
0
0
0
0
0
14
Menaouer Brahami, Baghdad Atmani and Nada Matta
Table 12 below, shows forward chaining according to the synchronous mode width, using the same principle of the Boolean inference engine (BIE), where all arcs (axes, themes, sub-themes, domains, and sub-domains) of our candidates map are provoked. Table 12. Forward chaining according to the width synchronous mode Cycle
Set summits base evolution
Arcs
1
{s0} {(axe=psychology), s1}
2
{s0, (axe = psychology), s1)} {(theme=Screening), (theme=Consultation), s2, s3}
3
{s0, (axe=Psychology), (theme=Screening), (theme=consultation), s1 , s2, s3} {(sub-theme= psychological tests),s4}
4
{s0, (axe=Psychology), (theme=Screening), (theme=Consultation), (subtheme=Psychological tests), s1 , s2, s3 , s4} {(domain=Psychomotor),(domain= Intelligence), (domain=Personality), s5 , s6 , s7}
5,6 and 7
5
{s0, (axe=Psychology), (theme=Screening), (theme=Consultation), (sub-theme =Psychological tests), (domain=Psychomotor), (domain=Intelligence),(domain =Personality),s1 , s2, s3 , s4, s5 , s6 , s7} {(sub-domain = Tests of Beck),s9}
8
1 2 and 3 4
We consider the initial configuration of the cellular automata (see Table 10) and, ◦ δ the global transition function: Δ (G0) = G1. After the application configura∆= δ tions we obtain G1, G2…G5. In the following (Table 13) we present the final configuration G5: values Table 13. Final G5 configuration obtained after four synchronous iterations ES
IS
SS
Arcs
EA
IA
SA
s0
Summits / Value
1
0
1
A1
1
1
0
s1
1
1
1
A2
1
1
0
s2
1
0
1
A3
1
1
0
s3
1
1
1
A4
1
1
0
s4
1
0
1
A5
1
1
0
s5
1
1
1
A6
1
1
0
s6
1
0
1
A7
1
1
0
s7
1
1
1
A8
1
1
0
s9
1
1
1
axe=Psychology
1
0
1
theme=Screening
1
1
1
theme=Consultation
1
0
1
sub-theme= Psycho tests
1
1
1
domain= Personality
1
1
1
domain =Intelligence
1
0
1
domain =Psychomotor
1
1
1
sub-domain = Test of Beck
1
0
1
CELSUMMIT
15
CELARC
Dynamic knowledge mapping guided by data mining: Application on Healthcare
Thus, we can, by modeling the MBG, make inferences in backward chaining to go from the sub-domains to the axes and the core activity. To do so, you must simply switch between ME and MS in the transition functions. Moreover, we can deduce five mapping rules that are of the form of, “if Condition then Conclusion,” by using the BOG module (in cooperation with the BIE), from the axe (psychology). Condition is a logical expression that is composed of conjunctions, which will be called the premise and conclusion of the knowledge domain, with their degree of criticality (§ Section 3.3.1) in the fact described by the conclusion. (As an example for the conclusion of Rule 4 is, “the target knowledge domain s9=Test of Beck to a criticality C-s9” and “the criteria of criticality = difficulty to capture knowledge”) (see Table 14). Table 14. The rules for critical knowledge mapping MAP RULE 1
if (Axe = Psychology) and (Theme = Screening) then (Knowledge domain s2) and (degree of criticality C-s2) and (the criteria of criticality = Rarity).
MAP RULE 2
if (Axe = Psychology) and (Theme = Consultation) and (sub-theme = Psychological tests) and (Domain = Psychomotor) then (Knowledge domain s5) and (degree of criticality Cs5) and (the criteria of criticality = Utility).
MAP RULE 3
if (Axe = Psychology) and (Theme = Consultation) and (Domain = Taken in contact) then (Knowledge domain s8) and (degree of criticality C-s8) and (the criteria of criticality = difficulty of usage knowledge).
MAP RULE 4
if (axe = psychology) and (theme = consultation) and (sub-theme = psychological tests) and (domain = personality) and (sub-domain = test of beck) then (knowledge domain s9) and (degree of criticality c-s9) and (the criteria of criticality = difficulty to capture knowledge
MAP RULE 5
if (Axe = Psychology) and (Theme = Consultation) and (sub-theme = Psychological tests) and (Domain = Intelligence) then (Knowledge domain s6) and (degree of criticality C-s6) and (the criteria of criticality = difficulty of usage knowledge).
4. TOWARDS MAPPING THAT IS GUIDED BY DATA MINING (PHASE II) The mapping process is guided by machine artificial learning (Phase II [see Fig. 2] of the project). It proceeds in the following two steps: data mining and automatic mapping. Data mining consists of initially launching the symbolic induction from case studies using CASI [2]. The mapping rules obtained are used to automatically improve the Boolean model of knowledge mapping in Section 3.3.1. The problem of Knowledge Discovery in Databases (KDD) uses the principles of machine learning and the methods of inductive or deductive supervised learning. Among the inductive methods, we were interested in decision trees, especially those that are based on induction graphs, because the classification function is expressed by a graph that can be transformed in the form of production rules. Automatic learning is certainly, in terms of artificial intelligence, the scope of application the most fertile of recent years. It is generally known that the prerogative of artificial intelligence is to learn from past experience so that its behavior becomes adaptable. The machine learning is thus the field of study where one tries to reproduce human capacity to be learned. The pioneers
16
Menaouer Brahami, Baghdad Atmani and Nada Matta
of machine learning should be viewed as a set of changes in a system that allows it to accomplish the same task the best, or a similar task in the same population in the future. Rakotomalala [45] confirms that Dietterich proposed a more functional approach to machine learning that allows evaluate by linking it to the notion of knowledge. Dietterich distinguishes three levels of description for a learning system, as listed below: - A system that doesn’t receive input and that performs the task the best; - A system that receives an input of knowledge, but doesn’t perform induction; - And finally, a system that receives inputs and extracts knowledge that is either known implicitly or explicitly is inductive learning. It is the latter that interests us in our study, specifically; we are interested in empirical learning, which is aimed at generating new knowledge from case studies (examples, observations, etc.) that have been baptized (symbolic induction by machine learning). For [37], inductive learning extracts a model from a set of examples of cases that have been resolved by domain experts. From this set, which is called the learning set, we generate a model that is used to study new examples in the same domain. Each example (object) of this set is represented by a vector of attributes and each attribute is a set of values. Indeed, the data we used are the sheets of the psychologist’s SEMEP. In addition, they are very diverse and are not necessarily all usable by the data mining techniques. Most techniques that are used, deal only with the tables of data in traditional rows/columns. The objective is to prepare the tables rows/columns. In other words, to prepare the individual tables/variables that is obtained by the steps shown in Fig. 8.
Fig. 8. The process of extracting knowledge from the psychological cards (Personality Test)
4.1 Preprocessing Preprocessing is a key preliminary step in the process of knowledge discovery in databases (KDD). The results that are generated at the end of this phase depend in large part on the quality of data that is used. The preprocessing steps include access to data in order to construct two-dimensional tables, which are called table individual variables. These include observations (explicit data). Based on
17
Dynamic knowledge mapping guided by data mining: Application on Healthcare
the type of data (e.g., numeric, symbolic), methods of preprocessing format the data, clean, handle missing data, and select the attributes or observations (individuals) when there are too many of the following: choice of attributes that are most informative in the first case and samplings in the second case. This phase is important because it is the one that will determine the quality of the models developed in data mining. Indeed, these choices are intended to bring out the information contained within this mass of data [52]. - Selection of data: in our case and in order to supplement, refine, and accelerate the mapping process we searched the records of psychologists services (School Health) to collect case studies of students in all levels (middle, secondary). After selecting and cleaning the sheets considered relevant we looked at records of psychological tests that students have met, especially the personality tests (the Beck Test or the Beck Depression Inventory [BDI-II]). - The discretization of data: this is therefore to find a compromise, and from among the data reduction strategies we use the discretization that transforms continuous attributes by cutting the field of values of these attributes into intervals in order to obtain qualitative attributes. Indeed, there are many methods for the purpose of discretization that we can mention. These include the quintiles discretization and discretization as nested averages or that have been standardized according to the discretization, etc. In our case and to complete this step we had to understand the principle of the tests (the psychological tests [personality test- Beck-II]) [10] and extract the variables (attributes) in order to launch the qualitative phase data mining and generation of knowledge.
4.2 Data mining by decision tree Data mining, which is the heart of the process of KDD, is the analysis of observations of a data set in order to not identify the suspected relations and to summarize the knowledge included in this data in new forms that is both comprehensible and useful to experts [25, 30, 53, 29]. KDD, by means of data mining, is then seen as engineering knowledge discovery in data. Data mining principally uses the disciplines of artificial intelligence, statistics, and data analysis [53, 29]. It is usually done on two-dimensional tables and essentially decomposes into three major families of methods: descriptive, explanatory, and structuring. The objective of the implementation of data mining techniques is to obtain operational knowledge. This knowledge is expressed in terms of models of varying complexity, which are a series of coefficients for a forecast model and the type of logical rules for the “If Condition then Conclusion” or graphs. For these models to acquire a status of knowledge, they must be validated. Then a series of operations (post-processing steps), which are used to validate the models to make them intelligible if they are to be used by humans or if they are to be formalized by being automatically processed by a machine, need to be implemented. Beyond statistical validation, the intelligibility of the models is often a criterion for their survival [19, 30]. 4.2.1 Construction of a decision tree and the generation of rules In the literature, decision trees are among the classification techniques of data mining that are the most popular and that are the fastest and easiest to use. According to [52], decision trees are learning tools that produce rules such as the “if Condition then Conclusion” in which condition
18
Menaouer Brahami, Baghdad Atmani and Nada Matta
means a disjunction of conjunctions of logical propositions of a type of attribute or value [53]. The set of rules is thus the prediction model. They use a set of individuals (n-uplets) as input that is described by variables (attributes). Each individual belongs to a class, with the classes being mutually exclusive [54]. The construction method of decision trees consists of a segmentation of the learning population in order to obtain groups in which the class size is maximized. This segmentation is then reapplied recursively on the partitions that have been obtained. The search for the best partition for the segmentation of a node returns to find the most discriminating variable for the classes. Thus the tree (or more commonly, the graph) is made. Finally, decision rules are obtained by following the paths from the root of the tree (the entire population) to its leaves. To illustrate this notation, consider the problem of psychological tests, in particular the personality tests (BDI-II). Table 15 shows our learning sample of 14 patients (students in primary schools). Each example or patient is described by four descriptive variables (Tristesse, Suicide, Crying, and Devalorization), in statistics called exogenous variables, and is associated with a particular attribute (depression). Table 15. Example of learning sample -patients X1
X2
X3
X4
X5
Ωα
Tristesse
Suicide
Crying
Devalorization
Depression
1
yes
yes
yes
yes
severe
2
no
yes
yes
yes
lightweight
3
no
no
no
yes
lightweight lightweight
4
no
yes
no
yes
5
yes
can be
no
yes
severe
6
no
yes
yes
no
severe
7
yes
yes
no
no
severe
8
yes
no
yes
no
severe
9
no
yes
no
no
severe
10
no
no
yes
can be
lightweight
11
no
yes
yes
can be
lightweight
12
yes
yes
no
can be
severe
13
no
yes
no
can be
severe
14
no
yes
no
can be
severe
In the table shown below, we have summarized an example of exogenous variables out of our learning samples. The value taken by Xj (w) is called the term or value of the variable Xj for each individual (patient). We use Lj to denote the number of different modalities assigned to the variable Xj.
19
Dynamic knowledge mapping guided by data mining: Application on Healthcare Table 16. Exogenous variables, significations, and values Variables and (lj)
Signification
Values
X1(l1=2)
tristesse
yes ; no
X2(l2=3)
suicide
yes ; no ; can be
X3(l3=2)
crying
yes ; no
X4(l4=3)
devalorization
yes ; no ; can be
X5(l5=2)
depression
severe ; lightweight
In this case, the patient population that is affected by the problem of learning is a set of tuples consisting of the four-predictor variables of, X1, X2, X3, and X4, and their classes (severe and lightweight). From these examples, we construct a tree decision as: - Each node corresponds to a test of the value Xj (w) of an attribute Xj, in which lj has the possible values of: x , … , x
;
- Each branch leaving a node corresponds to a value of
x
for the test on xj with v=1,...,lj ;
- Each leaf is associated with the ck value of the target attribute Y. Suppose our learning sample is composed of 14 patients. The initial partition (s0) has a single element that is denoted as s0, which includes all of the learning samples with nine (9) individuals (patients) belonging to the class of severe and five (5) belonging to the class lightweight. For the construction of the decision tree, we used the ID3 algorithm method [42]. ID3 (Inductive Decision Tree) is a heuristic tree that is used to construct a decision tree. Its principal consists in generating a succession of partitions by splitting nodes of the tree. Its objective is to optimize a criterion of information gain. From the sample of the learning method, ID3 is symbolic processing that begins the construction of the decision tree [52, 44]: - Choose the measurement uncertainty (Shannon or quadratic) ; - Initialize the parameters of gain, info, and the initial partition S0; - Apply the method ID3 to pass the partition St to St+1 and to generate the decision tree; - Finally, generate the prediction rules. Starting from the root of the tree (Fig. 9) the partition S1= {s1, s2} is generated by the variable X1 with: - s1 = {ω ∈ Ωα |X1 (ω) = yes} ; - s2 = {ω ∈ Ωα |X1 (ω) = no} ; Just as with the node s0, we distinguish s1 and s2 into the individual classes of 1 and 2 of the partition S1. The process is then reiterated in search of partition S2, which would be better according to the chosen gain (see Fig. 9). Thus, the decision tree can be then exploited to extract the classification rules concerning our target attribute (depression).
20
Menaouer Brahami, Baghdad Atmani and Nada Matta
Fig. 9. Decision tree obtained by ID3 on the example (Test by Beck)
Finally, we exploited the tree before (Fig. 10) to extract five rules R1, R2 … and R5 of the psychological inductions (personality tests [Beck II]) also on the target attribute (depression). Useful and critical knowledge have not been explicit before and are of the form: if Condition then Conclusion. Where condition is a logical expression that is composed of summits that will be called the premise. And the conclusion is the majority class in the summits described by the condition. - If (tristesse = yes) then severe. - If (tristesse = no and devalorisation = no) then severe. - If (tristesse = no and devalorization = yes) then lightweight. - If (tristesse = no and crying = yes and devalorization = can be) then lightweight. - If (tristesse = no and crying = no and devalorization = can be) then severe.
4.3 Exploitation of the rules of induction In this section, we launch the validation phase across the BV module (Boolean validation) on the psychological induction rules (personality tests [Beck-II]) presented in the previous section, by using the same Boolean basic principle from the Boolean inference engine (BIE), and the same transition functions δfact and δrule. Table 17 shows how the Boolean knowledge base was extracted starting from the psychological induction rules (personality tests [Beck-II]) and how it is modeled on the layers CELFACT and CELRULE with the same principles of CELSUMMIT and CELARC (§ 3.3.1). Note that in this step, the two incidence matrices of input (RE) and output (RS) are generated as shown in Table 18.
21
Dynamic knowledge mapping guided by data mining: Application on Healthcare Table 17. The initial configuration of CELFACT and CELRULE EF
IF
SF
Rules
ER
IR
SR
Tristesse = yes
Facts
0
1
0
R1
0
1
1
Tristesse = no and devalorization= no
0
1
0
R2
0
1
1
Tristesse = no and devalorization = yes
0
1
0
R3
0
1
1
Tristesse = no and crying = yes and devalorization = can be
0
1
0
R4
0
1
1
Tristesse = no and crying = no and devalorization = can be
0
1
0
R5
0
1
1
Severe
0
1
0
Lightweight
0
1
0
CELRULE
CELFACT
Table 18. Input/output of the incidence matrices RE / RS
R1 R2 R3 R4 R5
R1 R2 R3 R4 R5
Tristesse = yes
1
0
0
0
0
0
0
0
0
0
Tristesse = no and devalorization = no
0
1
0
0
1
0
0
0
0
0
Tristesse = no and devalorization = yes
0
0
1
0
0
0
0
0
0
0
Tristesse = no and crying = yes and devalorization = can be
0
0
0
1
0
0
0
0
0
0
Tristesse = no and crying = no and devalorization = can be
0
0
0
0
1
0
0
0
0
0
Severe
0
0
0
0
0
1
1
0
0
1
Lightweight
0
0
0
0
0
0
0
1
1
0
By employing the same basic principle of the Boolean inference engine for the experimentation phase we used the platform WS4KDM [35] for extraction and the Boolean modeling for determining the rules of psychological prediction. The objective is the automatic improvement of the Boolean model of knowledge mapping critical epidemiological (§ 3.3.1) guided by data mining WS4KDM3 takes as its input the learning sample as a table of individuals/variables in order to supply a basis of classification rules during output, by applying the principle Boolean of the cell machine. The result of the cartography of knowledge domains of SEMEP obtained by CARTOCEL [16] is illustrated in Fig. 10.
3
Research team « Simulation, Integration and Data Mining», Computer Science Laboratory of Oran (LIO).
22
Menaouer Brahami, Baghdad Atmani and Nada Matta
Fig. 10. Domains knowledge mapping of SEMEP as refined by a process of inducing rules the Beck test
5. RESULTS AND DISCUSSION Several methods of capitalization, operation, and enrichment [20] have been proposed in the literature on knowledge management. Among these methods, the MASK method should be mentioned. According to [21], MASK is defined as a task of observing and mastering a knowledge system in its totality and in its complexity. It also benefits from various documentary sources, observation analysis, and experience feedback that should all be continually refined and enriched. However, MASK encounters limitations because it is not possible to set up MASK on more than a limited domain of knowledge patrimony of the company. This method is thus concerned with past practices or procedures. It does not allow for the formalizing of data and information in real time. Moreover, MASK essentially provides a tool for aiding in decisions, but it does not allow for conducting an automatic search, in the knowledge map, for having the rules of mapping decisional. From this perspective we proposed a new approach called, MB3C, which articulates the foundations of knowledge engineering that encapsulates the model MASK II (Method of Mapping Knowledge Critical)4 and knowledge discovery in data (KDD). We present, in the following, our results of the experimentations by the comparison of the proposed approach towards the knowledge mapping methods by domain and in particular the MASK II method. This latter (MASK II) provides a visual representation and synthetic (in map form) critical knowledge areas (characterized by the critical know-how trades) rather than in a conventional manner and static by the set of Mind Maps tools.. 4
The work undertaken by the Working Group of the Club of Knowledge Management (http://www.club-gc.asso.fr) on the method of critical knowledge mapping: MASK II.
23
Dynamic knowledge mapping guided by data mining: Application on Healthcare
For this, we have proposed a new approach, which in the first place allows for a Boolean modeling of mapping critical knowledge (MASK II). Then, we exploited the different sources of data by data mining techniques to improve, in an automatic manner, the mapping of critical knowledge. For the implementation of Boolean modeling of knowledge mapping we developed the system, CARTOCEL, which has the advantage of automatically and dynamically providing the navigation and the interaction between the Boolean module and the graphics module. The visual representation of CARTOCEL was made by respecting the principle of mind maps, which was invented by Tony Buzan [11], and the principle of the method of the mapping of critical knowledge (MASK II). The principal functionalities of the CARTOCEL system are: - Conception manual and/or charging of the mapping of domains of knowledge; - Saving, after updating, the map as from the graphics module; - Initialization and management of Boolean knowledge mapping (Boolean modeling layers of a graph); - Automatic updating of the map guided by data mining. Moreover, we find that the Boolean modeling of knowledge mapping in the CARTOCEL system to be one of our strong interests. It resides in the possibility of transforming the map into a set of rules, called mapping rules, by translating the set of paths leading from the root (heart of a business) at each leaf (axes, themes, and domains of knowledge). All of which contributes to organizational learning and can ensure a better exploitation of domains of knowledge by experts, since it shall make available the know-how of actors trades (doctors, psychologists, midwives) with the ability to improve practices in work situations. When it is used frequently, this contribution can support the intelligence of visual representation. As we stated earlier (Section 6), we are also interested in empirical learning, which aims to generate new knowledge from practical cases (observations) that are known to neither implicitly nor explicitly, in order to facilitate the work of the expert and that meet the needs of an organization. For the experimental phase we used the psychologists’ evaluation sheets from the SEMEP service. Through the evaluation, educational psychologists will be able to issue recommendations, which may serve the basis for follow-up strategies, intervention, or orientation towards other professionals in education or health. In addition, the latter are highly diverse and are not necessarily valorized by the data mining techniques. We are interested in the scale of BDI-II (Beck Depression Inventory 2nd Edition Scale)5 to evaluate the depression of the students attending schools. The latter (BDI-II) is a self-evaluation questionnaire that is designed to measure the depression severity. It contains 21 elements (items) describing many of the symptoms of depression. Each of its items are presented in the form of four propositions whose subject must make a choice from among them, while choosing the statement that best describes his or her state of mind during the last 2 weeks. For the French version Beck proposes the following categories:
5
BDI (Beck Depression Inventory) was published for the first time in 1961 by psychiatrist Aaron T. Beck (Beck et al., 1979) and revised in 1996 (BDI-II) to account for the inclusion of current diagnostic criteria for depression (Beck et al., 1996).
24
Menaouer Brahami, Baghdad Atmani and Nada Matta
- 0 to 3: no depression - 4 to 7: light depression - 8 to 15: depression a mean intensity to moderate - 16 and higher: severe depression From a practical point of view we constructed, as a first step, a new questionnaire, which is composed of four items. We did so in collaboration with the school psychologists of SEMEP and with the fundamental schools. We retained the following categories: 1 (tristesse), 9 (thoughts or desires to commit suicide), 10 (crying), and 14 (devalorization), in order to measure the depressed state of the students from schools. In Phase II, and to refine the Boolean mapping of the critical psychological knowledge (Section 3.3.1), we conducted an experimental study using the platform WS4KDM for extracting and modeling the Boolean rules of predicting psychological. WS4KDM takes in the input of the learning sample (psychological sheets-Test BDI-II) in a table format showing the individuals/variables and it outputs a base of Boolean production rules by applying the principle of the cell machine CASI (see Fig. 11).
Fig. 11. Boolean exploitation of the rules extracted by the platform WS4KDM
Our objective, through using the CARTOCEL system, is to bring about a mapping of knowledge domains of SEMEP that have been refined by the classification rules that were extracted using case studies (BDI-II Test) in an automatic way. The experimental results improved the construction of the knowledge map by proposing a new process of knowledge mapping that is guided by data mining. The advantages of our approach, which is based on the principle of Boolean modeling to render mapping of critical knowledge that is more flexible and scalable may be recapitulated as follows: - The representation of knowledge well as its control are simples, as they are in the form of binary matrices and require the minimum amount of preprocessing. - The facilities of the implementation transition functions are complex, efficient, and robust concerning of extreme values. Moreover, they are well suited with situations that have
25
Dynamic knowledge mapping guided by data mining: Application on Healthcare
many attributes. - The results of the mapping are simple for being reorganized and used by and for the data mining process. - The mapping system is a cellular model that is composed of a simple set of transition functions and production rules, which allow not only of describing the current problem but also always be established a classification function for forecasting. - The incidence matrix, RE, facilitates the transformation of links between partitions in expressions of the Boolean equivalent, which allows us to use Boolean elementary algebra to examine other simplifications.
6. CONCLUSIONS Knowledge management has aimed at the explicitation of useful knowledge from the different sources and his representation in several forms. Moreover, we recorded and we are convinced of the interest of applying the techniques of data mining on several types of information that is stored in various types of electronic media (databases, various files, etc.) to improve the extraction process and knowledge management and, in particular in applying the explicitation techniques of tacit knowledge, which in our case is the mapping of critical knowledge domains. Our objective is to propose a new intelligent approach to critical knowledge mapping domains that are guided by artificial learning, which proceeds in the following three steps: the mapping of critical knowledge domains is based upon the graphical model of the MASK II method; Boolean modeling of the graphical representation of the knowledge map; and finally, the third step, which consists of improving the Boolean map by a process of extracting information from data. Data mining consists of launching into the first step of Boolean induction for starting practical cases. This is done by applying the Boolean principle of the machine cellular CASI. The mapping rules obtained are used to automatically improve the Boolean model of the mapping of critical knowledge domains. For this, the competing motivations have leaded us to propose the principle of Boolean modeling for the generation, optimization, representation, and the use of a Boolean mapping of critical knowledge domains. Indeed, we have not only did we want to have a mapping of optimal critical knowledge domains, but we also wanted to find a way to improve the construction and visualization of this mapping by the new approach to critical knowledge mapping domains as guided by data mining (MB3C). A process of the automatic learning symbolic graph-based induction perfects the Boolean model of the critical knowledge mapping domains that are obtained. This improvement is made by the CASI cellular automaton that assists the ID3 method in the process of extracting new knowledge starting from past experiences (in the form a practical case). Finally, critical knowledge mapping domains that are guided by data mining have interesting properties and numerous advantages over other techniques of knowledge explicitation. This new principle of mapping the knowledge domains forms a very satisfactory tool for formalization (the creation of new knowledge), representation, and the visualization of knowledge domains by adopting a Boolean modeling, which ensures, thereafter, a contribution in the general process of the creation, transfer, and reuse of knowledge (tacit or explicit).
26
Menaouer Brahami, Baghdad Atmani and Nada Matta
The results of our work offer many perspectives for further research at both the theoretical and practical level. - We applied approach to large masses of heterogeneous data and hyper-documents (text, web) in order to reach the effective exploitation of this approach and validate its performance. - We contributed to visual data mining by proposing a new approach to decisional knowledge mapping. - We extended our work to other psychological tests and other knowledge domains of the SEMEP service. - We improved the CARTOCEL system by integrating advanced techniques of computing as well collaborating more extensively with the community of SEMEP services and epidemiological researchers.
REFERENCES [1] [2] [3] [4] [5]
[6] [7] [8] [9] [10]
[11] [12]
[13] [14] [15] [16]
A. Barroso, R. Ricciardi, “Knowledge domains cartography of the radio pharmacy center of IPEN – a case study”, Nuclear and Energy Research Institute (IPEN). Brazil, 2003. A. Godbout, Mapping knowledge, the foundation of knowledge organization. Article of Godbout, Martin Godbout & Associates, 1999. A. Pachulski, M. Grundstein and C. Rosenthal-Sabroux, “GAMETH: A Methodology Aimed to Locate the Company’s Crucial Knowledge”. ECKM’00, October 26-27-2000, Bled (Slovenia). A. T. Beck, G. Borown, R. A. Steer, “Beck Depression Inventory II manual”, San Antonio, TX: The Psychological Corporation, 1996. B. Atmani, and B. Beldjilali, “Neuro-IG Neuro-IG: A Hybrid System for Selection and Elimination of Predictor Variables and non-Relevant Individuals”, Informatica, Vol.18, Issue 2 (April 2007), ISSN: 0868-4952, 2007a, pp.163-186. B. Atmani, and B. Beldjilali, “Knowledge Discovery in Database: Induction Graph and Cellular Automaton”, Computing and Informatics Journal, Vol.26, No.2 (2007), 2007b, pp.171-197. D. Hand, H. Mannila and P. Smyth, Principles of Data Mining, MIT Press, 2001. D.A. Zighed, J.P. Auray and G. Duru, SIPINA : Méthode et logiciel, Lacassagne, 1992. D.A. Zighed, R. Rakotomalala, Graphs of induction, Training and Data Mining, Hermes Science Publication (Edition Hermès Sciences), 2000, pp.21-23. E. Blanchard, M. Hazallah, H. Brinad, “Reasoning in competence management”, Workshop: Extraction and Knowledge Management- EGC 2005, Vol.II, cépaduès-editions, ISBN : 2.85428.677.4, p.587 F. Jalabert, Cartographie des connaissances: l’intégration et la visualisation au service de la biologie, Doctoral thesis at the University of Montpellier, specialty : structures and systems, 2007. G. Aubertin, I. Boughzala, J.L. Ermine, “Cartographie des connaissances critiques (Mapping of critical knowledge)”, Revue des Sciences et Technologies de l’Information, Série RIA-ECA, Hermès – Lavoisier, Vol.17, No.1-2-3, Paris, 2003, pp.495-502. G. Aubertin, “Knowledge mapping: a strategic entry point to knowledge management”. Trends in Enterprise Knowledge Management, ISTE, Londres, 2006. G. Aubertin, Cartographier les connaissances critiques: une démarche stratégique pour l'entreprise, Management des connaissances en entreprise. Lavoisier, Hermès Science, Paris, 2007, pp.125-144. G. Balmisse, “Gestion des connaissances. Outils et applications du knowledge management”, Edition Vuibert (France), 2005, ISSN : 1628-5360. I. Boughzala, J.L. Ermine , Management des connaissances en entreprise, Collection technique et scientifique des télécommunications, Hermès, 2004.
27
Dynamic knowledge mapping guided by data mining: Application on Healthcare [17] I. Nonaka, H. Takeuchi, The Knowledge-Creating Company, Oxford University Press, Oxford, New York, 1995. [18] I. Saad, M. Grundstein and C. Rosenthal-Sabroux, “Locating the Company’s Crucial knowledge to Specify Corporate Memory: A Case Study in an Automotive Company”, Workshop Knowledge Management and Organizational Memory, IJCAI’2003, International Joint Conference on Artificial Intelligence, August 9-16-2003. [19] I.H. Witten, E. Frank, Data Mining: Practical Machine Learning Tools and Techniques. Second Edition, 2005. Morgan Kaufmann. [20] J.L. Chabot, Transfert de savoir en HYDRO-QUEBEC perspective et stratégie. Colloque annuel de CERFIO, Atelier No.3, 2006. [21] J.L. Ermine, I. Boughzala, T. Tounkara, “Critical Knowledge Map as a Decision Tool for Knowledge Transfer Actions”, The Electronic Journal of Knowledge Management, Vol.4, Issue 2, 2006, Available online : http://www.ejkm.com, pp.129-140 [22] J.L. Ermine, “A Theoretical and formal for Knowledge Management Systems”, dans D. Remenyi, 2nd International Conference on Intellectual Capital and Knowledge Management (ICICKM’2005), Dubia, United Arab Emirates (U.A.E), 2005, pp.187-199. [23] J.L. Ermine, I. Boughzala, “Using Cartography to Sustain Inter-Generation Knowledge Transfer: The M3C Methodology”. In 2nd International Conference on Intellectual Management, Knowledge Management and Organizational Learning. American University in Dubai. United Arab Emirates, ISBN: 1- 905305-14-1, 2005, pp.175-186. [24] J.L. Ermine, Introduction au Knowledge Management, Management des connaissances en entreprise. Lavoisier, Hermes Science: 2007, Paris, pp.23-45. [25] J. Han, M. Kamber, Data Mining : Concepts and Techniques, The Morgan Kaufmann Series in Data Management Systems, University of Illinois at Urbana-Champaign (Canada), 2nd Edition, Elsevier, 2006, ISBN : 10: 1-55860-901-6, Available online : http://www.cs.uiuc.edu/~hanj/bk2/ [26] J. Pomian, C. Roche, Connaissance Capitale : Management des connaissances et organisation du travail, L’Harmattan, 2002, Paris. [27] J.Y. Prax, Le manuel du Knowledge Management, An approach of 2nd generation, Edition: Dunod, Paris, 2007, pp.219-230. [28] J. R. Quinlan, “Induction of decision trees”, Machine Learning, Vol.1: Issue 1, 1986, pp.8-106. [29] J. R. Quinlan, “Unknown attribute values in induction”, In International Machine Learning Workshop Cornell, New York, USA, 1987. [30] Le Khac. Nhien An, M. A. Lamine “Distributed Knowledge Map for Mining Data on Grid Platforms”, IJCSNS International Journal of Computer Science and Network Security, Vol.7, No.10, October 2007, pp.98-107. [31] M. Authier, P. Lévy, “Les arbres de connaissances”, La Découverte, Paris, 1992. [32] M. Brahami, and B. Atmani, “Vers une cartographie des connaissances guide par la fouille des données : 1ère étape modélisation booléenne”. 2ème Conférence Francophone GECSO’09, Revue électronique ISDM, ISDM No.36, 2009a. [33] M. Brahami, and B. Atmani, “Vers une cartographie des connaissances guidée par la fouille des données”. 2ème Conférence Internationale CIIA’09, Université de Saida, Algérie, Publier dans http://CEUR-WS.org, ISSN: 1613-0073, 2009b. [34] M. Brahami, and B. Atmani, “Vers une fouille visuelle des données par automate cellulaire : application à la cartographie des connaissances critiques”. Atelier « Apprentissage et Visualisation » dans le cadre de plateforme AFIA’09, Yasmine Hammamet, Tunisie, 25 mai 2009, 2009c. [35] M. Brahami, B. Atmani, and M. Mokaddem, “CARTOCEL : Un outil de cartographie des connaissances guidée par la machine cellulaire CASI”, In 10ème Conférence Internationale Francophone sur l’Extraction et Gestion des Connaissances, EGC’2010, RNTI (E-19), Edition Cépaduès, ISSN : 1764.1667. [36] M. Grundstein, “From capitalizing on company knowledge to knowledge management”, Knowledge Management: Classic and Contemporary Works M. Press, Daryl Morey, Mark Maybury and Bhavani Thuraisingham, 2000, p.451.
28
Menaouer Brahami, Baghdad Atmani and Nada Matta [37] M. Jelena and I. Beleviciute, “Data mining for knowledge management in technology enhanced learning”, Proceedings of the 6th conference on Applications of electrical engineering, Istanbul, Turkey, pp.115-119. [38] N. Matta, M. Ribiere, O. Corby, M. Lewkowicz, and M. Zacklad, «Project Memory in Design», Industrial Knowledge Management-A Micro Level Approach, Rajkumar Roy (Eds), Springer-Verlag, 2000. [39] N. Matta, and J.L. Ermine, «knowledge capitalization with a knowledge engineering approach : the MASK method», IJCAT’2001, knowledge management and organizational memory workshop. International Joint Conference on Artificial Intelligence, seattle, Etats-Unis, 4-10 août 2001. [40] P.H. Speel, N. Shadbolt, W. De Vies and P.H. Van Dam, O’hara K, “Knowledge Mapping for industrial purpose”, Conference KAW’99, Banff, Canada, 1999. [41] P. Van Berten, J.L. Ermine, “Applied Knowledge Management: a set of well-tried tools”. The Journal of Information and Knowledge Management Systems, Vol.36, 4, 2006, pp.423-431. [42] R. Dieng-Kuntz, Capitalisation des connaissances via un web sémantique d'entreprise, Management des connaissances en entreprise. Lavoisier, Hermès Science, Paris, 2007, pp.255-272. [43] R. Rakotomalala, Induction Graphs, Thesis for the obtaining of the Diploma PhD, University of Claude Bernard-Lyon 1, 1997, France. [44] R.I. Ricciardi, A.C.O. Barroso and J.L. Ermine, “Knowledge Evaluation for knowledge management Implementation – the Case Study of the Radio-pharmaceutical Centre of IPEN”, International Journal of Nuclear Knowledge Management, Vol.2, No.1, 2006, pp.64-75. [45] S. Bekhti, and N. Matta, “A Formal Approach to Model and Reuse the Project Memory”, Journal of Universal Computer Science. Proceedings of I-Know '01, International Conference on Knowledge Management, edited by K. Tochtermann and H. Maurer, July 2003, Springer. [46] T. Buzan, “A head well done-Use you intellectual resources”, Editor: Organisation Eds, Novembre 2011, and ISBN: 2212552149, pp.1-186. [47] T. Isckia., T. Tounkara, “Community of Practice and Organizational Design”, Global conference on Emergent Business Phenomena in the Digital Economy (ICEB + eBRF), November 28-December 22006, Tampere Hall-Tampere, Finland. [48] T. Mitchell, Machine Learning. McGraw-Hill, 1997. [49] T. Tounkara, J.L. Ermine, Méthode de cartographie pour l’alignement stratégique de la gestion des connaissances, Chapitre 4 dans ERMINE J.L. (2008). Management et Ingénierie des connaissances : modèles et méthodes, Collection IC2 (Information, Commande, Communication), Série : management et Gestion des STIC, Edition Hermès – Lavoisier, 2008. [50] T. Tounkara., I. Boughzala and T. Tounkara, “M3C: A Methodology of Mapping Knowledge critical in the company”, IBIMA’2005, Cairo, Egypt, 2005. [51] U. Fayyad, G.P. ShapirO, P. Smyth, “The KDD process for extraction useful knowledge from volumes data”, In: Communication of the ACM, Vol.39, November 1996, pp.27-34. [52] U. Fayyad, G. Piatetsky-Shapiro and P. Smyth, “Knowledge Discovery and Data Mining: Towards a Unifying Framework”, Proc. 2nd International Conference on KDD & DM, Simoudis E. and Han J. (Eds.), AAAI Press, Menlo Park CA, 1996, pp.82-87. [53] V. Devedzic, “Knowledge Discovery and Data Mining in Databases”. In “Handbook of Software Engineering and Knowledge Engineering Vol.1-Fundamentals”, World Scientific Publishing Co., Singapore, 2001, pp.615-637. [54] W. Hai, S. Wang, “A knowledge management approach to data mining process for business intelligence”, Journal: Industrial management & data systems, Vol.108, Issue: 5, 2008, pp.622-634.
29
Dynamic knowledge mapping guided by data mining: Application on Healthcare
BRAHAMI Menaouer Graduated in 1999 from the Department of Computer Science in Oran (Algeria), and obtained his Master of Science Degree in the same department in 2007. He is currently a Ph.D. candidate in the Computer Science Department at the University of Oran. His research interests include knowledge management, Knowledge mapping, Knowledge visualization, Knowledge representation, knowledge discovery in databases, data mining, and cellular automata.
ATMANI Baghdad He received a Ph.D. degree in degree in computer science from the University of Oran (Algeria), in 2007. He is a professor in the Computer Science Department at the University of Oran. His research interests include knowledge discovery in databases, data mining, feature selection, neural networks, and cellular automata.
MATTA Nada She received a HDR degree in computer science from the University of Technology of Troyes (France), in 2004. He is a teacher-researcher contractual at UTT (University of Technology of Troyes) in the Computer Science. His research interests include Information Systems, Knowledge Engineering, Knowledge Management, Knowledge capitalization, Memory Project, and Knowledge Tracing.
30