Dynamic programming procedure for searching optimal models to estimate substitution rates based on the maximum-likelihood method Chengjun Zhanga, Jia Wanga, Weibo Xiea, Gang Zhoua, Manyuan Longb,1, and Qifa Zhanga,1 a
National Key Laboratory of Crop Genetic Improvement and National Center of Plant Gene Research (Wuhan), Huazhong Agricultural University, Wuhan 430070, China; and bDepartment of Ecology and Evolution, University of Chicago, Chicago, IL 60637
Contributed by Qifa Zhang, March 25, 2011 (sent for review May 12, 2010)
The substitution rate in a gene can provide valuable information for understanding its functionality and evolution. A widely used method to estimate substitution rates is the maximum-likelihood method implemented in the CODEML program in the PAML package. A limited number of branch models, chosen based on a priori information or an interest in a particular lineage(s), are tested, whereas a large number of potential models are neglected. A complementary approach is also needed to test all or a large number of possible models to search for the globally optional model(s) of maximum likelihood. However, the computational time for this search even in a small number of sequences becomes impractically long. Thus, it is desirable to explore the most probable spaces to search for the optimal models. Using dynamic programming techniques, we developed a simple computational method for searching the most probable optimal branch-specific models in a practically feasible computational time. We propose three search methods to find the optimal models, which explored O(n) (method 1) to O(n2) (method 2 and method 3) models when the given phylogeny has n branches. In addition, we derived a formula to calculate the number of all possible models, revealing the complexity of finding the optimal branch-specific model. We show that in a reanalysis of over 50 previously published studies, the vast majority obtained better models with significantly higher likelihoods than the conventional hypothesis model methods.
|
|
likelihood-ratio test natural selection positive selection substitution nonsynonymous substitution
|
E
| synonymous
stimating substitution rates is important in the investigation of functionality and evolution of genes. Natural selection can be also tested by comparing the substitution rates at synonymous and nonsynonymous sites, denoted usually as Ks and Ka, respectively (Ka = number of nonsynonymous substitutions per nonsynonymous site, Ks = number of synonymous substitutions per synonymous site). Such estimation is usually performed by analyzing the divergence of a protein-coding gene in a number of homologous sequences in different species. The maximum-likelihood method is widely used for estimating the substitution rates of nucleotide sequences in protein-coding genes in molecular evolutionary analysis, although some of its techniques were recently debated (1, 2). The CODEML program in the PAML package (3) is among the most frequently used and utilizes a codon substitution model to infer evolutionary rates. Several approaches were incorporated into the program, including a site model, a clade model, a branch model, and a branch-site model. The widely used branch model allows estimation of the substitution rates with variable ratios of ω = Ka/Ks in different branches (lineages) in a phylogeny. Generally, ω > 1 indicates positive selection, ω < 1 indicates purifying selection with functional constraint, and ω ∼ 1 indicates neutral evolution (4). The branch model was initially applied to the evolutionary analysis of the primate gene-encoding lysozyme (5). The analysis showed that the ω-parameter along the hominoid branch was significantly greater than 1, indicating that positive selection might have operated on it. This model has been widely used in molecular evolutionary studies and the functional analyses of 7860–7865 | PNAS | May 10, 2011 | vol. 108 | no. 19
genes, and it is particularly valuable to detect positive selection after gene duplications (3). For example, a branch model analysis of the Drosophila retroposed gene Dntf-2r detected positive selection (6). The use of this model revealed that three young chimeric genes, jingwei, Adh-Twain, and Adh-Finnegan, underwent both early rapid evolution and subsequent slow evolution of protein sequences resulting from increased functional constraints (7, 8). Branch model analysis on the NOD26-like intrinsic proteins also detected strong selective pressure on highly constrained functional proteins and many positive selective events that might change the gene’s functions after the duplication and speciation events in the plants (9). In the branch model analysis, a range of ω-values can be chosen. The one-ratio model (ORM) assumes that all branches have the same one ω-parameter, whereas the free-ratio model (FRM) assigns a different ω-parameter to each branch in the tree for estimation. Between ORM and FRM are a limited number of hypothesis models, assuming that some specific branches have specific ratios based on a priori available information or interest in a possible positive selection on a branch(s) implied by FRM analysis. These models were explored and compared by likelihood-ratio tests (LRTs) (5, 10). Obviously, in this approach, it is imperative to have some good a priori reasons to restrict the estimate of spaces to explore. As Pond and Frost pointed out (11), however, this approach has a disadvantage, because it is not always possible to derive suitable hypotheses when no useful information is available or when no branch can be focused on in the model search. As a model-searching approach to complement the current approach, there is thus a need to search all possible models for the best model that has a globally maximum likelihood. Because all models, except the ORM and FRM, need to be specified with ω-parameters for certain branches, however, the analysis often becomes impractical, especially because all possible models often require an intractably large number of repeated computations of likelihoods. To solve these technical difficulties, we proposed to search the most probable spaces to determine the optimal branch-specific models that have likelihoods equal or close to the globally maximum likelihood over all possible models with the least degrees of freedom (12). We developed a two-step method to count all possible branch models to reveal the complexity of the computation using CODEML. Then, motivated by the dynamic programming that is widely used in computation (13), we developed three simple and rapid methods in search of the optimal branch models in the most probable spaces for the maximum likelihood. Finally, the proposed methods were assessed by the lysozyme sequences of primate species (5) and reanalysis of 50 previously published
Author contributions: C.Z., M.L., and Q.Z. designed research; C.Z., J.W., W.X., and G.Z. performed research; C.Z. and M.L. analyzed data; and C.Z., M.L., and Q.Z. wrote the paper. The authors declare no conflict of interest. Freely available online through the PNAS open access option. 1
To whom correspondence may be addressed. E-mail:
[email protected] or qifazh@ mail.hzau.edu.cn.
This article contains supporting information online at www.pnas.org/lookup/suppl/doi:10. 1073/pnas.1018621108/-/DCSupplemental.
www.pnas.org/cgi/doi/10.1073/pnas.1018621108
studies. Through these analyses, we show that our simple methods can obtain globally better models with significantly higher likelihoods than the current approach that compares the models on the branches of particular interest. Because the current approach relies on the hypothesized branches of interest to test positive selection, we call it the “conventional hypothesis model.”
in the configuration, which have the same branch numbers), and thus we have m−1
Kmj ¼
∏ Cnij− P q q
ði − 1Þj
i¼1
[2]
g
∏ Al !
Results of all possible branch models using a two-step strategy, which is used in a program written using the Perl script (SI Appendix). In the first step, we defined a model that included the number of ω’s and the branch number for each ω, recording this model in a configuration. For example, for a tree of four branches with three sequences, assuming two ω-values, ω1 for one branch and ω2 for the other three branches, we record this configuration as a vector (1 ω1, 3 ω2), or simply (1, 3). We developed a traversing algorithm to find all the configurations of a variety of ratios. In the second step, we calculated all possible branch models with each configuration following the two formulas that we derived, as shown below. Imagine a phylogeny of six branches with four sequences (SI Appendix, Fig. 1). The models for this tree can be divided into six groups [ranging from ORMs, to two-ratio models, up to the sixratio model (FRM)], and in each group, the models can be divided into several configurations. For example, it has three configurations in three-ratio models: the first configuration has one branch with ω1, one branch with ω2, and the other four branches with ω3, expressed as (1, 1, 4); the second configuration has one branch with ω1, two branches with ω2, and the other three branches with ω3, expressed as (1, 2, 3); and the third configuration has three two branches with ω1, ω2, and ω3, respectively, expressed as (2, 2, 2). The number of the models for the first configuration (1, 1, 4) can be calculated and expressed as K31, the numbers of the models for the second and the third configurations [(1, 2, 3) and (2, 2, 2)] as K32 and K33, respectively. In K32, because the components in the configuration are not equal to each other, all possible combinations are K32 ¼ C61 × C52 ¼ 60 Because the first configuration has two different types (the numbers of branches) of components in K31 and the third configuration has three components each with the same number of branches in K33, K31 ¼ C61 × C51 ÷ 2! ¼ 15 Where the 2! is the denominator because we need only the combination, the order of arrangement does not matter. Similarly, we have K33 ¼ C62 × C42 ÷ 3! ¼ 15 In general, for a phylogeny with n branches, we use Kmj to denote the possible model numbers for the jth configuration with m ω-parameters; qij denotes the branch numbers of the ith ω-parameter of the jth configuration. By definition, we have m X
qij ¼ n; m∈ð1 to nÞ:
l−1
By means of this approach, to illustrate the intractably large number of possible branch models visually, all configuration numbers and possible model numbers of phylogeny for 3, 4, 6, 8, 10, and 12 sequences are shown in Table 1 for all possible ω-values; an example of the details of the configuration and model is provided in SI Appendix. Dynamic Programming Algorithms for Searching Optimal Branch Models. Despite present-day rapidly increasing computing pow-
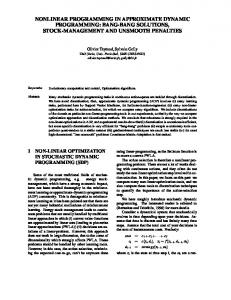
ers, it is impractical to use the traversing algorithm to explore all models, as shown in Table 1. We developed three simplified methods for searching optimal models by using dynamic programming algorithms. We attempted to reduce computation to a practical workable level by exploring the most likely space that contains the maximum likelihood. Method 1. Fig. 1A summarizes the procedure we propose. First, calculate all possible configurations for single-branch two-ratio models (SBTRMs), in which only one branch is labeled with ω1 and all other branches are assumed to be background ratio ω0. Obviously, the log likelihood (lnL) values for n SBTRMs need to be calculated when the analyzed phylogeny has n branches. Second, the lnL values of all n SBTRMs are compared and sorted from maximum to minimum; the model with the maximum lnL value is considered the optimal model within two-ratio models. The branch labeled with ω1 in the maximum lnL value model is recorded as B1, the branch labeled with ω1 in the model that has the second greatest lnL value is recorded as B2, and so on until Bn. Then, all the optimal models of the remaining variety of ratios are generated directly. For the optimal three-ratio model, branch B1 is labeled as ω1, branch B2 is labeled as ω2, and all other branches are assumed to have a background ratio ω0 and optimal models for four ratios to an “n − 1” ratio as well. Finally, the n − 2 optimal models can be “predicted” in this way, and the likelihoods of these predicted models can be calculated and compared with each other to determine the final optimal model that has the maximum likelihood in the sense that the likelihood is significantly better than the likelihood of other optimal models and has the least degrees of freedom if there are more than one solutions that are not significantly different. Method 2. This method can be described in n − 2 rounds with two steps in each round of iterations, as shown in Fig. 1B. The first step generates models and calculates InLs for all these models; the second step is to record the specific branch of the optimal model of this round, which is used for generating models in the next round. The models in the first round are all SBTRMs. The branch labeled with ω1 in the maximum lnL value model is recorded as B1. In the second round, n − 1 three-ratio models are generated by adding one more branch with one more ratio (ω2) in addition to B1, whereas all other n − 2 branches have the background ratio ω0. The InLs for all n − 1 three-ratio models are calculated and compared with each other. The branch labeled ω2 of the optimal
i¼1
Table 1. Configurations and possible models
When qxj ≠ qyj (x ≠ y, x, y∈ (1 to m), q0j = 0), the formula to calculate Kmj can be expressed as m−1
Kmj ¼ ∏ Cnij− P q i¼1
q
ði − 1Þj
[1]
When there exist x and y variables, let qxj = qyj [x ≠ y, x, y ∈ (1 to m)], q0j = 0 (Ag means having g groups and Ag components Zhang et al.
Sequence no. Branch no. Configuration no. No. of possible models 3 4 6 8 10 12
4 6 10 14 18 22
3 9 40 133 383 1,000
15 203 115,975 190,899,322 6.821E + 11 4.507E + 15
PNAS | May 10, 2011 | vol. 108 | no. 19 | 7861
EVOLUTION
Large Number of Possible Branch Models. We calculated the number
A
B lnL value
lnL value
maximum
B1
minimum
B2
B3
B4
B5
minimum
maximum
B6
B1
generate three-ratio models based on B1
B2
generate four-ratio models based on B1 and B2
generate optimal models directly
three-ratio model
four-ratio model
five-ratio model B3
go on until no free branches
C A
generate two-ratio models belong to vector (2, 4) based on B1
B1
B
B2 if the difference of A and B bigger than K, generate two-ratio models belong to vector (3, 3) based on B1 and B2
if the difference of A and B smaller than K, generate three-ratio models belong to vector (1, 1, 4) based on B1
D
C
B4
B3
if the difference of B and C bigger than K, generate models based on B1, B2 and B3
E
generate three-ratio models belong to vecotr (1, 2, 3) based on B1 and B4
if the difference of B and C smaller than K, generate three-ratio models belong to vector (2, 1, 3) based on B1 and B2
G
F
B5 compare C and E then go on untill no free branches
generate three-ratio models belong to vector (2, 2, 2) based on B1, B2 and B5
compare D and G then go on untill no free branches
H
compare F and H then go on untill no free branches
Fig. 1. Sketch of the proposed methods. (A) Method 1: Searching optimal models with more than two ω-parameters directly based on the sorted results of the SBTRM (2–5 ω-parameters exemplified). The different models with the same number of ω-parameters are arranged from high-likelihood to low-likelihood values. (B) Method 2: Searching optimal models with ω-parameters until there are no free branches, based on the maximum-likelihood value model from the last round. The different models with the same number of ω-parameters are also arranged from high-likelihood to low-likelihood values. (C) Method 3: Searching optimal models by iteration. In (A–C), one color stands for one ω-parameter.
model having the maximum lnL value in all n − 1 three-ratio models is recorded as B2. This process is reiterated until all n − 1 ω’s are calculated. In total, (n + 1)*n/2 models are generated and calculated; n − 2 optimal models of a variety of ratios are obtained and can be compared with each other, including the ORM and FRM, by LRT to determine the final optimal models. Method 3. This is a modification of method 2 (Fig. 1C), to consider general cases of one ratio with more than one branch. First, similar to method 2, all the SBTRMs belonging to the configuration (1, n − 1) are calculated in this step and the optimal model of SBTRMs (assumed to be A) is determined. This optimal model has only one branch B1, which is labeled as ω1. Then, in the second step, other n − 1 two-ratio models are generated, which have another branch labeled as ω1 in addition to B1; these models 7862 | www.pnas.org/cgi/doi/10.1073/pnas.1018621108
belong to the configuration (2, n − 2). After calculation, the optimal model is found (assumed to be B). If the difference in the lnL values between A and B is greater than k (k is a threshold that can be defined by the user to decide if one model is better than another model with the same degree of freedom when they have different branches with same ratio, the default k = 0.5), the models belonging to configuration (3, n − 3) are generated and calculated and the optimal model C is compared with B. Such iterations continue until the difference between the two optimal models is less than k. Clearly, the optimal model obtained from the penultimate iteration will become the final optimal two-ratio model. Note that the threshold value of k will determine the number of iterations; the more iterations calculated, the more the branch would be labeled with the same ω and the fewer would be Zhang et al.
the number of large cycles that are needed. In the end, there will be no more than n − 2 optimal models of a variety of ratios obtained, and these can be compared with each other, including ORM and FRM, by LRT to find the final optimal models.
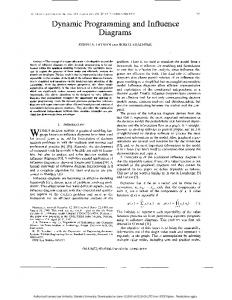
Fig. 2. Phylogeny of six lysozyme sequences, with the lineage h under positive selection and lineage c having a greater ω-value than the background in research (5). The branch length is estimated by the final optimal model of method 3; the number of nonsynonymous and synonymous sites and ω-parameters are labeled along the lineage.
of three methods (using df = 1) by the LRT. Conversely, the final optimal model of method 3 is significantly better than the two hypothesis models in the original computation (5) (P = 0.045 and P = 0.045, df = 1) and also significantly better than the final optimal model of methods 1 and 2 (P = 0.016, df = 1). In addition, the other six datasets all support the results presented above, indicating that the final optimal models are very close to the final best model in all seven datasets. Only once, in dataset 2, was the final best model significantly better than the final optimal models of all three methods (SI Appendix, Table 3). In these similar datasets, some of the final optimal models are significantly better than the hypothesis models, whereas none of the hypothesis models are significantly better than final optimal models; most of the final optimal models of the three methods in datasets 3 and 4 were significantly better than the hypothesis models (SI Appendix, Table 4). We calculated the seven sequences by the three methods and compared the final optimal models with the conventional hypothesis models. We reached the same conclusion that the six-sequence dataset showed.
Table 2. Maximum lnL values for various ratio models
Total model nos. lnL of best models lnL of hypothesis models‡ Method 1 lnL values* Rank† Method 2 lnL values Rank Method 3 lnL values Rank
TRM
ThreeRM
FourRM
FiveRM
SixRM
SevenRM
EightRM
NineRM
511 −843.25 −844.10 −844.99 35 −844.99 35 −844.99 35
9,330 −841.74 −844.10 −844.15 779 −844.06 643 −842.09 4
34,105 −841.51
42,525 −841.36
22,827 −841.29
5,880 −841.29
750 −841.28
45 −841.28
−842.66 480 −842.66 480 −841.79 20
−842.39 1,166 −841.98 412 −841.74 94
−841.78 350 −841.78 350 −841.47 40
−841.77 353 −841.61 150 −841.42 37
−841.69 127 −841.35 18 −841.41 30
−841.64 18 −841.29 4 —
lnL value of the ORM is −847.33 and that of the FRM is −841.28. TRM, two-ratio model; ThreeRM, three-ratio model; FourRM, fourratio model; FiveRM, five-ratio model; Six RM, six-ratio model; SevenRM, seven-ratio model; EightRM, eight-ratio model; NineRM, nineratio model. *Number in bold is the lnL value for the final optimal (best) model of each method compared by the LRT (the P value is shown in SI Appendix, Table 2). † Number in the Rank row indicates the relative position of the lnL value in all models. For example, the ThreeRM for method 3 has the InL value −842.09, which is ranked in the fourth position from the highest one, −841.74. ‡ The InL values of the two hypothesis models are −844.097468 for TRM and −844.096995 for ThreeRM, both rounded to −844.10.
Zhang et al.
PNAS | May 10, 2011 | vol. 108 | no. 19 | 7863
EVOLUTION
Evaluation of the Three Methods. To evaluate the three methods, we tested them using a dataset that has been tested in all possible ratio models of maximum-likelihood analysis. We first analyzed the datasets of the seven lysozyme sequences of primate species, which were used as an example for the maximum-likelihood analysis (5). We then randomly sampled the 50 previous studies (14–53) that used the branch model and reanalyzed their data using our methods. These studies covered a wide spectrum of phylogenetic breadth, ranging from 6 to 62 sequences, including both orthologous and paralogous groups (data in SI Appendix). To describe the analysis of the lysozyme sequences in detail (Methods), we showed the results from the analysis of only one dataset of six sequences (the other six datasets of six sequences from each of the original seven sequences are summarized in the data in SI Appendix). The phylogeny of this dataset is shown in Fig. 2 (the remaining six are shown in SI Appendix, Fig. 2). The best models presented here means that the models have a maximum lnL value among a variety of ω-parameters, whereas the final best model is the model considered to be the best compared by the LRT among several best ones. The lnL values of the eight best models of this dataset are listed in Table 2 with several optimal models of the three methods and two hypothesis models as well (results from the other six datasets are shown in SI Appendix, Table 1). The eight best models with ORM and FRM were compared with each other by the LRT, and the best two-ratio model was considered to be the final best model, with an lnL value of −843.25. In the same way, all the optimal models of the three methods were compared with each other, and the lnL value of the final optimal models are −844.99 for methods 1 and 2 and −842.09 for method 3; the P values are shown in SI Appendix, Table 2. The final best model and final optimal models according to SI Appendix, Table 2 are evident and are marked in bold in Table 2. These results show that our simple methods obtained results very close to the results from a complete comparison. The estimates of the substitution rate from the final best model, final optimal models, and hypothesis models are listed in Table 3. It is obvious that all these models, except the final optimal model of methods 1 and 2, suggest that positive selection operates on some lineages (Ka/Ks = 4.235–4.466), whereas the final optimal model of methods 1 and 2 indicates neutral evolution in most lineages (Ka/Ks = 1.075) and very strong purifying selection on Cja_marmoset branch (Ka/Ks = 0.0001). The results of final optimal models of methods 1 and 2 may well be wrong, but the final best model is not significantly better than the final optimal models
Our finding that most final optimal models detected by our methods are significantly better than the conventional hypothesis models was further confirmed by our subsequent studies of 50 gene families. We collected the sequences from these gene families from 40 original studies (14–53), and we then applied our methods to analyze these data and to compare them with the previous results of conventional hypothesis models using the maximum-likelihood method. These analyses are summarized in SI Appendix, Table 5. We found that in gene families (or cases) 40 and 45, the lnL value of the final optimal model our method detected and that of the conventional hypothesis model were congruent with each other; in case 38, there was no difference between the final optimal model and the current hypothesis model (P > 0.05). However, we were surprised to see that for the vast majority of the rest 47 cases, the lnL values for the final optimal models are significantly higher than the InL values for the conventional hypothesis models (P < 0.001). In these cases, 22 are significant at the level P ≤ 10−5 and 8 of them even at level P ≤ 10−10. More details of the conventional hypothesis models, our optimal models, and the 50 phylogenies are provided in the data in SI Appendix. Discussion In principle, the maximum-likelihood method was proposed to find the most probable estimates, given a phylogeny of homologous sequences. It is also clear that FRM cannot guarantee a parsimonious model. It is thus expected to find the globally most probable estimate by performing an exhaustive search of the most probable model from all possible models. Such a search is often impractically time-consuming, however, because of a huge number of possible models for a tree with even a small number of sequences. The problems in calculating all possible models were raised previously (54). Our method calculated the number of all possible models for a rooted tree in full agreement with the Bell number that was used to calculate the number in an unrooted tree (54). We proposed these simplified methods to find the most probable estimates of substitution rates with the least degrees of freedom in hypothesis testing compared with the FRM. The present study highlights the finding that the optimal models obtained from the three methods described in the following text via a dynamic programming approach are extremely close to the best model obtained from the traversing algorithm. The former simple methods use a reasonably short time, whereas the latter exhaustive search is often impractical in computing time for a large dataset, such as that used in this paper. Compared with the previous analysis of the lysozyme dataset using the conventional hypothesis models (5), our simple method 3 obtained even significantly higher likelihoods than the previous two-ratio and three-ratio hypothesis models (−842.09 vs. −844.10, P = 0.045; −842.09 vs. −844.10, P = 0.045; Table 3). The advantage of our methods is further confirmed by our large-scale case analyses of 50 previously reported gene families using the conventional hypothesis method. In these 50 cases, we found that for 47 cases (94%), our final optional models had significantly
higher likelihoods than the conventional hypothesis models and that there were only 3 cases not having significantly different likelihoods (SI Appendix, Table 5). The most significant differences were observed in the Chalcone Synthase Genes of Dendranthema (case 6: 2Δl = 198.91, df = 11, P < 1e-14), the Phytochrome Gene Family in Angiosperms (case 3: 2Δl = 206.25, df = 8, P < 1e-14), and the recently duplicated Mγ-type MADSbox genes in Petunia (case 13: 2Δl = 175.71, df = 16, P < 1e-14). The compared models in the branch model should be nested, as suggested for the LRT (55). To make a more general comparison involving the models that do not meet such a condition, we also used the Akaike’s information criterion (AIC) (56) method in analyses of these 50 cases, with the AIC values of the analyzed models in the data in SI Appendix. Again, except for 2 cases in which the final optimal model is congruent with the conventional hypothesis model, all other final optimal models have the lowest AIC value in 48 cases, even in the case (case 38) that failed in the LRT also getting a lower AIC than the conventional hypothesis model. In additional, in the color vision gene (SWS2, case 17), in which 2Δl = 34.30, df = 6, P = 5.90e-006, our optimal models suggest positive selection on the lineage Sinocyclocheilus purpureus (fix ωpurpureus = 1 model vs. free ωpurpureus model: 2Δl = 5.74, df =1, P = 0.017), which was not detected by the previous analysis using the conventional hypothesis method. These case analyses indicate that most previous reports missed the optional models and that the conventional hypothesis method can easily miss the globally most probable model. Our methods appear to be able to detect more significant models than the conventional hypothesis method. Although the present methods provide simplified computational procedures for the maximum-likelihood analysis, caution should be urged in using these methods. The first caveat is that, like any other phylogeny-related study, if the phylogeny tree is inaccurate or incorrect (e.g., an incorrect inference of the orthologousparalogous relationship), the estimates of the maximum-likelihood method, which is dependent on the tree, are meaningless. The second caution is that when many models explored by our methods detected a large ω-value in some lineages, this finding may not immediately suggest positive selection, because a statistical test for its significance is needed. The model comparison as implemented by the original branch model (5) is necessary using, for example, the nested model-based LRT or AIC discussed above. Third, we note here that method 3 seems to perform better than methods 1 and 2 in detecting final optimal models using the one gene-data analysis of lysozyme. We recommended using all three methods for more genes and comparing their performance. It would be a wise practice to start from method 1 when analyzing a large dataset to gain some useful insight because of its brief computation time. Methods Sequence. The sequences used in calculation of all possible models to evaluate our three methods are taken from previous work (5) and can be obtained in the PAML package in the example of lysozyme. For the reanalysis of the 50 previous studies, we utilized either available sequence alignments provided
Table 3. Substitution rate values of final best model, final optimal model, and hypothesis model
lnL values ω0 ω1 ω2 k
Final best model*
Final optimal model (methods 1 and 2)†
Final optimal model (method 3)‡
Hypothesis TRM§
Hypothesis ThreeRM¶
−843.25 0.497 4.466 — 5.021
−844.99 1.075 0.0001 — 4.921
−842.09 0.611 0.0001 4.288 5.000
−844.10 0.579 4.224 — 5.008
−844.10 0.579 4.333 4.112 5.007
TRM, two-ratio model; ThreeRM, three-ratio model. For the following phylogeny with markers for models (#1, ω1; #2, ω2): *(((Ssc_squirrelM,Cja_marmoset),Hla_gibbon#1)#1,(Mmu_rhesus#1,(Cgu_Can_colobus,Pne_langur)#1)) † (((Ssc_squirrelM,Cja_marmoset#1),Hla_gibbon),(Mmu_rhesus,(Cgu_Can_colobus,Pne_langur))) ‡ (((Ssc_squirrelM,Cja_marmoset#1),Hla_gibbon#2),(Mmu_rhesus#2,(Cgu_Can_colobus,Pne_langur)#2)) § (((Ssc_squirrelM,Cja_marmoset),Hla_gibbon#1),(Mmu_rhesus,(Cgu_Can_colobus,Pne_langur)#1)) ¶ (((Ssc_squirrelM,Cja_marmoset),Hla_gibbon#1),(Mmu_rhesus,(Cgu_Can_colobus,Pne_langur)#2))
7864 | www.pnas.org/cgi/doi/10.1073/pnas.1018621108
Zhang et al.
Calculating the Entire Range of Possible Models. We generated seven datasets of sixsequencesfromtheselysozymesequencesbydeletingonesequencefromseven. Allpossiblemodels(115,975possiblemodels inonedataset)ofthesesevendatasets were generated by the traversing algorithm (SI Appendix) and calculated. It took almost 4 d to finish all the calculations for one dataset, and according to this, it may take 160 d to calculate all possible 4,213,597 models of the seven sequences on the server (Dawning Information Industry), which has eight AMD Opteron 2376 processors with the operation system Linux AS 5. The phylogeny used in the calculations was built by MEGA 4.0 with the neighbor-joining method (57).
1. Nozawa M, Suzuki Y, Nei M (2009) Reliabilities of identifying positive selection by the branch-site and the site-prediction methods. Proc Natl Acad Sci USA 106:6700–6705. 2. Yang Z, Nielsen R, Goldman N (2009) In defense of statistical methods for detecting positive selection. Proc Natl Acad Sci USA 106:E95–E96, author reply E96. 3. Yang Z (2007) PAML 4: Phylogenetic analysis by maximum likelihood. Mol Biol Evol 24: 1586–1591. 4. Li W (1997) Molecular Evolution (Sinauer, Sunderland, MA). 5. Yang Z (1998) Likelihood ratio tests for detecting positive selection and application to primate lysozyme evolution. Mol Biol Evol 15:568–573. 6. Betrán E, Long M (2003) Dntf-2r, a young Drosophila retroposed gene with specific male expression under positive Darwinian selection. Genetics 164:977–988. 7. Jones CD, Begun DJ (2005) Parallel evolution of chimeric fusion genes. Proc Natl Acad Sci USA 102:11373–11378. 8. Jones CD, Custer AW, Begun DJ (2005) Origin and evolution of a chimeric fusion gene in Drosophila subobscura, D. madeirensis and D. guanche. Genetics 170:207–219. 9. Liu Q, et al. (2009) Divergence in function and expression of the NOD26-like intrinsic proteins in plants. BMC Genomics 10:313. 10. Anisimova M, Bielawski JP, Yang Z (2001) Accuracy and power of the likelihood ratio test in detecting adaptive molecular evolution. Mol Biol Evol 18:1585–1592. 11. Pond SL, Frost SD (2005) A genetic algorithm approach to detecting lineage-specific variation in selection pressure. Mol Biol Evol 22:478–485. 12. Goldman N (1993) Statistical tests of models of DNA substitution. J Mol Evol 36:182–198. 13. Bellman R (1957) Dynamic Programming (Princeton Univ Press, Princeton). (2003) Paperback edition (Dover, New York). 14. Jiggins FM, Hurst GD, Yang Z (2002) Host-symbiont conflicts: Positive selection on an outer membrane protein of parasitic but not mutualistic Rickettsiaceae. Mol Biol Evol 19:1341–1349. 15. Marcussen T, Oxelman B, Skog A, Jakobsen KS (2010) Evolution of plant RNA polymerase IV/V genes: Evidence of subneofunctionalization of duplicated NRPD2/ NRPE2-like paralogs in Viola (Violaceae). BMC Evol Biol 10:45. 16. Yang Z, Nielsen R (2002) Codon-substitution models for detecting molecular adaptation at individual sites along specific lineages. Mol Biol Evol 19:908–917. 17. Alba R, Kelmenson PM, Cordonnier-Pratt M-M, Pratt LH (2000) The phytochrome gene family in tomato and the rapid differential evolution of this family in angiosperms. Mol Biol Evol 17:362–373. 18. Huttley GA, et al. (2000) Adaptive evolution of the tumour suppressor BRCA1 in humans and chimpanzees. Australian Breast Cancer Family Study. Nat Genet 25:410–413. 19. Yang J, Huang J, Gu H, Zhong Y, Yang Z (2002) Duplication and adaptive evolution of the chalcone synthase genes of Dendranthema (Asteraceae). Mol Biol Evol 19: 1752–1759. 20. Merritt TJ, Quattro JM (2001) Evidence for a period of directional selection following gene duplication in a neurally expressed locus of triosephosphate isomerase. Genetics 159:689–697. 21. Yang Z (2002) Inference of selection from multiple species alignments. Curr Opin Genet Dev 12:688–694. 22. Yang J, Gu H, Yang Z (2004) Likelihood analysis of the chalcone synthase genes suggests the role of positive selection in morning glories (Ipomoea). J Mol Evol 58:54–63. 23. Aguileta G, Bielawski JP, Yang Z (2004) Gene conversion and functional divergence in the beta-globin gene family. J Mol Evol 59:177–189. 24. Schein M, Yang Z, Mitchell-Olds T, Schmid KJ (2004) Rapid evolution of a pollenspecific oleosin-like gene family from Arabidopsis thaliana and closely related species. Mol Biol Evol 21:659–669. 25. Narita Y, Oda S, Takenaka O, Kageyama T (2010) Lineage-specific duplication and loss of pepsinogen genes in hominoid evolution. J Mol Evol 70:313–324. 26. Larmuseau MH, Huyse T, Vancampenhout K, Van Houdt JK, Volckaert FA (2010) High molecular diversity in the rhodopsin gene in closely related goby fishes: A role for visual pigments in adaptive speciation? Mol Phylogenet Evol 55:689–698. 27. Arora R, et al. (2007) MADS-box gene family in rice: Genome-wide identification, organization and expression profiling during reproductive development and stress. BMC Genomics 8:242. 28. Bemer M, Gordon J, Weterings K, Angenent GC (2010) Divergence of recently duplicated Mγ-type MADS-box genes in Petunia. Mol Biol Evol 27:481–495.
Zhang et al.
Exploring Optimal Models with Three Methods. Using the phylogeny and sequence, we performed analyses using the seven datasets with six sequences and seven sequence datasets of lysozymes (these databases are available upon request). The k value of method 3 is 0.5. ACKNOWLEDGMENTS. We thank Shiping Wang for valuable discussion and support. We are grateful to Michael Sanderson and reviewers for valuable discussions. C.Z., J.W., W.X., G.Z., and Q.Z. were supported by grants from the National Special Key Project on Functional Genomics of Major Plants and Animals and National Natural Science Foundation of China. M.L. was supported by National Institutes of Health Grant R0IGM078070-01A1 and National Science Foundation Grant (MCB 1026200) as well as by the 111 Project of China.
29. Schienman JE, Holt RA, Auerbach MR, Stewart CB (2006) Duplication and divergence of 2 distinct pancreatic ribonuclease genes in leaf-eating African and Asian colobine monkeys. Mol Biol Evol 23:1465–1479. 30. Yu L, et al. (2010) Adaptive evolution of digestive RNASE1 genes in leaf-eating monkeys revisited: New insights from ten additional colobines. Mol Biol Evol 27:121–131. 31. Zhang J (2006) Parallel adaptive origins of digestive RNases in Asian and African leaf monkeys. Nat Genet 38:819–823. 32. Zhang J, Zhang YP, Rosenberg HF (2002) Adaptive evolution of a duplicated pancreatic ribonuclease gene in a leaf-eating monkey. Nat Genet 30:411–415. 33. Viaene T, et al. (2009) Pistillata—Duplications as a mode for floral diversification in (Basal) asterids. Mol Biol Evol 26:2627–2645. 34. Li Z, Gan X, He S (2009) Distinct evolutionary patterns between two duplicated color vision genes within cyprinid fishes. J Mol Evol 69:346–359. 35. Zhou D, et al. (2009) Duplication and adaptive evolution of the COR15 genes within the highly cold-tolerant Draba lineage (Brassicaceae). Gene 441:36–44. 36. Miwa H, et al. (2009) Adaptive evolution of rbcL in Conocephalum (Hepaticae, bryophytes). Gene 441:169–175. 37. Zhao H, et al. (2009) The evolution of color vision in nocturnal mammals. Proc Natl Acad Sci USA 106:8980–8985. 38. Weadick CJ, Chang BS (2009) Molecular evolution of the betagamma lens crystallin superfamily: Evidence for a retained ancestral function in gamma N crystallins? Mol Biol Evol 26:1127–1142. 39. Wang Z, et al. (2009) Adaptive evolution of 5′HoxD genes in the origin and diversification of the cetacean flipper. Mol Biol Evol 26:613–622. 40. Dorus S, Freeman ZN, Parker ER, Heath BD, Karr TL (2008) Recent origins of sperm genes in Drosophila. Mol Biol Evol 25:2157–2166. 41. Schulenburg H, Boehnisch C (2008) Diversification and adaptive sequence evolution of Caenorhabditis lysozymes (Nematoda: Rhabditidae). BMC Evol Biol 8:114. 42. Zhang L (2008) Adaptive evolution and frequent gene conversion in the brain expressed X-linked gene family in mammals. Biochem Genet 46:293–311. 43. Zhang W, et al. (2008) Molecular evolution of PISTILLATA-like genes in the dogwood genus Cornus (Cornaceae). Mol Phylogenet Evol 47:175–195. 44. Storz JF, Hoffmann FG, Opazo JC, Moriyama H (2008) Adaptive functional divergence among triplicated alpha-globin genes in rodents. Genetics 178:1623–1638. 45. Muggia L, Schmitt I, Grube M (2008) Purifying selection is a prevailing motif in the evolution of ketoacyl synthase domains of polyketide synthases from lichenized fungi. Mycol Res 112:277–288. 46. Padhi A, Verghese B (2007) Evidence for positive Darwinian selection on the hepcidin gene of Perciform and Pleuronectiform fishes. Mol Divers 11:119–130. 47. Royer B, et al. (2007) Molecular evolution of the human SRPX2 gene that causes brain disorders of the Rolandic and Sylvian speech areas. BMC Genet 8:72. 48. Ding K, McDonough SJ, Kullo IJ (2007) Evidence for positive selection in the Cterminal domain of the cholesterol metabolism gene PCSK9 based on phylogenetic analysis in 14 primate species. PLoS ONE 2:e1098. 49. Hahn Y, Jeong S, Lee B (2007) Inactivation of MOXD2 and S100A15A by exon deletion during human evolution. Mol Biol Evol 24:2203–2212. 50. Padhi A, Verghese B, Otta SK, Varghese B, Ramu K (2007) Adaptive evolution after duplication of penaeidin antimicrobial peptides. Fish Shellfish Immunol 23:553–566. 51. Zhang Q, et al. (2007) Rapid evolution, genetic variations, and functional association of the human spermatogenesis-related gene NYD-SP12. J Mol Evol 65:154–161. 52. Hou ZC, Xu GY, Su Z, Yang N (2007) Purifying selection and positive selection on the myxovirus resistance gene in mammals and chickens. Gene 396:188–195. 53. Wang Y, et al. (2007) Isolation and characterization of a putative class E gene from Taihangia rupestris. J Integr Plant Biol 49:343–350. 54. Sanderson MJ (1998) Estimating rate and time in molecular phylogenies: beyond the molecular clock? Plant Molecular Systematics, eds Soltis P, Soltis D, Doyle J (Chapman & Hall, New York), 2nd Ed, pp 242–264. 55. Yang Z, Nielsen R, Hasegawa M (1998) Models of amino acid substitution and applications to mitochondrial protein evolution. Mol Biol Evol 15:1600–1611. 56. Akaike H (1974) A new look at the statistical model identification. IEEE Trans Automat Contr 19:716–723. 57. Tamura K, Dudley J, Nei M, Kumar S (2007) MEGA4: Molecular Evolutionary Genetics Analysis (MEGA) software version 4.0. Mol Biol Evol 24:1596–1599.
PNAS | May 10, 2011 | vol. 108 | no. 19 | 7865
EVOLUTION
in the literature or regenerated sequence realignments using MEGA 4.0 (57) when the original alignments were not available.