International Journal of Physical Sciences Vol. 7(42), pp. 5701-5710, 9 November, 2012 Available online at http://www.academicjournals.org/IJPS DOI: 10.5897/IJPS12.173 ISSN 1992 - 1950 ©2012 Academic Journals
Full Length Research Paper
Coupled-operations model and a conditional differential evolution algorithm for improving reservoir management Rattana Hormwichian1, Anongrit Kangrang1*, Alongkorn Lamom1, Chavalit Chaleeraktrakoon2 and Sanguan Patamatamkul3 1
Department of Civil Engineering, Faculty of Engineering, Mahasarakham University, Kantarawichai, Maha Sarakham 44150, Thailand. 2 Department of Civil Engineering, Faculty of Engineering, Thammasat University, Klong Luang, Pathumthani 12120, Thailand. 3 Department of Civil Engineering, Faculty of Engineering, Naresuan University, Muang, Phitsanulok 65000, Thailand. Accepted 23 April, 2012
This paper proposes a flexible methodology for finding the optimal control of reservoir operations, which is adopted for simulating a storage system including a large reservoir simulation model and a numerical search method for searching decision variables. The optimization model used was a conditional differential evolution algorithm (CDE). The model was connected to reservoir simulation model for searching the decision variables in reservoir management. The reservoir management model was applied to Lampao reservoir in Kalasin province located in the northeast of Thailand. This study considers the criteria of minimum water shortages and downstream flood control. There were synthetic inflow data for evaluating the performance of the reservoir operating rule curves. It was found that the reservoir operating rule curves from the CDE showed a lower frequency and quantity of water shortage than the existing reservoir operating rule curve. In addition, the flood frequency and the flood quantity were reduced. The results also demonstrated that the CDE provided better reservoir operation in any probability of inflow situations. Further, it indicated that the reservoir operating rule curves obtained from this research could effectively support the increasing water requirements to a growing population. Key words: A conditional differential evolution algorithm (CDE), simulation model, optimization technique, reservoir rule curves
INTRODUCTION Currently, reservoir operation is a very challenging proposition because water resources are limited and fluctuated. A large volume of water is obtained in the rainy season, but there is lack of water in the dry season. As such, it becomes very important to find the best method to determine an exact water resource plan. The water requirements encompass agriculture, consumption, industries, power generation, ecology and environment.
*Corresponding author. E-mail:
[email protected]. Tel: (66) 43 754316. Fax: (66) 43 754316.
These requirements have increased with an increase in the population growth, lifestyle changes and economic expansion. It is well known that droughts and floods occur each year in the northeast of Thailand. A criterion of optimal water operation for storage reservoirs should establish that the amount of water storage in the area is limited. It has been reported that reservoir operating using rule curves could provide a positive solutions to flood problems, and achieve long-term operational planning (Rezbicek et al., 1991). In the past, until nowadays, the application of a system approach to reservoir management and operations has been established as one of the most important advances
5702
Int. J. Phys. Sci.
made in the field of water resources engineering. A primary role of systems analysis is to provide an improved support to decision-making. It has been concluded that a gap still exists between research studies and the application of a system approach in practice. It is difficult for reservoir management to derive the optimal operational strategies under data available and the global climate variability. Generally, reservoir operating systems are controlled on the basis of a water release budget. The stored water is released under certain conditions for a multitude of purposes that are defined by water use criteria and reservoir operating rule curves. Typically, reservoir operating systems have been large and complex. Optimal rule curves are required for operating reservoir systems. The searching of the optimum rule curves is a nonlinear optimization problem. Years ago, the optimization technique being applied to search the optimal rule curves was performed with a reservoir simulation model (Jain et al., 1998). However, the rule curves obtained from this method were not guaranteed to yield the optimal curves because of human adjustment. Later, “dynamic programming” (DP) was applied to solve non-linear problems in water resource areas (Esogbue, 1989; Kumar and Baliarsingh, 2003). However, DP method suffered from computational overburden for its large dimensionality (Hota et al., 2009). The “DP with the principle of progressive optimality” (DP/PPO) was developed to search the optimal rule curves of single and multiple reservoirs (Chaleeraktrakoon and Kangrang, 2007). The “genetic algorithm” (GA) has been widely used to solve complex problems (Cheng et al., 2002; Muttil and Chau, 2006; Wang et al., 2009; Chau et al., 2005; Yeh, 1997). The best part of the GA is that, it can handle any type of objective function of the search. The GA was applied to the reservoir operation model, studied in this paper, as it has been in several studies (Chang et al., 2003, 2005; Hormwichian et al., 2009). In the last decade, a “simulated annealing algorithm” (SA) was applied to solve the optimization problem (Locatelli, 2000; Teegavarapu and Simonovic, 2002; Lamom et al., 2008). Rather, the SA does not always guarantee the globally optimal solution. Sometime, they can produce suboptimal or near globally optimal solution (Hota et al., 2009). More recently, the SA has been applied to search the optimal reservoir rule curves (Kangrang et al., 2011). The “differential evolution algorithm” (DE) is a new heuristic approach for minimizing possible nonlinear and non-differentiable continuous space function. It will be demonstrated that the new method converges faster and with more certainty than adaptive simulated annealing as well as the Annealed nelder and Mead approach, both of which have a reputation for being very powerful. The differential evolution requires few control variables, but it is robust and easy to use especially in the more difficult functions, and lends itself very well to parallel computation. It uses a simulation of natural evolution, the same as the GA (Price and Storn, 1997). The DE is a
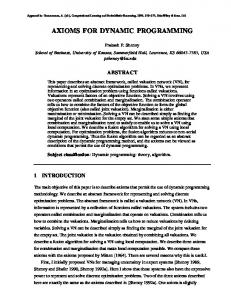
search technique based on the mechanism of natural selection and genetics. It has a robust random search capability and an approach to global optimum values. The DE structure is less complex than that of the GA. As a result, the DE finds the answer efficiently and faster than GA for solving complex equations in the mathematics field. When comparing DE with another well known method such as GA, SA, Nelder-Mead simplex search method (SM) and least squares technique (LS). It can obtain optimum solutions more easily than other (Wang and Ye, 2009). The DE uses fewer control parameters, namely, number of population including a scaling factor, combination coefficient and crossover rate (Karaboga and Okdem, 2004; Bardsiri and Rafsanjani, 2011; Li et al., 2011). The DE can evenly solve both single and multi-objective optimization problems (Adeyemo and Otieno, 2009; Adeyemo et al., 2010). The DE has been used to the model calibration in the water resource field (Liu and Sun, 2010). Therefore, it can be said that the DE is a suitable alternative technique used to find the optimal rule curves within the limited boundaries of reservoir operation. This research aims to develop reservoir management by using a conditional differential evolution algorithm (CDE), which combines a complex reservoir simulation system to search the operating rule curves. A conditional constraint was applied to the search process to reduce the fluctuation of operating rules. Minimum average water shortage and downstream flood control were adopted as the objective function of the search process. Two types of models, the CDE and the conditional GA (CGA), are developed. The results of CDE and CGA as well as the rule curves which are used in the existing (here after shown by existing rule curves) were compared. The CDE model was evaluated to determine the optimum rule curves of the Lampao reservoir in the northeast region of Thailand. MATERIALS AND METHODS The DE uses the concept of the theory of evolution, or survival theory of Charles Darwin. It is similar to the Gas, but some evolution process was modified to improve performance. The basic working of the DE consists of the old and new generation of the same size N. A new trial vector is composed of the current vector X iG of the old generation and the mutant vector
M iG 1 obtained by mutation. The mutation process is described as follows:
M iG 1 X rG1 F ( X rG2 X rG3 )
(1)
Where i, r = 1, 2,…., N. G and F are generation, and scaling factor which can range from 0 to 1. The trial vector was created by the crossover process of those chromosomes. The crossover process is shown as follows: M G 1 T jiG 1 jiG X ji
if (randb( j ) CR) or if (randb( j ) CR) or
j rnbr (i ) j rnbr (i )
(2)
Hormwichian et al.
5703
irrigation release and desired storage volume. The decision variables are release for irrigation and other requirements (agriculture, consumption, industries, fishery and maintaining the ecological regime downstream etc.) from the reservoir. The random rule curves from the CDE model will be used in reservoir simulation model for considering water release. A new reservoir operation model was constructed on the concept of water balance, and it can be used to simulate reservoir operation effectively (Hormwichian et al., 2009). The reservoir operating policies are based on the reservoir rule curves and the principles of a water balance concept. The reservoir system operates along the standard operating policy as expressed by Chaleeraktrakoon and Kangrang (2007). It is shown in Equation 4:
Lt , m
m t , m m , for t , m m m m , for m t , m m m m t , m m , for m m t , m m 0, otherwise.
(4)
Where Lt,m is the water release quantity from the reservoir during time period t and period m (m = 1 to 12, representing January to December); m is the water requirement of month m, αm and λm are the lower rule curve and upper rule curve of month m. νt,m is the available water calculated by simple water balance as shown in Equation 5:
vt ,m1 vt ,m Dt ,m Lt ,m Et ,m
Where vt,m is the stored water at the end of month m; Dt,m is monthly reservoir inflow; Et,m is average value of evaporation loss. There are policies for releasing water from a reservoir: if available water is in a range of the upper and lower rule level, then requirements are satisfied in full; if available water is over the top of the upper rules level, then the water is spilled from the reservoir to the downstream river in order to maintain the water level at the upper rule level; and if available water is below the lower rule level, then the release water is reduced. The release water of the reservoir was used to calculate the situations of water shortage and excess water release, namely, the number of failures in a year, the number of excess water releases, as well as the average annual shortage (Figure 2). The results will be recorded for use in the developed CDE model.
Figure 1. The structure of DE.
T jiG 1 and randb( j ) are trial vector and random number from j = 1,2,….,D. CR and rnbr (i ) are crossover rate and randomly Where
chosen integer number from i = 1,2,….,D. Finally, the selection process is searching good characteristics to next generation. It is shown as follow: T G 1 X iG 1 i G Xi
if ( function _ value(Ti G 1 ) function _ value( X iG ))
(5)
(3)
otherwise
The algorithm uses natural genetic transferring which consists of mutation, recombination or crossover and selection. All process of the algorithm is shown in Figure 1.
Reservoir simulation model Good reservoir operations have to support water requirements and downstream flooding. The objective function of this study was the minimization of the annual sum of squared deviation from desired
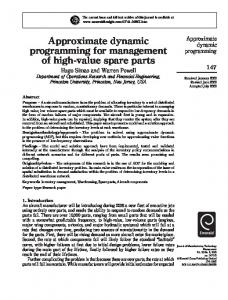
Development of conditional differential evolution model This model is developed to combine an optimization technique (CDE) into a reservoir simulation model for optimum reservoir operational strategies. The structure operation of the model is shown in Figure 2. The CDE requires encoding schemes that transform the decision variables into chromosome (rule curves). Then, the differential evolution operations (reproduction, mutation and crossover) are performed. These CDE operations will generate new sets of chromosomes. The most common encoding schemes use binary strings. In this study, each decision variable represents a monthly level of the rule curves of reservoirs that will be used in the mentioned release policies. After the chromosomes of the initial population have been determined, the release water is calculated by the simulation model using these rule curves. Then, the release water is used to calculate the objective function for evaluating CDE fitness. Next, the reproduction including selection, mutation and crossover is performed for creating new rule curves parameters in the next generation. This procedure is repeated until the criterion is satisfied as shown in Figure 2. There are 24 parameters (upper and lower
5704
Int. J. Phys. Sci.
„t‟, and the amount of maximum water released for without flooding at downstream during the month „t‟, respectively. The constraints are described as follows:
Input data
Smin St Smax
(9)
Omin Ot Omax
Generate the initial population of rule curve parameters
Where S min ,
Smax
(10) and
St
are dead storage of the reservoir,
maximum storage of the reservoir, and storage of the reservoir during the month „t‟, respectively.
create new rule curve parameters The water balance of Lampao reservoir
selection
Fitness value calculation
Illustrative application
crossover
Criteria satisfied?
Stop CDE and obtain the optimal rule curves
Figure 2. Diagram of the searching optimal reservoir operating model.
rule curves for 12 months) which are represented by the chromosomes. The objective function of searching the optimal rule curves was the minimum of the average water shortage (Kangrang and Chaleeraktrakoon, 2007) obtained from the simulation model. The boundary of the search for each generation is limited in order to reduce the fluctuation of the obtained rule curves. The range of searching for the lower and upper rule curves is fixed on the dead storage and normal high water level, respectively. This objective function is described as follows:
Z [ z1, z 2]
(6)
12
z1 min ( Dt Rt ) 2
(7)
t 1
12
z 2 min (Qt QFt )2
(8)
t 1
Where
z1 , Dt , Rt , z 2 , Qt ,and QFt are
are
RESULTS AND DISCUSSION
mutation
Minimize
Omin , Omax and Ot
minimum water release, maximum water release and water release during the month „t‟, respectively.
Drought index, the
amount of water requirement during the month „t‟, the amount of water release from reservoir during the month „t‟, Downstream flood index, the amount of water release from reservoir during the month
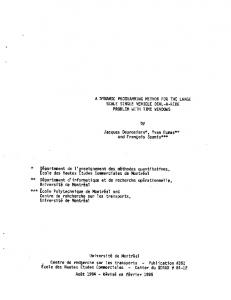
In this research, the model consisted of improved new strategies and optimum technical adaptation for optimal reservoir operating. Lampao reservoir is an important reservoir in the northeast of Thailand. It is located on the Lampao basin as shown in Figure 3 and was the experiment site. The capacity of the reservoir is 1,430 million cubic meters (MCM) with an irrigation covering 2 area of 502.4 km . The average yearly rainfall of the Lampao basin is approximately 1,400 mm/year. The average inflow of the reservoir is 2,230 MCM/year. The maximum flood volume at 500 years of return period is 3 5,482 m /s. The observed monthly-inflow 1986 to 2008 (23 years) is shown in Figure 4. In this study, the DE algorithm was developed and put into a reservoir operation model in order to find an optimal rule curves using the Matlab software. The optimal rule curve can then be applied to an actual scenario depending on whether the rule curve can be used to cover every case or event that might occur. Thus, “HEC-4 monthly stream flow simulation” (HEC-4) model was used to create synthetic inflow data into the monthly inflows of the reservoir as a synthetic data set of 500 events as shown in Figure 5. Then, input synthetic inflow data were used to assess the efficiency of the new rule curves and compare them with the existing rule curves and also between the CDE and CGA models under the same conditions (objective function and constraints). Moreover, the new rule curves were assessed in various other situations, that is, water requirement increases, and inflow decreases to judge the impact of how these things will affect future operations. The reservoir operating model was set to maximum iteration of 1,000 cycles by the user and the control parameters of the model. These parameters were selected by the trial and error method. It was found that the control parameters value of the reservoir operating model of the CDE to provide optimum rule curves were F = 0.8, CR = 0.9 and N = 240. The statistics of trial runs
Hormwichian et al.
Figure 3. Location of the Lampao reservoir.
2500
2000
1500
1000
500
0
Figure 4. The monthly observed inflow data of the Lampao reservoir.
5705
Int. J. Phys. Sci.
Synthetic inflows (MCM)
5706
Figure 5. The synthetic inflow data of 500 events obtained from HEC-4.
Table 1. Statistics of trial runs.
Item CR F N Objective function (MCM)
1 0.2 0.3 240 174.56
Trial runs 2 3 0.6 0.9 0.5 0.8 240 240 77.34 71.13
4 0.95 0.8 240 83.61
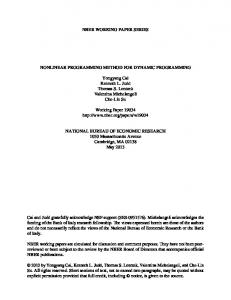
are shown in Table 1. The result of this experiment is represented by optimal rule curves approach as shown in Figure 6. The new rule curves from CDE and CGA were plotted to compare with the existing rule curves. It was found that the rule curves from CDE and CGAs show a similar trend. This is because both the CDE and CGA are a global optimum technique. It is also found that in the dry season (January to May), the lower water storage levels of the new rule curves are lower than the existing rule curves so as to release more water to reduce water scarcity. In the rainy season (June to September), the upper water storage levels of the new rule curves are higher than the existing rule curves so as to reduce water release to mitigate flood damage at downstream. Another, near the end of the rainy season (October to December) water storage scenario was maximized so as
to keep water for the dry season. This will help alleviate water shortages in the next year. Figure 7 shows the comparison of convergence of the optimal solution obtained using CDE and CGA (Hormwichain et al., 2009). In achieving the optimal solution, it was found that the CDE was better global convergence than that of CGA method, and this reveals that the CDE method‟s convergence towards an answer is slightly faster than the CGA method. This is because the DE method has a different structure model than the GA, and the parameters used are real numbers according to the study of Karaboga and Okdem (2004). However, these trends of iteration number are similar to the obtained trend of the other search techniques (Chang et al., 2005; Kangrang et al., 2011). Moreover, the synthetic inflow data of 500 events are obtained to evaluate the performance of CDE. These results are shown in Table 2. It is found that the data obtained from CDE are lower than the data obtained from the existing rule curves. It is considered that the new rule curves could reduce both water shortages in the dry season and floods in the rainy season. In addition, the performances of the new rule curves were evaluated in two situations. The first was an increase of the water requirements between 10 to 30% from the current state. The results are shown in Table 3. It is found that with an increase in water requirements up to 30% from the current state, the data obtained from CDE are lower than the data obtained from the existing
Hormwichian et al.
1600 1,600 1400 1,400
Storage capacity (MCM)
1200 1,200
1000 1,000
800 800
600 600
400 400
200 200
Existing
CGA
CDE
0
0 Jan
Feb
Mar
Apr
May
Jun Jul Month
Aug
Sep
Oct
Nov
Dec
Figure 6. Comparison of rule curves among existing rule curves, CGA rule curves and CDE rule curves.
Figure 7. Convergence characteristics of CGA and CDE model.
5707
5708
Int. J. Phys. Sci.
Table 2. Frequency, magnitude and duration of water shortage and excess water release of the Lampao reservoir system.
Situation
Frequency (times/year)
Rule curves
Water shortage
Existing
CGA
CDE
Excess release water
Existing
CGA
CDE
Magnitude (MCM/year) Average Maximum
Duration (year) Average Maximum
0.926
327.2
669.9
13
16.4
0.049
20.6
85.6
6.3
4.8
0.443
106.3
470.7
2.6
4.2
0.083
22.0
114.9
0.8
1.5
0.402
96.8
411.6
2.1
3.7
0.056
20.2
97.3
0.7
1.3
0.979
922.6
2,738.1
18.2
20.1
0.029
25.2
565.7
6.3
4.3
0.800
698.4
2,593.0
4.5
8.7
0.061
27.3
579.9
1.7
3.0
0.817
707.5
2,631.0
4.8
10.8
0.063
28.1
582.4
1.9
3.4
, Mean; , standard deviation.
Table 3. Frequency, magnitude and duration of water shortage and excess water release of the Lampao reservoir system when the water requirements were increased.
Situation Water shortage
Rule curves Existing (10%*)
CDE (10%*)
Existing (20%*)
CDE (20%*)
Existing (30%*) CDE (30%*)
Frequency (times/year)
Magnitude (MCM/year) Average Maximum
Duration (year) Average Maximum
0.966
403.1
773.1
18.3
20.1
0.032
21.1
92.3
5.8
3.7
0.670
183.6
618.6
3.7
6.9
0.076
24.8
128.1
1.2
2.4
0.982
487.1
883.9
21.6
22.1
0.023
22.4
97.2
3.4
2.1
0.869
285.2
774.1
8.5
13.0
0.054
25.7
136.7
4.4
4.3
0.994
581.5
1008.1
22.8
22.8
0.015
23.8
111.6
1.0
0.5
0.953
389.1
922.3
18.1
19.9
0.033
26.3
142.2
5.8
3.9
Hormwichian et al.
5709
Table 3. Contd.
Excess release water
Existing (10%*)
CDE (10%*)
Existing (20%*)
CDE (20%*)
Existing (30%*)
CDE (30%*)
0.955
841.3
2637.2
14.0
17.4
0.040
25.0
558.2
6.6
4.9
0.742
620.1
2476.7
3.6
7.3
0.062
29.6
576.8
1.2
2.6
0.915
768.1
2548.4
10.0
14.3
0.052
26.7
560.6
5.5
4.7
0.700
565.6
2394.1
3.2
6.5
0.064
30.9
572.3
1.0
2.4
0.882
706.2
2460.2
7.7
12.3
0.057
27.2
546.0
4.2
4.4
0.659
513.6
2310.9
2.8
5.8
0.067
31.1
571.0
0.8
2.0
, mean; , standard deviation; *, increase in the amount of water requirements.
Table 4. Frequency, magnitude and duration of water shortage of the reservoir systems when the inflows were decreased.
Situation
Frequency (times/year)
Rule curves
Magnitude (MCM/year) Average Maximum
Duration (year) Average Maximum
Existing
0.926 0.049
327.2 20.6
669.9 85.6
13 6.3
16.4 4.8
CDE (10%**)
0.577 0.081
154.3 22.8
570.1 124.2
3.3 1.1
5.7 2.0
CDE (20%**)
0.711 0.077
217.2 3.4
668.7 21.8
4.5 0.7
7.8 0.8
CDE (30%**)
0.840 0.066
304.0 21.9
782.7 121.3
7.3 3.6
11.6 4.0
Water shortage
, Mean; , standard deviation; **, decrease in the amount of inflows.
rule curves. This means that an increase in water requirements up to 30% does not affect the water shortage and excess water release when compared with the data from the existing rule curves. The second, a decrease of inflow between 10 to 30% from the current state is used and the results are shown in Table 4. It was found that the inflow decreased to 30% from the current state. The average frequency, average duration, and average magnitude of water shortage from the new rule curves are lower than the existing rule curves even if the inflow decreases. This means that the
new rule curves could help the water shortage in dry season. Therefore, it can be concluded that the new rule curves can solve future reservoir operation problems even considering climate change and population growth.
Conclusions In this study, an optimal rule curve using the CDE model connected with a reservoir simulation model was developed. It considered the criteria of minimum water
5710
Int. J. Phys. Sci.
shortages and downstream flood control. The generating synthetic stream inflow data of 500 events and the present observed data were used to evaluate the performance of new rule curves. The results revealed that new rule curves are more suitable than the existing rule curves because the frequency and magnitude of water shortage and excess water release were less than the existing rule curves. The performance of the new rule curves was better than the existing rule curves in all seasons. When the CDE and the CGA methods were compared, the rule curves from CDE had a good performance record for reservoir operating as the rule curves from CGA. Furthermore, the number of generations of both methods is not significantly different because the solution of model convergence leans toward the same global answers. However, the CDE method still converges towards an answer slightly faster than the CGA method. In the future, the new rule curves can be used to operate effectively when the downstream water requirements increase up to 20 or 30% from the current state and when quantity of the stream inflow decrease down to 20 or 30% from current state. It reveals that the proposed CDE model is an effective method to find optimal reservoir rule curves in all long-term situations. Further in the future, may be to apply this reservoir operating model with multi-reservoir system or short-term forecast for operating the gates.
ACKNOWLEDGEMENTS The authors would like to acknowledge the financial support by the Thailand Research Fund (TRF), Office of the Higher Education Commission and the Mahasarakham University. REFERENCES Adeyemo J, Otieno F (2009). Optimizing planting areas using differential evolution (DE) and linear programming (LP). Int. J. Phy. Sci. 4(4):212-220. Adeyemo J, Bux F, Otieno F (2010). Differential evolution algorithm for crop planning:single and multi-objective optimization model. Int. J. Phy. Sci. 5(10):1592-1599. Bardsiri AK, Rafsanjani MK (2011). Differential evolution algorithms for grid scheduling problem. Int. J. Phy. Sci. 6(24):5682-5687. Chaleeraktrakoon C, Kangrang A (2007). Dynamic programming with the principle of progressive optimality for searching rule curves. Can. J. Civ. Eng. 34(2):170-176. Chang FJ, Lai JS, Kao LS (2003). Optimization of operation rule curves and flushing schedule in a reservoir. Hydrol. Process. 17:1623-1640. Chang FJ, Chen L, Chang LC (2005). Optimizing reservoir operating rule curves by genetic algorithms. Hydrol. Process. 19(11):22772289.
Chau KW, Wu CL, Li YS (2005). Comparison of several flood forecasting models in Yangtze River. J. Hydro. Eng. 10(6):485-491. Cheng CT, Ou CP, Chau KW (2002). Combining a fuzzy optimal model with a genetic algorithm to solve multiobjective rainfall-runoff model calibration. J. Hydrol. 268(1-4):72-86. Esogbue AO (1989). Dynamic programming for optimal water resources systems analysis. Prentice Hall, Englewood Cliffs, New Jersey. Hormwichian R, Kangrang A, Lamom A (2009). A conditional genetic algorithm model for searching optimal reservoir rule curves. J. Appl. Sci. 9(19):3575-3580. Hota PK, Barisal AK, Chakrabarti R (2009). An improved PSO technique for short-term optimal hydrothermal scheduling. Electr. Power Syst. Res. 79:1047-1053. Jain SK, Goel MK, Agarwal PK (1998). Reservoir operation study of sabamati system, India. J. Water Resour. Plan. Manag. 124(1):31-38. Kangrang A, Compliew S, Hormwichian R (2011). Optimal reservoir rule curves using simulated annealing. Proc. Inst. Civil. Eng. Water Manag. 164(WM1):27-34. Karaboga D, Ökdem S (2004). A simple and global optimization algorithm for engineering problems:differential evolution algorithm. Turk. J. Elec. Eng. Comp. Sci. 12(1):53-60. Kumar D, Baliarsingh F (2003). Folded dynamic programming for optimal operation of multireservoir system. Water Resour. Manag. 17:337-353. Lamom A, Thepchatri T, Rivepiboon W (2008). Heuristic algorithm in optimal discrete structural designs. Am. J. Appl. Sci. 5(8):943-951. Li X, Yin M, Ma Z (2011). Hybrid differential evolution and gravitation search algorithm for unconstrained optimization. Int. J. Phy. Sci. 6(25):5961-5981. Liu Y, Sun F (2010). Sensitivity analysis and automatic calibration of a rainfall-runoff model using multi-objectives. Ecol. Inf. 5(4):304-310. Locatelli M (2000). Simulated annealing algorithms for continuous global optimization:convergence conditions. J. Optim. Theor. Appl. 104(1):121-133. Muttil N, Chau KW (2006). Neural network and genetic programming for modelling coastal algal blooms. Int. J. Environ. Pollut. 28(3-4):223238. Price K, Storn R (1997). Differential evolution:a simple and efficient heuristic for global optimization over continuous spaces. J. Glob. Optim. 11(4):341-359. Rezbicek KK, Simonovic SP, Bector BA (1991). Optimization of shortterm operation of a single multipurpose reservoir: A goal programming approach. Can. J. Civ. Eng. 18(3):397-406. Teegavarapu RSV, Simonovic SP (2002). Optimal operation of reservoir systems using simulated annealing. Water Resour. Manag. 16(5):401-428. Wang K, Ye M (2009). Parameter determination of schottky-barrier diode model using differential evolution. Solid-State Electron. 53(2):234-240. Wang WC, Chau KW, Cheng CT, Qiu L (2009). A comparison of performance of several artificial intelligence methods for forecasting monthly discharge time series. J. Hydrol. 374(3-4):294-306. Yeh CH (1997). Applying multiobjective genetic algorithms for planning of flood detention dams system. Taiwan Water Conservancy 45(2):70-81.