Attention, Perception, & Psychophysics 2009, 71 (4), 803-821 doi:10.3758/APP.71.4.803
Dynamic representations underlying symbolic and nonsymbolic calculation: Evidence from the operational momentum effect André Knops and Arnaud Viarouge
INSERM, Unité 562, Gif-sur-Yvette, France CEA, I2BM, NeuroSpin, Gif-sur-Yvette, France and Université Paris-Sud, Orsay, France and
Stanislas Dehaene
INSERM, Unité 562, Gif-sur-Yvette, France CEA, I2BM, NeuroSpin, Gif-sur-Yvette, France Université Paris-Sud, Orsay, France and Collège de France, Paris, France When we add or subtract, do the corresponding quantities “move” along a mental number line? Does this internal movement lead to spatial biases? A new method was designed to investigate the psychophysics of approximate arithmetic. Addition and subtraction problems were presented either with sets of dots or with Arabic numerals, and subjects selected, from among seven choices, the most plausible result. In two experiments, the subjects selected larger numbers for addition than for subtraction problems, as if moving too far along the number line. This operational momentum effect was present in both notations and increased with the size of the outcome. Furthermore, we observed a new effect of spatial–numerical congruence, related to but distinct from the spatial numerical association of response codes effect: During nonsymbolic addition, the subjects preferentially selected numbers at the upper right location, whereas during subtraction, they were biased toward the upper left location. These findings suggest that approximate mental arithmetic involves dynamic shifts on a spatially organized mental representation of numbers. Supplemental materials for this study may be downloaded from app.psychonomic-journals.org/content/supplemental.
Humans are able to represent and process approximate numerosities in a language-independent, analogue fashion (Dehaene, 1997). This capability, referred to as number sense, can be demonstrated already very early in life. In particular, Xu and Spelke (2000) showed that 6-month-old infants could discriminate between large numerosities of 8 or 16 elements, and McCrink and Wynn (2004) showed that 9-month-old infants expected the approximate outcome of operations such as 10 2 5 or 5 1 5 performed on sets of dots. Humans seem to share this capability with many other species, including rats, pigeons, parrots, dolphins, lions, and primates (Dehaene, 1997). The variability of the responses increases linearly with the size of the numerosities involved, thus conforming to Weber’s law. Similar numerical competence has been observed in monkeys that could discriminate between visual sets of objects on the basis of numerosity alone (Brannon & Terrace, 1998, 2000). The tight psychophysical parallels between these data and those observed in humans (Cantlon & Bran-
non, 2006) suggest a common basis for number sense in phylogeny. Indeed, at the neuroanatomical level, converging evidence from electrophysiological studies in the macaque monkey (Nieder, Freedman, & Miller, 2002; Nieder & Miller, 2004), human neuroimaging studies (Dehaene, Piazza, Pinel, & Cohen, 2003; Piazza, Izard, Pinel, Le Bihan, & Dehaene, 2004; Piazza, Pinel, Le Bihan, & Dehaene, 2007), and patient studies (Dehaene & Cohen, 1997) points to the bilateral horizontal segment of the intraparietal cortex as being crucial for representing numerical magnitudes. In this area, numerosity is encoded by neurons tuned to approximate number: A quantity such as 4 is represented by the distributed activity of overlapping neurons that prefer about three, about four, or about five objects (Nieder et al., 2002; Nieder & Miller, 2004). Importantly, in humans at least, this representation seems to be abstract, in the sense that both symbolic (i.e., Arabic numerals) and nonsymbolic (e.g., dot patterns) numerosities access this representation (Piazza et al., 2007).
A. Knops,
[email protected]
803
© 2009 The Psychonomic Society, Inc.
804 Knops, Viarouge, and Dehaene This is in accordance with the view that during development, number symbols such as number words and Arabic numerals are being mapped onto the existing analogue magnitude representation (Gallistel & Gelman, 1992). An important difference between symbolic and nonsymbolic arithmetic, however, is the higher precision that can be achieved with number symbols (Pica, Lemer, Izard, & Dehaene, 2004). At the neurophysiological level, a theoretical model has been proposed that relates this higher precision to narrower tuning curves of the neurons coding for symbolic magnitudes, so that some neurons, at least, would become sharply tuned to precisely four objects, not three or five (Verguts & Fias, 2004). In contrast to the vast knowledge about the representation and neural correlates of numerical magnitude, little is known about the exact mechanisms and neural structures that combine these magnitudes during mental calculation. Characterizing the psychophysical laws of approximate mental arithmetic, with both symbolic and nonsymbolic numerals, is the main goal of the present study. Nonsymbolic calculation in this context means the mental manipulation (addition and subtraction) of quantities presented as dot patterns. Delineating the properties and mechanisms of nonsymbolic arithmetic may help us to understand the nature and development of symbolic arithmetic. At present, only a few experiments are available on this topic. In a series of experiments, Barth et al. (2006) showed that human adults and 5-year-old children were capable of mastering basic arithmetic operations (i.e., addition and subtraction) with nonsymbolic stimuli (dot patterns). In particular, children showed above-chance performance in an addition task, although they performed no better than chance on a symbolic version of this task. A detailed mathematical theory of the results was developed, suggesting that variability arose both from the imprecise representation of the operands and from the representation of the computed result. However, the task (decide whether the outcome of an operation is larger or smaller than a specified numerosity) did not afford any possibility of revealing putative biases in the computed addition or subtraction results. Recently, Gilmore, McCarthy, and Spelke (2007) showed that 5-year-old children’s performance in symbolic calculation tasks is marked by characteristics similar to those of their nonsymbolic arithmetic system, suggesting that they relied on their nonsymbolic number knowledge to solve approximate symbolic calculation problems. Cordes, Gallistel, Gelman, and Latham (2007) investigated the contribution of different sources of variation in a task in which subjects were told to compute the sum or the difference of two nonsymbolic quantities (arhythmic series of brief flashes) and to produce the result n by pushing a button n times. The authors compared the normalized residuals of several regression models that took into account different factors, such as the variability of the individual operands of a given problem or the variability due to the sum or the difference between the operands—that is, the outcome of a problem. The major determinant of variability in nonverbal arithmetic arose from the representation of the individual numerical magnitudes entering into the
calculation process, rather than from mental computation or motor production processes. Using a different task (decide whether a proposed numerosity is or is not the correct result of an operation), McCrink, Dehaene, and Dehaene-Lambertz (2007), too, found evidence that mental calculation with nonsymbolic numerosities follows Weber’s law. They showed that for additions and subtractions with dot patterns matched for physical factors other than numerosity, both the mean number chosen by the participants and the variability of these chosen numbers increased with the correct outcome. Surprisingly, however, the values chosen by the subjects were not centered on the correct result but were influenced by the arithmetic operation that had to be carried out. With mental addition, the subjects’ estimated outcomes tended to be larger than the actual outcomes, whereas they tended to be smaller than the actual outcomes with subtraction. McCrink et al. (2007) argued that this bias showed similarity to a perceptual phenomenon called representational momentum (Freyd & Finke, 1984). When they watch a moving object suddenly disappear, subjects tend to misjudge its final position and report a position displaced in the direction of the movement (Halpern & Kelly, 1993; T. L. Hubbard, 2005; Kerzel, 2003). Analogously, McCrink and colleagues described their finding as an operational momentum (OM), since the misjudgment was related to the arithmetic operation carried out, and suggested that the subjects were moving “too far” on the number line. The assumed parallels between representational momentum and the OM are in line with the hypotheses made by Hubbard and colleagues concerning the possible interplay of the posterior parietal lobes and the horizontal aspects of the intraparietal cortex during calculation (E. M. Hubbard, Piazza, Pinel, & Dehaene, 2005). Speculatively, mental calculation was proposed to correspond to a displacement on the spatially organized mental representation of numerical magnitude. This displacement might be mediated by the same parietal mechanisms as those involved in guiding saccadic eye movements. Since larger numbers are represented to the right side of space on the mental representation and smaller numbers to the left, this would yield rightward “movements” with addition and leftward “movements” with subtraction. Moreover, it has been shown that saccade latencies to the left or to the right covary parametrically with the numerical size of previously presented numbers (Fischer, Warlop, Hill, & Fias, 2004). Larger numbers were more rapidly followed by saccades to the right, and smaller numbers by saccades to the left. This points to a systematic and parametric relation between numerical magnitude and shifts of spatial attention, which, in turn, are thought to be mediated by oculomotor circuits (Sheliga, Riggio, & Rizzolatti, 1994). Given the cortical parallels between circuits for eye movements and those for mental arithmetic, one might wonder what determines the OM effect. Sticking with the metaphor of perceiving calculation as motion along a mental number line, what determines this movement? Does the numerical magnitude of the operands determine the size of the OM effect? In the case of actual movement
Momentum in Approximate Calculation 805 and perceptual representational momentum, the effect is known to be modulated by several factors (for a review, see T. L. Hubbard, 2005): The amount of misjudgment is stronger for movements to the right (Halpern & Kelly, 1993), increases with increasing speed of the moving object (Freyd & Finke, 1985), and is larger with apparent, as compared with smooth, motion when the gaze is fixed (Kerzel, 2003). Interestingly, the effect can be increased by a secondary task that involves counting onward up to 30 in steps of one, two, or three (Halpern & Kelly, 1993). Relative to this background, the present study had several goals. First, we systematically investigated the influence of the numerical magnitude of operands on the OM effect. As we described above, the representational momentum effect is influenced by several factors, such as speed of the moving object, the presence of landmarks, or representational gravity (T. L. Hubbard, 2005). In contrast, it is largely unknown what factors determine the OM effect. Since it has been found that saccadic eye movements are systematically related to the numerical magnitude of a previously presented number, the attentional shifts that accompany mental arithmetic might systematically covary with the numerical magnitude of the operands. This might, in turn, change the amplitude of the OM effect. To study this influence in more detail, we introduced a method of assessing the psychophysical properties of symbolic and nonsymbolic calculation that was more efficient than the method used in McCrink et al. (2007). After presenting an arithmetic problem (e.g., 48 dots 1 21 dots), instead of presenting subjects with a single proposed result (e.g., 69 dots) and asking them to evaluate its correctness with a yes/no answer, we increased the amount of information gained per trial by presenting subjects with seven closely spaced alternatives on each trial (e.g., 35, 41, 49, 58, 69, 82, and 98; note that numerical spacing between response alternatives is linear on a log scale) and directly recording their preferred outcome. This method presents the advantage of yielding, on each trial, an estimate of the subjects’ arithmetic estimate, almost as if the subjects had given a spoken response, yet without requiring the actual production of any number words. Importantly, this response mode could be used identically for problems in both symbolic and nonsymbolic notation. Second, we investigated whether OM is restricted to nonsymbolic calculation or can also be observed in symbolic calculation (i.e., using Arabic numbers). Finding similar effects for both notations would support the assumption that both nonsymbolic and symbolic magnitudes are represented on a common mental scale and that approximate calculation with symbolic operands also relies on this mental number line (Dehaene, Spelke, Pinel, Stanescu, & Tsivkin, 1999). The present data set allowed for a precise quantitative estimation of the size of the OM effect and of its variation with operation type, as well as with the size of the operands. Through such analyses, we hoped to delineate the determinants of the OM effect and gain a more thorough understanding of the underlying mechanisms, thus clarifying whether they are common to symbolic and nonsymbolic calculations.
Finally, a third goal was to probe putative associations between arithmetic operations and movements in space. E. M. Hubbard et al. (2005) speculated that shared parietal mechanisms could be involved in guiding eye movements and calculations on the mental number line, so that addition would be analogous to a rightward motion and subtraction to a leftward motion. If such an internal sense of spatial motion accompanies mental arithmetic, we might expect the subjects’ responses to be spatially biased as a function of the type of operation they performed. In our experiment, the seven proposed choices were presented in a circular array, making it possible to measure any spatial preference, both on the left–right and on the top–down axes, as a function of problem type. If E. M. Hubbard et al.’s prediction holds, we should expect to find more rightward responses to addition problems and more leftward responses to subtraction problems. Experiment 1 Method
Subjects. Sixteen volunteers (9 female; mean age 5 23.5 years; SD 5 3.6; range, 19–34 years) took part in the experiment after having given their written informed consent. All but one were righthanded, according to the Edinburgh Handedness Inventory (Oldfield, 1971). Stimuli. We first selected 18 calculation problems, 9 additions and 9 subtractions. The operands were identical for addition and subtraction (see Table 1). The first operand was 32, 48, or 60. The second operand was created in relation to the first operand—that is, as a fixed proportion of the first operand, being 31%, 45%, or 61% for small, medium, and large second operands, respectively. Together, the combinations of these three initial values (i.e., small, medium, and large first operand) and three amounts of change (i.e., small, medium, and large second operand) generated 3 3 3 5 9 problems. Apart from the correct result, eight deviant results were created for each arithmetic problem. These deviants were arranged as a geometric series (i.e., were linearly spaced on a logarithmic scale) and ranged from double the correct result to half the correct result [technically, they were generated as round(c 3 2i/4), where c is the correct result and i ranges from 24 to 14]. To avoid a strategy of always selecting the response falling in the middle of the proposed range, only seven out of those nine possible results were presented. On 50% of the trials, we presented the upper seven (high range), and thus the correct result was the third largest numerosity (although numerosities were randomly mixed with respect to both spatial position on the screen and temporal order of appearance [see the Procedure section below]). On the other 50% of the trials, the lower seven choices were shown (low range), and the correct result was therefore the fifth largest numerosity. Because the experimental design was organized around a small number of arithmetic problems, it was important to prevent the subjects from memorizing them in symbolic form. To this aim, the problems and their proposed results were randomly “jittered,” differently on each trial. First, the operands were jittered by a random value from 0 to 62, so that the actual outcome would remain unchanged (i.e., for a given task 48 1 18, the jittered operands could be 47 1 19). Second, all of the seven proposed results were jittered up or down by a random value (fixed for a given trial). This random value had a mean value of zero and was drawn from a flat distribution on a logarithmic scale, in the range plus or minus half the numerical interval between the correct result and the first deviant above or below it. Technically, this was achieved by drawing a random number r between 20.5 and 0.5 and defining the proposed results as round(c 3 2(r1i)/4), where i again ranges from 24 to 14.
806 Knops, Viarouge, and Dehaene Table 1 All Basic Arithmetic Problems Presented in Experiment 1 and Their Correct and Deviant Results Operands O1 O2
1/2
1/1.7
Results and Mean Deviants (Not Jittered) 1/1.4 1/1.2 1/1 1.2/1 1.4/1
32 32 32 48 48 48 60 60 60
9 14 19 15 21 29 19 29 38
21 23 26 32 35 39 40 45 49
24 27 30 37 41 46 47 53 58
29 33 36 45 49 54 56 63 69
32 32 32 48 48 48 60 60 60
9 14 19 15 21 29 19 29 38
12 9 7 17 14 10 21 16 11
14 11 8 20 16 11 24 18 13
16 13 9 23 19 13 29 22 16
Addition 34 39 43 53 58 65 66 75 82
1.7/1
2/1
41 46 51 63 69 77 79 89 98
49 55 61 75 82 92 94 106 117
58 65 72 89 98 109 112 126 139
69 77 86 106 116 129 133 150 165
82 92 102 126 138 154 158 178 196
Subtraction 19 23 15 18 11 13 28 33 23 27 16 19 34 41 26 31 18 22
27 21 15 39 32 23 49 37 26
33 25 18 47 38 27 58 44 31
39 30 22 55 45 32 69 52 37
46 36 26 66 54 38 82 62 44
Note—The actual problems presented to the subjects were jittered by a small random amount (see the Method section), such that the correct outcome was never presented.
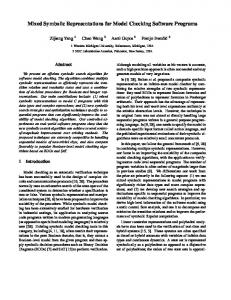
For example, for the problem 32 1 9 5 41, with the closest deviants being 34 and 49, the closest proposed result could be jittered anywhere from 38 5 round(41 3 220.5/4) to 45 5 round(41 3 210.5/4). We ensured that the correct outcome would never appear as a response alternative. All the proposed results fell between 6 and 217. All the problems were presented both in Arabic notation and as dot patterns (Figure 1 shows an example of a nonsymbolic trial). The notation of response alternatives in a given trial was always identical with the notation of the operands. Both notations were displayed in black within a colored circle that was presented on a black background. Each circle had a diameter of 120 pixels (3.55 cm) at a viewing distance of approximately 65 cm (no chinrest was used). Seven different colors were used for the results, whereas the operands’ colors were identical (this color manipulation played no role in the present experiment but was designed as a control for a future neuroimaging experiment). The operands were presented successively in the center of the screen. The results were presented at seven locations arranged around the screen center in an ellipsoid fashion. The seven proposed outcomes were counterbalanced in a Latin square, so that the number closest to the correct result appeared once and only once at each location, for each notation and operation. To prevent the use of nonnumerical cues, the sets of dots representing the nonsymbolic numerosities were designed and generated, using MATLAB, in such a way that dot size changed but total dot area in a given set was always fixed across stimuli. Thus, total occupied area could not serve as a cue for distinguishing between the different numerosities. As a result of this manipulation, average item size covaried inversely with numerosity during the presentation of the operands (i.e., sets with smaller numerosities had larger dots). To avoid memorization effects due to repetition of a particular stimulus, on each trial, the stimulus images were randomly chosen from a set of 10 precomputed images with the given numerosity. Procedure. A total of 504 trials were presented in 14 blocks. After each block, the subjects were given a chance to rest. Trial structure is shown in Figure 1. Each trial started with the presentation of a fixation cross for 250 msec, which was followed by a blank screen for 150 msec and an uppercase letter (“A” for addition or “S” for subtraction; 1,400 msec) indicating the subsequent operation to be performed. After the instruction letter had disappeared, the two operands
were presented for 1,000 msec each (Arabic notation) or 1,500 msec each (nonsymbolic notation). Finally, the screen was emptied, and seven proposed results appeared, one by one, every 190 msec, at one of seven possible locations and remained on the screen until response. The notation of the operands always was identical to that of the response alternatives in a given trial. The temporal and spatial order (and thus the numerical order of the response alternatives) in which the seven response alternatives appeared on the screen was randomized for each trial, with the constraint that each response alternative appeared only once at each position in the course of the experiment. After the appearance of the last response alternative, the mouse pointer appeared in the center of the screen, and the subjects had to indicate which numerosity was numerically closest to the actual result by clicking on the respective image. Speed was stressed over accuracy in order to maximize the use of approximation strategies and to avoid explicit calculation (Arabic numerals) or counting (dot patterns). During the experiment, no feedback was provided to the subjects. The whole experiment lasted approximately 85 min. The paradigm was created using Python 2.4 software (python.org) run on a portable personal computer (Siemens/Fujitsu; 1.6 GHz).
Results Because the subjects occasionally reported selecting the wrong operation (subtraction instead of addition), we first trimmed the data to exclude all responses outside a three standard deviations range around a subjects’ overall mean of the difference between the logarithm of the subjects’ choice and the logarithm of the correct value (see below). This procedure excluded 1.8% of all the responses. Nonrandom distribution of responses. To start with, we checked whether the subjects chose among the proposed choices at random. On each trial, seven response alternatives were presented. The experimental design included two trial types, which were distinguished by whether the result closest to the correct outcome was the third or the fifth alternative in numerical order (naturally, these choices were
Momentum in Approximate Calculation 807
A
Tim
e
1,400 msec
1,500 msec A
1,500 msec Figure 1. Screenshots taken from a trial with nonsymbolic addition to illustrate the task and the trial sequence. After an initial appearance of the letter “A” or “S,” indicating addition and subtraction, respectively, the first and second operands successively appeared in the center of the screen. The response alternatives were presented on screen in random order, separated from each other by a delay of approximately 190 msec to direct the subjects’ attention to each of the response alternatives. For trials in symbolic notation, the general layout of the trials was identical. Instead of presenting a set of black dots, black Arabic numbers were presented in the center of the colored circles.
presented to the subjects in random order). If the subjects were able to solve the arithmetic problems, their response choices should show a nonflat distribution, presumably centered close to the correct value (neglecting for the moment the OM effect) and, therefore, shifting across those two trial types. In contrast, if they responded randomly, we would not expect any differences in the frequency of choosing a particular response alternative. In Figure 2, we plot response frequency for each notation and each operation, separately for trials in which the correct answer was third or fifth. Responses were clearly distributed nonrandomly. For symbolic notation, the peak of the distribution was always centered on the response alternative closest to the correct outcome. This also held for nonsymbolic addition, although the distributions were broader, implying a larger variability for nonsymbolic than for symbolic notation. For nonsymbolic subtraction, the subjects always preferred the smallest possible outcome, suggesting an underestimation bias that will be analyzed further below. These conclusions were supported by an ANOVA over the different response categories, with percentage of choice as the dependent variable and rank of the subject’s choice (one to seven) and trial type (third or fifth value correct) as factors. Only for nonsymbolic addition was there no effect of rank [F(6,90) 5 2.02, p 5 .141]. For all the other operations in either notation, a main effect of rank significantly influenced the subjects’ choices (all
ps , .001). Most important, however, for each operation and in each notation, a significant rank 3 range interaction was observed (all ps , .001). Linear increase of response and response variability with the correct result. We next examined how the subjects responded to our different arithmetic problems. The left column of Figure 3 shows the subjects’ mean responses (chosen values) as a function of the size of the correct result, separately for the two notations (Figures 3A and 3B) and the two operations. If the subjects were able to solve the arithmetic problems, the chosen value should increase as a function of the correct outcome for both nonsymbolic and symbolic notation. With increasing numerical magnitude, theory predicts an increasing variability of the chosen values (see the appendix in Barth et al., 2006). Finally, according to Weber’s law, the increase in the chosen values should be paralleled by a proportional increase in response variability, as expressed in terms of their respective standard deviation, resulting in a constant coefficient of variation (CV, the ratio of the standard deviation and mean of the subjects’ responses) across arithmetic problems of different numerical magnitude. As can be seen in Figure 3, the subjects’ responses (depicted as circles in Figure 3) increased as a function of the correct outcome for both addition (black circles) and subtraction (gray circles) and in both notations. This impression was confirmed by one-way repeated mea-
808 Knops, Viarouge, and Dehaene
A
Nonsymbolic Notation High range
50
Low range
45
45
40
40
Percentage Chosen
Percentage Chosen
50
35 30 25 20 15
35 30 25 20 15
10
10
5
5
0
0 1
2
3
4
5
6
7
1
2
Response Category
4
5
6
7
6
7
Response Category
B
Symbolic Notation
90
90
80
80
70
70
Percentage Chosen
Percentage Chosen
3
60 50 40 30
60 50 40 30
20
20
10
10
0
0 1
2
3
4
5
6
7
Response Category
1
2
3
4
5
Response Category
Figure 2. Distribution of the subjects’ choices across the seven proposed results, averaged over all arithmetic problems, separately for addition (left column) and subtraction (right column) in nonsymbolic (A) and symbolic (B) notation. The subjects’ responses were not distributed randomly but, rather, depending on the range of response alternatives presented (high or low range), were centered around the value that was closest to the correct outcome (fifth for low range and third for high range). Additional influences of operation (smaller choices for subtraction than for addition) and of notation (underestimation bias for nonsymbolic, as compared with symbolic, notation) are also visible.
sures ANOVAs, separately for each operation and each notation, with problem size as the only factor. A highly significant linear trend was observed1: for nonsymbolic addition [F(8,120) 5 180.52, p , .001, ε 5 .46; ε denotes the Huynh–Feldt term (Huynh & Feldt, 1976) of correction for nonsphericity] and subtraction [F(8,120) 5 212.27, p , .001, ε 5 .73], as well as for symbolic addition [F(8,120) 5 2,460, p , .001, ε 5 .98] and subtraction [F(8,120) 5 558.51, p , .001, ε 5 .85]. A similar repeated measures ANOVA over the standard deviations (squares) of the mean chosen values showed that the subjects’ choices became more and more variable
with increasing numerical size of the result. This was true for both addition (black) and subtraction (gray) with the nonsymbolic notation [Figure 3A; F(8,120) 5 42.57, p , .001, ε 5 .88, and F(8,120) 5 23.02, p , .001, ε 5 .78, respectively] and with the symbolic notation [Figure 3B; F(8,120) 5 27.01, p , .001, ε 5 .68, and F(8,120) 5 15.61, p , .001, ε 5 .88, respectively]. As can be seen in the lower left parts of Figure 3A and 3B, the CV was essentially constant across the whole range of outcomes for addition and subtraction with both notations. This was tested statistically with the same four repeated measures ANOVAs, with problem size as the
Momentum in Approximate Calculation 809
A
Nonsymbolic Calculation 50
100
40
80
1.8
30
60 20
40
1.4 10
20
0
0 0.4
CV
2.2
Log Chosen Value
Addition Subtraction
SD
Mean Chosen Value
120
1 1
1.4
1.8
2.2
Log Correct Outcome
0.2 0 0
20
40
60
80
100
120
Linear Correct Outcome
B
Symbolic Calculation 40
100
1.8
25 20
60
15
40
1.4
10 20
Log Chosen Value
30 80
5 0
0 0.4
CV
2.2
35
SD
Mean Chosen Value
120
1 1
1.4
1.8
2.2
Log Correct Outcome
0.2 0 0
20
40
60
80
100
120
Linear Correct Outcome Figure 3. Left column: Mean responses (chosen values, squares) of the subjects and standard deviations (circles) plotted against the correct outcome for both nonsymbolic (A) and symbolic (B) addition and subtraction. The lower part of panels A and B depicts the coefficient of variation (CV, diamonds)—that is, the ratio of standard deviation and mean chosen value, plotted against the correct outcome. Right column: The logarithm of the correct outcome plotted against the logarithm of the mean value chosen by the subjects for nonsymbolic (top) and symbolic (bottom) notation. The gray line indicates a ratio of 1—that is, perfect performance.
only factor. For nonsymbolic notation, indeed, the CV did not change as a function of the correct outcome, either for addition (F , 1) or for subtraction [F(8,120) 5 1.65, p 5 .121, ε 5 .97]. For symbolic notation, this was true only for subtraction [F(8,120) 5 1.27, p 5 .277, ε 5 .77], whereas a significant main effect of problem size was obtained for addition [F(8,120) 5 2.90, p 5 .007, ε 5 .91]. Constant response variability on a logarithmic scale. If Weber–Fechner’s law holds for both symbolic and nonsymbolic calculation, the data should show constant response variability once plotted on a double-logarithmic
scale (log of the subjects’ responses as a function of the log of the correct results; Dehaene et al., 2003). Therefore, we calculated the difference between the correct outcome and the mean chosen value, once both of them had been transformed to a logarithmic scale, and calculated a repeated measures ANOVA on the standard deviations of these differences, with factors of notation (nonsymbolic and symbolic) and size of the correct result, separately for both operations (addition and subtraction). Once transformed to a logarithmic scale, the size of the outcome did not systematically influence response vari-
810 Knops, Viarouge, and Dehaene Nonsymbolic Notation
Choice Frequency (%)
50 Subtraction 18 Subtraction 41 Addition 41 Addition 98
40 30 20 10 0 0
50
100
150
200
Chosen Number Figure 4. Sample distributions of responses to four nonsymbolic arithmetic problems: the nonsymbolic subtraction problem yielding the smallest value (18), the addition yielding the largest value (98), and the addition and subtraction problems resulting in the same numerical outcome of 41. In each case, quantiles are shown (1%, 5%, 10%, 25%, 50%, 75%, 90%, 95%, and 99%). Note the clear difference between addition and subtraction problems with the same outcome, which is a manifestation of operational momentum.
ability. For both operations, the main effect of problem size failed to reach significance [F(8,120) 5 0.88, p 5 .52, ε 5 .78, and F(8,120) 5 1.61, p 5 .14, ε 5 .87, for addition and subtraction, respectively]. This analysis thus confirmed that Weber’s law held and that performance was determined mostly by the ratio of true outcome and chosen value (or equivalently, by the difference of their logs). However, there were systematic differences between the notations for both operations [F(1,15) 5 94.80, p , .001, and F(1,15) 5 325.82, p , .001, respectively]: Variability was higher for dot patterns than for Arabic numerals. Since problem size did not influence the results, we carried out a 2 3 2 repeated measures ANOVA with the factors of notation and operation to evaluate possible interactions between these factors. The two main effects indicated that response variability was higher for the nonsymbolic notation than for the symbolic notation [F(1,15) 5 284.73, p , .001] and when the subjects were engaged in subtraction, as compared with addition [F(1,15) 5 12.56, p 5 .003]. A significant interaction of both factors [F(1,15) 5 33.93, p , .001] indicated that variability of the responses was higher for subtraction than for addition only for symbolic notation [t(15) 5 7.28, p , .001], whereas for nonsymbolic notation, no significant difference was observed [t(15) 5 1.27, p 5 .23]. This might point to different underlying processes when Arabic numerals are dealt with (exact calculation for addition vs. more approximate processes for subtraction), whereas no differences were observed for calculation with dot patterns. Taken together, these results suggest, as predicted by Weber’s law, that the logarithms of the numbers involved provide a more compact description of the data. Therefore, all the following analyses were carried out in a logarithmic scale, using as input the difference between the
logarithm of the correct outcome and the logarithm of the chosen value. Such analyses also present the advantage of meeting the prerequisites of the ANOVA, which stipulates that all data have a fixed variability. Operational momentum. Although the subjects’ responses increased roughly linearly with the correct result, as is shown in Figure 3, the slope of increase tended to be shallower for subtraction than for addition (especially for nonsymbolic operations). Figure 4 shows the distribution of the subjects’ responses for a few selected nonsymbolic addition and subtraction problems, including the case in which the two operations had an identical outcome (41). It can be seen that the subjects’ responses tended to be higher for addition than for subtraction. The fact that, for equal objective outcomes, the subjects tended to anticipate a smaller outcome for a subtraction than for an addition problem (McCrink et al., 2007) might be taken as a manifestation of the OM effect. To quantify this OM effect, we computed a simple estimate of response bias: the mean difference between the log of the subject’s responses and the log correct result (see Figure 5). This value was first submitted to a simple ANOVA with notation and operation as factors. A main effect of notation [F(1,15) 5 51.39, p , .001] indicated an overall tendency toward underestimation for the nonsymbolic notation, as compared with rather precise performance for the symbolic notation. Most important, a main effect of operation [F(1,15) 5 21.58, p , .001] provided evidence for an OM effect—that is, a significant bias toward smaller responses for subtraction than for addition. The significant interaction [F(1,15) 5 24.92, p , .001] was due to a larger difference between operations for nonsymbolic notation, as opposed to symbolic Response Bias
Nonsymbolic Subtraction
Nonsymbolic Addition
Symbolic Subtraction
Symbolic Addition
–0.10
–0.05
0
0.05
0.10
Log (Chosen Value) – Log (Correct Outcome) Figure 5. Mean response bias, defined as the difference between the chosen value and the correct outcome, both expressed on a log scale. A negative bias indicates underestimation, and a positive bias indicates overestimation.
Momentum in Approximate Calculation 811 notation [t(15) 5 24.99, p , .001]. Crucially, however, subtraction yielded significantly smaller values than did addition with both notations [t(15) 5 24.84, p , .001, for nonsymbolic notation, and t(15) 5 2.73, p , .001, for symbolic notation]. McCrink et al. (2007) explored the OM effect only with nonsymbolic numerosities; the present results provide the first evidence that this effect holds also during approximate symbolic calculation with Arabic numerals. There was, however, another important difference between notations (see Figure 5). For symbolic operations, the OM took the form of a full crossover effect, with positive deviations relative to the correct result for addition (overestimation) and negative deviations for subtraction (underestimation). For nonsymbolic operations, however, the OM effect was superimposed onto a general tendency to underestimate the correct result. This finding may relate to a general tendency to underestimate the number of dots in visual displays, as has been reported by others (Izard & Dehaene, 2008; Krueger, 1984). Note that we propose to apply a definition of the momentum effect that differs from the more stringent one used in the visual domain. In the domain of representational momentum, to speak of a significant momentum effect requires the data to have the form of a full crossover effect—that is, values that significantly deviate from zero for both directions, positively and negatively, as a function of movement direction. In the numerical domain, however, we propose to speak of a momentum effect as soon as there is a difference in the mean responses to matched addition and subtraction problems, even if the responses for both operations differ from zero with the same sign, as is the case for nonsymbolic notation in the present study. This stance is useful because numerical data are often affected by an additional general tendency to underestimate the results (Izard & Dehaene, 2008). The key new finding is that this underestimation tendency is modulated by the arithmetic operation, yielding considerable underestimation for subtraction and near-correct values for addition. This interaction in itself can be interpreted as evidence for an OM effect. This point becomes most evident for those problems with identical results: As is shown in Figure 4, even for these objectively equal problems, addition resulted in larger subjective responses than did subtraction (this effect was explored further in Experiment 2). Influence of the arithmetic operation on the spatial distribution of responses. Since each proposed result appeared equally frequently at each of the seven spatial positions on the screen, by chance alone, we would expect responses to be equally distributed over these different positions. However, if one assumes that calculation resembles a spatial displacement on the mental number line via shifts of spatial attention (E. M. Hubbard et al., 2005), one might expect this internal movement to influence the position of the subjects’ responses. Our paradigm therefore offered a unique opportunity to directly test one of the assumptions made by Hubbard and colleagues (E. M. Hubbard et al., 2005): If addition induces a shift of spatial attention to the right and subtraction to the left, this might bias the subjects’ clicking on the right or left side of the screen.
Figure 6 depicts the mean percentage with which each of the seven positions on screen was chosen, averaged over subjects, separately for the two types of notations for each type of operations. It is obvious that the data are not equally distributed over the seven positions for each of the four notation 3 operation combinations. Particularly in nonsymbolic notation, there is a clear spatial bias, with addition yielding more rightward responses and subtraction more leftward responses. We tested this by computing two 2 3 2 repeated measures ANOVAs with factors of operation and position for the two top right and top left positions only (separately for nonsymbolic and symbolic stimuli). For nonsymbolic stimuli, the critical interaction between operation and position was significant [F(1,15) 5 6.30, p 5 .024, ε 5 1], indicating a differential pattern of spatial responding as a function of operation. For symbolic stimuli, no such interaction was present [F(1,15) 5 1.88, p 5 .19], although a trend in the same direction can be seen in Figure 6. As an additional statistical test of this effect, a simple 2 3 2 contingency table served as input for computing a χ2 test over the two positions (top left or top right) for each operation (addition or subtraction). For nonsymbolic notation, a significant χ2 test [χ2(1) 5 5.60, p 5 .018] confirmed that the spatial distribution of responses varied with the type of arithmetic operation. For symbolic notation, no significant effect was found [χ2(1) 5 0.29, p 5 .59]. Discussion We replicated the OM effect observed by McCrink et al. (2007) with a multiple choice paradigm. Subjects tended to misjudge the outcome of a mental calculation. The misjudgment was a function of the notation and the operation carried out. In accordance with earlier reports (e.g., Izard & Dehaene, 2008), the subjects generally tended to underestimate results presented in nonsymbolic form. However, this underestimation bias was modulated by the arithmetic operation: In accordance with the OM, the difference between the preferred and the correct results (response bias) was more positive for addition than for subtraction. This OM effect was very strong for nonsymbolic notation, but it was also significant for symbolic notation. The fact that the OM effect is smaller for symbolic stimuli is not surprising, since it merely reflects the subjects’ higher precision with symbolic than with nonsymbolic stimuli. However, the mere presence of such an effect for calculation with Arabic numerals is an important novel finding, since it suggests that a similar analogue magnitude representation is used during symbolic and nonsymbolic approximate arithmetic. Finally, a new finding was that arithmetic operation biased the spatial distribution of responses: The subjects preferentially selected values presented at the upper left position of the computer screen with nonsymbolic subtraction and values presented at the upper right position with nonsymbolic addition. For symbolic notation, a similar but smaller and nonsignificant trend was found. Again, this is presumably because there was not much room for such a bias, given that the subjects so frequently selected the
812 Knops, Viarouge, and Dehaene Nonsymbolic Subtraction
Nonsymbolic Addition 20 7
1
20 2
15
7
10
6
3
5
6
3
4
5
1
20 2
15
7
1 2
15
10
10
6
3
5
4
Symbolic Subtraction
Symbolic Addition
7
2
15
10
20
1
6
4
3
5
4
Figure 6. The space–operation association of responses effect. The graph shows the mean percentage with which a certain location was selected, separately for each notation and each operation. Gray dotted lines represent theoretical expectations under the assumption of perfect performance (100/7 < 14%). The subjects were biased toward an upper right location for addition problems and toward the upper left location for subtraction problems, at least for nonsymbolic operations.
value closest to the correct result. Overall, the results are consistent with the notion of a cross-talk between spatial and arithmetic operations, as predicted by E. M. Hubbard et al. (2005). We propose to refer to this novel effect as the space–operation association of responses (SOAR) effect. Although this finding may point to interactions between calculation and space, as predicted by E. M. Hubbard et al. (2005), the present experiment alone does not allow one to conclude whether this bias is truly due to the operation being carried out. An alternative possibility is that it arose from the numerical magnitude of the response choices presented on screen, because, in Experiment 1, the operands were identical for addition and subtraction and, as a consequence, the outcomes were systematically larger for addition than for subtraction. It is therefore possible that the subjects were spatially biased by the larger numerosities present on screen (a simple variant of the spatial numerical association of response codes [SNARC] effect [Dehaene, Bossini, & Giraux, 1993]), rather than by the preceding arithmetic operations. In order to clarify this point, we conducted a second experiment very similar to the first one, but with constant outcomes. Instead of using identical operands for addition and subtraction, we manipulated the operands of the addition and subtraction problems so that their correct
outcomes were identical. All other experimental details remained unchanged. Experiment 2 Method
Subjects. Eighteen volunteers (15 female; mean age 5 22.5 years, SD 5 2.4 years; range, 19–26 years) took part in the experiment after having given their written informed consent. All but one were right-handed according to the Edinburgh Handedness Inventory (Oldfield, 1971). Stimuli. The basic stimulus set consisted of nine addition and nine subtraction problems. For addition (subtraction), the operands ranged from 14 to 56 (32 to 128) for the first operand and from 5 to 42 (7 to 59) for the second operand. As in Experiment 1, the second operand was a fixed proportion of the first operand: 28% (23%), 49% (34%), or 76% (44%). The correct results covered approximately the same numerical range as in Experiment 1 (21–98). Table 2 provides an overview of the problems used in Experiment 2. All other details of creating the stimulus set were identical to those in Experiment 1. Procedure. The procedure was identical to that in Experiment 1.
Results The trimming procedure was identical to that in Experiment 1. Of all responses, 0.4% were excluded from further analyses.
Momentum in Approximate Calculation 813 Table 2 All Basic Arithmetic Problems Presented in Experiment 2 and Their Correct and Deviant Results Operands O1 O2
1/2
1/1.7
Results and Mean Deviants (Not Jittered) 1/1.4 1/1.2 1/1 1.2/1 1.4/1
14 14 14 28 28 28 56 56 56
5 7 11 7 13 21 13 28 42
10 11 13 18 21 25 35 42 49
11 12 15 21 24 29 41 50 58
13 15 18 25 29 35 49 59 69
32 32 32 64 64 64 128 128 128
13 11 7 29 23 15 59 44 30
10 11 13 18 21 25 35 42 49
11 12 15 21 24 29 41 50 58
13 15 18 25 29 35 49 59 69
Addition 16 18 21 29 34 41 58 71 82
1.7/1
2/1
19 21 25 35 41 49 69 84 98
23 25 30 42 49 58 82 100 117
27 30 35 49 58 69 98 119 139
32 35 42 59 69 82 116 141 165
38 42 50 70 82 98 138 168 196
Subtraction 16 19 18 21 21 25 29 35 34 41 41 49 58 69 71 84 82 98
23 25 30 42 49 58 82 100 117
27 30 35 49 58 69 98 119 139
32 35 42 59 69 82 116 141 165
38 42 50 70 82 98 138 168 196
Note—The actual problems presented to the subjects were jittered by a small random amount (see the Method section), such that the correct outcome was never presented.
Nonrandom distribution of responses. Again, we first examined whether the subjects responded randomly to the choice screen only or genuinely took into account the arithmetic problems. In Figure 7, we plotted response frequency for each notation and each operation, separately for trials on which the correct answer was closest to the third or the fifth response alternative (see Table 2). An ANOVA over the different response categories, with percentage of choice as the dependent variable and rank of the subject’s choice (one to seven) and trial type (third or fifth value correct) as factors, supported the notion that the subjects’ choices were influenced by the arithmetic problem. For each operation in both notations, significant effects of rank and significant rank 3 range interactions were observed (all ps , .001). Linear increase of response and response variability with the correct result. The subjects’ mean responses (depicted as dots in Figure 8) again increased as a function of the correct outcome for both addition (black) and subtraction (gray) in both notations (Figure 8A; nonsymbolic notation; Figure 8B; symbolic notation). Four one-way repeated measures ANOVAs with result size as the only factor for nonsymbolic addition [F(8,136) 5 70.14, p , .001, ε 5 .39] and subtraction [F(8,136) 5 664.60, p , .001, ε 5 .74], as well as for symbolic addition [F(8,136) 5 4,135.88, p , .001, ε 5 .66] and subtraction [F(8,136) 5 1,755.14, p , .001, ε 5 .50] confirmed this impression. Crucially, as can be seen in Figures 8 and 9, for nonsymbolic operations, although the correct results were now identical under addition and subtraction, the subjects’ mean responses differed, a first clear indication of OM. The numbers selected were bigger under addition than under subtraction, and all the more so that the out-
come increased. This resulted in a main effect of operation [F(1,17) 5 77.75, p , .001] and an operation 3 result size interaction [F(8,136) 5 58.45, p , .001, ε 5 .27] for nonsymbolic stimuli. For symbolic stimuli, no such main effect was found (F , 1), but the interaction [F(8,136) 5 3.53, p 5 .007, ε 5 .60] indicated that the impact of the operation was not identical for all the problems. An equivalent repeated measures ANOVA over the standard deviations of the chosen values (depicted as squares in Figure 8) showed that the subjects’ choices became increasingly variable as the numerical size of the results increased. This was true for both addition (black) and subtraction (gray) with the nonsymbolic notation [Figure 8A; F(8,136) 5 3.91, p 5 .004, ε 5 .60, and F(8,136) 5 29.85, p , .001, ε 5 .61, respectively] and with the symbolic notation [Figure 8B; F(8,136) 5 22.27, p , .001, ε 5 .72, and F(8,136) 5 14.64, p , .001, ε 5 .42, respectively]. As is depicted in the lower parts of Figures 8A and 8B, the CV seemed to be constant or decreasing across the whole range of outcomes for addition and subtraction with both notations. Indeed, CV did not change as a function of the correct outcome for nonsymbolic subtraction [F(8,136) 5 1.66, p 5 .117, ε 5 .97] or symbolic addition [F(8,136) 5 1.83, p 5 .091, ε 5 .83]. However, it significantly increased with increasing problem size for nonsymbolic addition [F(8,136) 5 2.91, p 5 .015, ε 5 .68] and significantly decreased for symbolic subtraction [F(8,136) 5 3.01, p 5 .009, ε 5 .76], although both effects were quantitatively small. Operational momentum. We again computed the difference between the log chosen and log correct outcome to obtain an index of the bias by which the subjects’ choices deviated from the correct outcome (see Experi-
814 Knops, Viarouge, and Dehaene
A
Nonsymbolic Notation
40
40 High range
35
35
30
30
Percentage Chosen
Percentage Chosen
Low range
25 20 15 10 5
25 20 15 10 5
0
0 1
2
3
4
5
6
7
1
2
Response Category
4
5
6
7
6
7
Response Category
B
Symbolic Notation
90
90
80
80
70
70
Percentage Chosen
Percentage Chosen
3
60 50 40 30
60 50 40 30
20
20
10
10
0
0 1
2
3
4
5
6
7
Response Category
1
2
3
4
5
Response Category
Figure 7. Distribution of the subjects’ choices across the seven proposed results, averaged over all arithmetic problems, separately for each addition (left column) and subtraction (right column) problem in nonsymbolic (A) and symbolic (B) notation (for other information, see Figure 2).
ment 1). This measure of the OM effect is depicted in Figure 10 separately for each operation in both notations. To test the overall presence of an OM effect, we computed a 2 3 2 repeated measures ANOVA over the difference of the logarithm of the correct outcome and the log of the chosen value. The results resembled those from Experiment 1. Smaller values (indicating an underestimation) were obtained with nonsymbolic than with symbolic stimuli [F(1,17) 5 61.46, p , .001]. Most important, the OM effect was reflected in smaller values for subtraction problems than for addition problems [F(1,17) 5 52.36, p , .001]. A significant interaction [F(1,17) 5 45.87, p , .001] indicated that the difference in response bias between addition and subtraction was larger for nonsym-
bolic than for symbolic problems, although it was significant in both cases [nonsymbolic, t(17) 5 7.11, p , .001; symbolic, one-tailed t(17) 5 1.76, p 5 .048]. Influence of the arithmetic operation on the spatial distribution of responses. Again, we tested whether subjects preferentially selected values presented at certain screen positions as a function of the arithmetic operation. Figure 11 shows that the overall pattern of performance was quite comparable to that in Experiment 1. We statistically tested this impression by computing two 2 3 2 repeated measures ANOVAs with factors of operation and position for the upper left and upper right positions only (separately for nonsymbolic and symbolic stimuli). The interaction between location and operation,
Momentum in Approximate Calculation 815
A
Nonsymbolic Calculation 80
100
1.8
50 40
60
30
40
1.4
20 20
Log Chosen Value
60
80
10 0
0 0.4
CV
2.2
70
Addition Subtraction
SD
Mean Chosen Value
120
1 1
1.4
1.8
2.2
Log Correct Outcome
0.2 0 0
20
40
60
80
100
120
Linear Correct Outcome
120
70
100
60
2.2
50
80
40 60
30
40
1.8
1.4
20
20
10
0 0.4
0
Log Chosen Value
CV
Symbolic Calculation
SD
Mean Chosen Value
B
1 1
1.4
1.8
2.2
Log Correct Outcome
0.2 0 0
20
40
60
80
100
120
Linear Correct Outcome Figure 8. Left column: Mean responses (chosen values, squares) of the subjects and standard deviations (circles) plotted against the correct outcome for both nonsymbolic (A) and symbolic (B) addition and subtraction in Experiment 2. The lower part of panels A and B depicts the coefficient of variation (CV, diamonds) plotted against the correct outcome. Right column: The logarithm of the correct outcome plotted against the logarithm of the mean value chosen by the subjects for nonsymbolic (top) and symbolic (bottom) notation. The gray line indicates a ratio of 1—that is, perfect performance.
although in the same direction as in Experiment 1, was not significant [nonsymbolic notation, F(1,17) 5 2.26, p 5 .15; symbolic notation, F(1,17) , 1]. This might be interpreted in terms of high intersubject variability preventing the effect from reaching significance in a test with subjects as the random factor. As in Experiment 1, we therefore also tested the deviation of the observed clicking preferences from the expected uniform distribution with a χ2 test across trials. A 2 3 2 contingency table analysis showed that for nonsymbolic notation, the subjects did not choose each position on the screen equally often for the
two operations ( p 5 .003), whereas no such differential impact of operation on the spatial position chosen was present for symbolic notation ( p 5 .53). Note that in Experiment 2, contrary to Experiment 1, the choices presented on the screen had the same magnitudes for addition and subtraction. Thus, the results of Experiment 2 indicate that the spatial bias for results in certain locations on the screen was driven not only by the magnitude of the numerosities presented at choice time, but also, crucially, by the arithmetic operation that was carried out prior to the choice itself.
816 Knops, Viarouge, and Dehaene Nonsymbolic Notation
Choice Frequency (%)
50 Subtraction 21 Subtraction 41 Subtraction 98 Addition 21 Addition 41 Addition 98
40 30 20 10 0 0
50
100
150
200
Chosen Number Figure 9. Sample distributions of the subjects’ responses to three nonsymbolic addition and subtraction problems in Experiment 2. In each case, a small leftward displacement of subtraction, relative to addition problems, reflects the operational momentum effect.
Discussion The second experiment was designed mainly to decide whether the SOAR effect (i.e., the spatial bias in response frequency as a function of the arithmetic operation) observed in Experiment 1 was due to the increasing magnitude of the outcomes or to the arithmetic operations that were deployed. Since we had used matched operands in Experiment 1, the outcomes were larger for addition than for subtraction, thus confounding these factors. In Experiment 2, we designed the operands so that the outcomes were identical (and therefore, the operands were smaller for addition than for subtraction). If the SOAR effect is due to the arithmetic operation, we should still observe it in this second experiment. Indeed, we replicated the spatial bias for the upper right and upper left positions of the screen as a function of the arithmetic operation. Again, this tendency was more pronounced for nonsymbolic notation than for symbolic arithmetic. Thus, we conclude that the SOAR effect is most probably due to the arithmetic operation, rather than to the numerical size of the outcome. With regard to the OM effect, we also replicated the results from the first experiment. We observed a bias in the chosen outcomes as a function of both the notation and the operation. Most important, for equal objective outcomes, the subjects were biased toward smaller numbers for subtraction problems than for addition problems. As in Experiment 1, these effects were driven largely by the nonsymbolic notation. We still observed a significant OM effect with symbolic notation, albeit a very small one. General Discussion We have reported the results from two experiments in which symbolic and nonsymbolic addition and subtraction were investigated in order to quantify the mechanisms underlying basic mental arithmetic. Two cognitive effects were investigated in more detail.
The OM effect refers to the fact that the subjects’ responses were systematically biased by the arithmetic operation carried out. Responses were biased toward larger numbers for addition than for subtraction. Although this response bias was more pronounced for nonsymbolic problems, the present study proves for the first time that OM affects symbolic arithmetic. This aspect of our results strengthens the hypothesis that approximate arithmetic, even when the input numbers are presented as Arabic numerals, relies on magnitude representations and arithmetic procedures that are partially similar to those used for nonsymbolic calculation (Dehaene et al., 1999). The second, new effect reflects a spatial bias of the subjects for preferring some locations on the screen over others, depending on the arithmetic operation that they just performed. With addition, the subjects preferentially selected numerosities displayed in the upper right location, whereas for subtraction, they preferred the upper left location. Experiment 2 showed that this effect occurs, although with high variability across subjects, even when addition and subtraction problems that yield the same numerical outcome are compared. Note that, in this case, the initial operands are larger for subtraction than for addition, and yet the observed effect associates subtraction with the left side of space. Thus, this new association between arithmetic operations and the left–right axis can be differentiated from the classical SNARC effect (Dehaene et al., 1993), whereby increasing number size causes an increasingly larger rightward spatial bias. Since arithmetic operations are associated with a distinct spatial bias, we coined the term SOAR (as an acronym for space–operation association of responses) for this new effect.
Response Bias
Nonsymbolic Subtraction
Nonsymbolic Addition
Symbolic Subtraction
Symbolic Addition
–0.10
–0.05
0
0.05
0.10
Log (Chosen Value) – Log (Correct Outcome) Figure 10. Mean response bias, defined as the difference between the chosen value and the correct outcome, both expressed on a log scale. A negative bias indicates underestimation, and a positive bias indicates overestimation.
Momentum in Approximate Calculation 817 Nonsymbolic Subtraction
Nonsymbolic Addition 20 7
1
20 2
15
7
10
6
3
5
6
3
4
5
1
20 2
15
7
1 2
15
10
10
6
3
5
4
Symbolic Subtraction
Symbolic Addition
7
2
15
10
20
1
4
6
3
5
4
Figure 11. The space–operation association of responses effect for Experiment 2. Again, the subjects were clearly biased toward an upper right response to addition problems and an upper left response to subtraction problems for nonsymbolic operations. An unexpected bias toward upper left positions was observed for symbolic addition problems.
The SOAR effect may be interpreted in a framework where calculation is likened to a sort of movement or a shift of attention along the mental number line (Dehaene, 1992; E. M. Hubbard et al., 2005; Restle, 1970). This interpretation parallels the account of perceptual representational momentum in terms of dynamic mental representations (Freyd & Pantzer, 1995). Just as Freyd and Pantzer assumed that the mental representation of a moving object is permanently updated, the mental representation of a given numerosity in the course of being transformed by a mental calculation would be not fixed but dynamic, with a displacement in the distribution of activation on the mental number line representing the change from one value to another. The direction of change (addition/subtraction) would then determine the OM effect and, by congruity with space, the SOAR effect. Both the OM and SOAR effects add to previous evidence for number–space interactions arising from the SNARC effect and the numerical bisection task. They suggest that numerosity is internally mapped onto a spatially organized and dynamically updated mental representation and that this representation is not activated just in an epiphenomenal manner but is actively used and updated during mental arithmetic—at least when approximations are required. Even with symbolic notation, we observed a differential bias due to the arithmetic operation in which the subjects
were engaged (see Pinhas & Fischer, 2008, for similar results). The effect is no doubt very small and on the edge of detectability, but this should not be surprising, given that responses are so much more precise when the operation is presented in symbolic form and thus leave little room for errors and biases to emerge. The very fact that we observe an effect despite the use of verbally mediated, exact calculation lets us assume the presence of common nonverbal and, presumably, attentional mechanisms. It remains to be seen whether exact arithmetic, including more complex operations such as multiplication and division, would also yield such spatial biases. Under the view that exact arithmetic relies on a distinct system, based on a verbal or symbolic coding of the numbers involved (Dehaene et al., 1999), one might predict that no SOAR effect should be found. However, if the SOAR effect is determined solely by a representation of the magnitude of the final result on an internal number line, it might still be presented during complex exact arithmetic. Over and above the biases perceptible in the OM and SOAR effects, the results of the present experiments indicate that, in the mean, the subjects were rather accurate in performing basic mental arithmetic, using nonsymbolic numerosities. On average, the subjects tended to underestimate the results of nonsymbolic problems, with addition being rather precise and subtraction largely underesti-
818 Knops, Viarouge, and Dehaene mated. It has been shown in previous studies that subjects generally underestimate the number of dots present in a given set of objects in transcoding tasks (e.g., from sets of dots to Arabic numerals; see Izard & Dehaene, 2008). Note, however, that the involvement of a general tendency to underestimate the number of items in a given set remains putative for the moment, since in theory no transcoding from one notation (e.g., nonsymbolic) to another (e.g., symbolic) is necessarily involved in the present paradigm. Nevertheless, subjects might engage in some sort of internal labeling of quantities that is then apt to undergo the same type of bias. The range of numbers used in the present study might as well have contributed to an overall bias to underestimate outcomes of nonsymbolic problems (yet, still resulting in larger values for addition than for subtraction). Here, we used larger numerosities than did McCrink et al. (2007), for example. Little is known so far about nonsymbolic calculation performance in the numerosity range we used in the present experiments. We found that Weber’s law clearly holds for both symbolic and nonsymbolic arithmetic, in agreement with previous results (Barth, Kanwisher, & Spelke, 2003; McCrink et al., 2007). The roughly constant coefficient of variation over different magnitudes suggests that a single underlying representation may be accessed whenever approximate arithmetic operations are carried out, whether in symbolic or nonsymbolic format. These results fit with those of other studies showing that basic numerical abilities are not restricted to humans but seem to be shared with other species (Beran, 2007). An important difference, however, is that humans possess symbolic codes for numbers, which, as was observed here, give them access to a much higher precision in calculation. In neural terms, it has been suggested that this effect could be explained by a sharpening of the tuning of numbercoding neurons in the course of symbol acquisition (Verguts & Fias, 2004). Alternative Strategies: Did the Subjects Engage in Mental Calculation? The interpretation of the present findings relies on the idea that the present results really do give evidence for an arithmetical process of approximate calculation. Thus, we have to rule out the use of simpler response strategies. An alternative interpretation of our results appeals to the anchoring and adjustment mechanisms put forward by Tversky and Kahneman (1974). The first operand might serve as an anchor (i.e., a numerical magnitude that subjects focus on), whereas the second operand would be used to “adjust” (i.e., to change the initial focus along the mental magnitude representation). We think that this anchor-andadjust mechanism is not necessarily incompatible with our notion of approximate arithmetic but that the precise nature of our data requires a much more precise specification of this mechanism. As can be seen in Figures 3 and 8, the subjects’ responses track very closely the correct exact arithmetic solution of each problem. Thus, the recombination of information gathered from each operand follows closely the laws of arithmetic (although with small spatial biases). The required subprocesses seem to go well beyond
a mere heuristic, although they do not preclude its overall involvement. Another objection might be that the subjects counted the dots to produce their responses. We analyzed the reaction times and did not observe any strong evidence that would imply a counting strategy. If the subjects had adopted a counting strategy, the reaction time should be linearly and strongly related to the chosen number in a given problem. However, the correlation between the numerical size of the chosen value (which, in turn, is linearly related to the different response alternatives) was r 5 .08 in Experiment 1 ( p 5 .001) and r 5 .03 in Experiment 2 (n.s.). Two other observations make it rather unlikely that the subjects used a counting strategy. If we assume that the subjects can count individual items at a rate of about 250 msec per item (a time at the lower boundary of fixation times in simple visual search paradigms; cf. Hooge & Erkelens, 1998; Jacobs, 1986), the presentation time of 1,500 msec for the operands did not allow for counting more than six items in a given set of dots. This is way below the numerical range of the operands used here. A similar argument holds for the reaction times in response to the presentation of the response alternatives, which was theoretically unlimited in time. The median response times were 2,712 msec for addition and 3,011 msec for subtraction problems in Experiment 1, and 2,859 and 2,672 msec for addition and subtraction, respectively, in Experiment 2. Again, this is not long enough to count the number of elements for the numerosities used here, especially given that the subjects had to choose between seven response alternatives. In combination with the fact that neither the subjects nor the experimenter reported the use of a counting strategy, we conclude that counting did not contribute to the pattern of results in the present study. Beyond these alternative strategies, the subjects might have produced their responses on the basis of the individual item sizes, which covaried with numerical magnitude. If the subjects’ performance was predominantly influenced by the individual item size, we would expect major differences between Experiment 1, in which the item size of the addition and subtraction problems differed due to different numerical magnitudes of the outcomes, and Experiment 2, in which the response alternatives were identical for both operations. The pattern of results in both experiments, however, was largely identical (see Figures 5 and 10), including a significant underestimation for both addition and subtraction problems, which was more pronounced for subtraction. This is not congruent with the idea that the results were due to the subjects’ paying attention to individual item size. Finally, one might wonder whether the subjects responded solely on the basis of the range of the presented response alternatives or on the basis of the size of one of the operands, without combining them in a mental calculation process. We carefully analyzed our data with respect to these and other alternative strategies. None of them could explain the present pattern of results (see the online supplemental materials). In sum, the most plausible strategy seems to involve arithmetic processing, for both symbolic and nonsymbolic
Momentum in Approximate Calculation 819 quantities. The exact mechanism by which internal quantities are manipulated to support simple calculation remains unknown, however. In the present study, we replicated the OM effect with numbers presented in nonsymbolic and symbolic notation. This allowed us to further analyze one putative determinant of the effect—that is, whether the OM effect is influenced by the numerical size of the operands (see the supplemental materials). For nonsymbolic notation, the results can be quickly summarized by stating that, for both addition and subtraction, whichever factor increased the numerical value of the outcome also increased the proportional size of the OM effect. For numbers presented in symbolic notation (Arabic numerals), the subjects were much more precise in their judgments, suggesting either that they could not inhibit exact calculation or that they have an inherently more precise, but still analogue, representation of the quantity associated with Arabic numerals (Dehaene et al., 1999; Verguts & Fias, 2004). Both possibilities are likely to be correct. The second possibility is vindicated by the finding of Weber’s law, but also of a smaller OM effect. The small size of the SOAR and OM effects in symbolic notation was probably due to the subjects’ higher precision, which frequently led to the optimal choice and thus left little room for observing spatial or numerical errors and biases. Yet the fact that the observed effects were, overall, larger for nonsymbolic than for symbolic notation also suggests the involvement of partially different subprocesses in the course of solving these two kinds of problems. It seems very likely that the subjects engaged in some exact calculations when facing a symbolic arithmetic problem, plausibly involving memory recall of verbal representations and of rote arithmetic facts from long-term memory. With nonsymbolic stimuli, no such knowledge was available. Because of this major difference, it is all the more noteworthy that we did observe small yet significant indications of an OM effect even with exact and, presumably, verbally mediated calculation. In future work, a suggestion might be to use a narrower range of proposed outcomes for symbolic than for nonsymbolic stimuli, thus compensating for the subjects’ higher precision. This method may have a greater chance of detecting the small biases that may characterize symbolic arithmetic. Commonalities and Differences Between Operational and Representational Momentum The OM effect was named by analogy with the representational momentum effect in the visual domain. This was meant to indicate that in both domains—numerical and visual—mechanisms may exist that operate on and involve the updating of a dynamic mental representation (be it of moving objects or of numerical magnitudes). Freyd (1993) postulated that the representational momentum effect arises from a nonstatic but dynamic underlying representation that is continuous and analogue in nature. Note, however, that in the present experiments, the input stimuli were discrete in nature (natural numbers, either in the form of dots in a set or as Arabic numerals). Nevertheless, many experiments suggest that the underlying
representation of these numbers relies on analogue mental numerical magnitudes. When saying analogue, we mean that the internal representation of numerical magnitude is noisy and organized along a continuum in a similar way as are other (physical) quantities. As has been discussed in many studies since Moyer and Landauer’s (1967) seminal finding, the brain represents discrete numbers by using continuous internal quantities (Dehaene et al., 1999; Gallistel & Gelman, 1992; Shepard, Kilpatrick, & Cunningham, 1975). Whether the analogy between physical and operational momentum is equally applicable to all aspects and theoretical dimensions of both effects remains to be seen. For instance, in the domain of physical motion, representational momentum typically applies only if the perceived deviations in location occur in the direction of the movement. In our understanding, however, this is one of the points where the analogy between representational momentum and OM might have its limits. For the domain of numerical cognition, the most interesting analysis is probably not to look directly at whether the selected result exceeds the correct value or not, but rather to contrast directly addition and subtraction problems that are carefully matched either by operands (Experiment 1) or by outcome (Experiment 2). These analyses are useful in order to control for any overall bias that might affect the subjects’ responses, particularly since it is well known that numerosity is frequently underestimated (e.g., Izard & Dehaene, 2008). These comparisons clearly indicate that under matched conditions, additions are overestimated, as compared with subtractions—even though addition estimates do not necessarily exceed the correct result. It is also uncertain whether the underlying mechanisms are identical for both effects (i.e., representational momentum and OM). Following E. M. Hubbard et al. (2005) and Dehaene and colleagues (2003), we tentatively propose that OM may have its neural origin in parietal attentional mechanisms that operate on the internal mental number representation. These may share certain features with mechanisms involved in the phenomenon of representational momentum, such as a process of constant updating, but they may also differ with respect to other features and might even be dissociable by distinct brain lesions. In fact, we observed two effects of “spatial” displacement in the present study. The OM effect suggests a displacement on the mental number line when a particular result is chosen. The SOAR effect describes a preference for certain positions on a screen as a function of the arithmetic process the subject is engaged in. In the domain of representational momentum, too, it has been shown that the final perceived spatial displacement reflects the influence of several sources of bias. In particular, E. M. Hubbard and colleagues demonstrated that the representational momentum effect decreases when objects appear to slide along a surface, thus indicating that humans incorporate and represent friction when estimating the trajectory of an object (T. L. Hubbard, 1995). In a similar vein, representational gravity and the presence of a landmark in the visual scene combine with other factors, such as velocity, to determine the final
820 Knops, Viarouge, and Dehaene spatial displacement of the subjects’ judgments (T. L. Hubbard & Ruppel, 2000). Bridging the gap between cognitive domains, one might thus infer that OM, too, is a combination of several sources or forces—notably, the mere displacement along the mental number line and the SOAR effect. In the context of the present experiments, it is not possible, however, to disentangle these factors. By choosing a particular response alternative on a screen, the subjects simultaneously chose both a numerosity and a screen location. It remains to be seen in future experiments how these two biases interact to determine the final performance. To generalize this idea, it might be interesting in future experiments to investigate what sources of variability contributed to the OM effect. This question aims at differentiating whether the observed OM effect has its origin in the mental representation of the displayed numerosity, the mental calculation process, or the response selection stage (Cordes et al., 2007). In the study of Cordes and colleagues the major determinant of variability in nonverbal arithmetic was found to have its origin in the individual mental numerical magnitude representations entering the calculation process, rather than from mental transition or motor production processes. This is interesting in the context of the present experiments, since here we observed an additional source of variability that contributes to the outcome of a mental arithmetic operation—that is, the OM effect. At the same time, it might help to understand the results of the present experiments: In contrast to the procedure of Cordes and colleagues, in the present study, the subjects did not have to repeatedly push a button to indicate a certain numerosity but just could click on one of the quantities displayed on the screen. Since this procedure is less apt to be influenced by covarying factors such as the duration of the buttonpresses (the larger the numerosities, the longer it takes for subjects to respond), we may assume that the amount of variability introduced by the response stage is reduced. Therefore, the present methodological approach may be useful in future experiments to further delineate the laws that characterize nonverbal calculation. Author Note This work was first reported as an oral presentation at the workshop “Number, Space, and Action” (Aachen, Germany, March 23–24, 2007). It was supported by a grant from the Volkswagen Foundation to S.D., in support of A.K. We thank Charlie Chubb in his role as action editor and Timothy Hubbard and three anonymous reviewers for valuable suggestions on earlier versions of the manuscript. Correspondence concerning this article should be addressed to A. Knops, INSERM–CEA Cognitive Neuroimaging Unit, CEA/SAC/DSV/DRM/NeuroSpin, Bât 145, Point Courrier 156, F-91191 Gif-sur-Yvette, France (e-mail: knops.andre@ gmail.com). References Barth, H., Kanwisher, N., & Spelke, E. (2003). The construction of large number representations in adults. Cognition, 86, 201-221. Barth, H., La Mont, K., Lipton, J., Dehaene, S., Kanwisher, N., & Spelke, E. (2006). Nonsymbolic arithmetic in adults and young children. Cognition, 98, 199-222. Beran, M. J. (2007). Rhesus monkeys (Macaca mulatta) enumerate
large and small sequentially presented sets of items using analog numerical representations. Journal of Experimental Psychology: Animal Behavior Processes, 33, 42-54. Brannon, E. M., & Terrace, H. S. (1998). Ordering of the numerosities 1 to 9 by monkeys. Science, 282, 746-749. Brannon, E. M., & Terrace, H. S. (2000). Representation of the numerosities 1–9 by rhesus monkeys (Macaca mulatta). Journal of Experimental Psychology: Animal Behavior Processes, 26, 31-49. Cantlon, J. F., & Brannon, E. M. (2006). Shared system for ordering small and large numbers in monkeys and humans. Psychological Science, 17, 401-406. Cordes, S., Gallistel, C. R., Gelman, R., & Latham, P. (2007). Nonverbal arithmetic in humans: Light from noise. Perception & Psychophysics, 69, 1185-1203. Dehaene, S. (1992). Varieties of numerical abilities. Cognition, 44, 1-42. Dehaene, S. (1997). The number sense: How the mind creates mathematics. New York: Oxford University Press. Dehaene, S., Bossini, S., & Giraux, P. (1993). The mental representation of parity and numerical magnitude. Journal of Experimental Psychology: General, 122, 371-396. Dehaene, S., & Cohen, L. (1997). Cerebral pathways for calculation: Double dissociation between rote verbal and quantitative knowledge of arithmetic. Cortex, 33, 219-250. Dehaene, S., Piazza, M., Pinel, P., & Cohen, L. (2003). Three parietal circuits for number processing. Cognitive Neuropsychology, 20, 487-506. Dehaene, S., Spelke, E., Pinel, P., Stanescu, R., & Tsivkin, S. (1999). Sources of mathematical thinking: Behavioral and brainimaging evidence. Science, 284, 970-974. Fischer, M. H., Warlop, N., Hill, R. L., & Fias, W. (2004). Oculomotor bias induced by number perception. Experimental Psychology, 51, 91-97. Freyd, J. (1993). Five hunches about perceptual processes and dynamic representations. In D. Meyer & S. Kornblum (Eds.), Attention and performance XIV: Synergies in experimental psychology, artificial intelligence, and cognitive neuroscience (pp. 99-119). Cambridge, MA: MIT Press. Freyd, J., & Finke, R. A. (1984). Representational momentum. Journal of Experimental Psychology: Learning, Memory, & Cognition, 10, 126-132. Freyd, J., & Finke, R. A. (1985). A velocity effect for representational momentum. Bulletin of the Psychonomic Society, 26, 443-446. Freyd, J., & Pantzer, T. M. (1995). Static patterns moving in the mind. In S. M. Smith, T. B. Ward, & R. A. Finke (Eds.), The creative cognition approach (pp. 181-204). Cambridge, MA: MIT Press. Gallistel, C. R., & Gelman, R. (1992). Preverbal and verbal counting and computation. Cognition, 44, 43-74. Gilmore, C. K., McCarthy, S. E., & Spelke, E. S. (2007). Symbolic arithmetic knowledge without instruction. Nature, 447, 589-591. Halpern, A. R., & Kelly, M. H. (1993). Memory biases in left versus right implied motion. Journal of Experimental Psychology: Learning, Memory, & Cognition, 19, 471-484. Hooge, I. T., & Erkelens, C. J. (1998). Adjustment of fixation duration in visual search. Vision Research, 38, 1295-1302. Hubbard, E. M., Piazza, M., Pinel, P., & Dehaene, S. (2005). Interactions between number and space in parietal cortex. Nature Reviews Neuroscience, 6, 435-448. Hubbard, T. L. (1995). Cognitive representation of motion: Evidence for friction and gravity analogues. Journal of Experimental Psychology: Learning, Memory, & Cognition, 21, 241-254. Hubbard, T. L. (2005). Representational momentum and related displacements in spatial memory: A review of the findings. Psychonomic Bulletin & Review, 12, 822-851. Hubbard, T. L., & Ruppel, S. E. (2000). Spatial memory averaging, the landmark attraction effect, and representational gravity. Psychological Research, 64, 41-55. Huynh, H., & Feldt, L. S. (1976). Estimation of the box correction for degrees of freedom from sample data in randomized block and splitplot designs. Journal of Educational Statistics, 1, 69-82. Izard, V., & Dehaene, S. (2008). Calibrating the mental number line. Cognition, 106, 1221-1247.
Momentum in Approximate Calculation 821 Jacobs, A. M. (1986). Eye-movement control in visual search: How direct is visual span control? Perception & Psychophysics, 39, 47-58. Kerzel, D. (2003). Attention maintains mental extrapolation of target position: Irrelevant distractors eliminate forward displacement after implied motion. Cognition, 88, 109-131. Krueger, L. E. (1984). Perceived numerosity: A comparison of magnitude production, magnitude estimation, and discrimination judgments. Perception & Psychophysics, 35, 536-542. McCrink, K., Dehaene, S., & Dehaene-Lambertz, G. (2007). Moving along the number line: Operational momentum in nonsymbolic arithmetic. Perception & Psychophysics, 69, 1324-1333. McCrink, K., & Wynn, K. (2004). Large-number addition and subtraction by 9-month-old infants. Psychological Science, 15, 776-781. Moyer, R. S., & Landauer, T. K. (1967). Time required for judgments of numerical inequality. Nature, 215, 1519-1520. Nieder, A., Freedman, D. J., & Miller, E. K. (2002). Representation of the quantity of visual items in the primate prefrontal cortex. Science, 297, 1708-1711. Nieder, A., & Miller, E. K. (2004). A parieto-frontal network for visual numerical information in the monkey. Proceedings of the National Academy of Sciences, 101, 7457-7462. Oldfield, R. C. (1971). The assessment and analysis of handedness: The Edinburgh Inventory. Neuropsychologia, 9, 97-113. Piazza, M., Izard, V., Pinel, P., Le Bihan, D., & Dehaene, S. (2004). Tuning curves for approximate numerosity in the human intraparietal sulcus. Neuron, 44, 547-555. Piazza, M., Pinel, P., Le Bihan, D., & Dehaene, S. (2007). A magnitude code common to numerosities and number symbols in human intraparietal cortex. Neuron, 53, 293-305. Pica, P., Lemer, C., Izard, V., & Dehaene, S. (2004). Exact and approximate arithmetic in an Amazonian indigene group. Science, 306, 499-503. Pinhas, M., & Fischer, M. H. (2008). Mental movements without magnitude? A study of spatial biases in symbolic arithmetic. Cognition, 109, 408-415.
Restle, F. (1970). Speed of adding and comparing numbers. Journal of Experimental Psychology, 91, 191-205. Sheliga, B. M., Riggio, L., & Rizzolatti, G. (1994). Orienting of attention and eye movements. Experimental Brain Research, 98, 507-522. Shepard, R. N., Kilpatrick, D. W., & Cunningham, J. P. (1975). The internal representation of numbers. Cognitive Psychology, 7, 82-183. Tversky, A., & Kahneman, D. (1974). Judgment under uncertainty: Heuristics and biases. Science, 185, 1124-1131. Verguts, T., & Fias, W. (2004). Representation of number in animals and humans: A neural model. Journal of Cognitive Neuroscience, 16, 1493-1504. Xu, F., & Spelke, E. S. (2000). Large number discrimination in 6-monthold infants. Cognition, 74, B1-B11. Note 1. One might argue that the ANOVA is not justified since the required prerequisite of homoscedacity is not met (the variance of the mean chosen value increases with increasing correct outcome). Note, however, that we report statistics that are corrected for nonsphericity, being a special case of heteroscedacity. To protect us against the violation of the sphericity assumption, we additionally performed a log-transformation on the data and subsequently repeated the ANOVAs described here. We obtained identical results— that is, a significant increase of mean chosen value with increasing numerical size of the correct outcome in all cases (all ps , .01). SUPPLEMENTAL MATERIALS A discussion of alternative strategies and additional analyses of the determinants of the operational momentum effect may be downloaded from app.psychonomic-journals.org/content/supplemental. (Manuscript received March 18, 2008; revision accepted for publication December 2, 2008.)