London, Canada. {gkeller2 ..... In this scenario, the web servers hosted in the four containers will .... hosted web server processing the requests that could not.
International Journal on Advances in Software, vol 3 no 3 & 4, year 2010, http://www.iariajournals.org/software/
333
Dynamic Resource Management in Virtualized Environments through Virtual Server Relocation Gast´on Keller and Hanan Lutfiyya Department of Computer Science The University of Western Ontario London, Canada {gkeller2,hanan}@csd.uwo.ca
Abstract—Virtualization has become an essential technology in the data center. Virtualization improves resource utilization through server consolidation, but it also makes resource management more complex. Golondrina, an autonomic resource management system, was built to use virtual server relocation to handle resource stress situations, that is, situations where the combined resource needs of the virtual servers hosted in a physical machine exceed the resource availability. Experimental evaluation shows that replication offers improvements over migration, and both mechanisms offer improvements over taking no action upon detection of a CPU stress situation. The main contribution of this work is the introduction of virtual server replication as an alternative to migration and the experimental comparison of both mechanisms. Keywords-virtualization; resource management; migration; replication; autonomic computing
I. I NTRODUCTION A data center is defined as a collection of computing resources shared by multiple applications concurrently in return for payment by the application providers, on a perusage basis, to the data center provider [2]. To guarantee that an application will always be able to cope with all demand levels the application is statically allocated enough resources so that peak demand is satisfied. The unit of allocation is typically a physical server. This often results in resources being underutilized. One approach to increasing resource utilization is server consolidation, which consists of hosting multiple application servers in one physical server. This approach is possible through virtualization. Virtualization refers to an abstract layer between the operating system and the hardware. The layer provides an interface to the actual hardware that allows for the support of a number of virtual machines. In a data center a virtual machine would have a server application installed on it. We will use the term virtual server to refer to a virtual machine that runs an application server. Virtualization reduces the unit of resource allocation to fractions of a physical server. This potentially benefits data centers by allowing several applications to make use of the same physical server. If the virtual servers are placed on a physical server based on peak demand, then the physical server can still be highly underutilized. On the other hand, if
the virtual servers are placed on a physical server based on the average demand, then this may result in virtual servers competing for the same resources when demand increases. The reason is that demand for an application may increase such that it needs computing resources currently being used by other applications on the same physical server. The time-varying demand that application servers may experience in a data center [3] suggests that resource allocation should be done dynamically. Dynamic resource management requires monitoring mechanisms and dynamic resource reallocation mechanisms. Golondrina, an autonomic resource management system, was developed with resource utilization sensors for monitoring and virtual server relocation mechanisms. Two examples of the latter are migration and replication. Migration consists of transferring a running virtual server from one physical server to another. Replication entails the creation of a replica of a virtual server on another physical server. Requests for the virtual server are balanced between the two instances. This should reduce the computing resources needed by a single physical server by distributing requests to two different virtual server instances hosted in two different physical servers. A replica in this work is not an actual copy of the virtual server running at the time, but an instantiation of an image of the virtual server. The primary focus of this work is to study the use of virtual server relocation to deal with resource stress situations, that is, situations where the combined resource needs of the virtual servers hosted in a physical server exceed the resource availability. One reason for this study arises from a challenge in dynamic resource management where it is often difficult to determine the appropriate action in response to a resource stress situation. The goal of our study is to determine effective strategies in the use of different virtual server relocations for effective management of computing resources. The rest of this paper is organized as follows: Section II provides background on the virtualization software used, Section III describes the resource management system, Section IV presents the experiments, Section V discusses the experimental results, Section VI describes related work, and
2010, © Copyright by authors, Published under agreement with IARIA - www.iaria.org
International Journal on Advances in Software, vol 3 no 3 & 4, year 2010, http://www.iariajournals.org/software/
334
Section VII provides a conclusion. II. BACKGROUND This work uses OpenVZ which provides operating system-level virtualization [4], [5]. OpenVZ is essentially a Linux kernel modified to run multiple, isolated containers (i.e., virtual user-space environments) on a single physical server or hardware node. OpenVZ supports the execution of multiple containers. The containers are isolated program execution environments, which appear as stand-alone servers to users. Each container has its own set of processes including the init process, file system, users (including root), applications, memory, network interfaces with IP addresses, routing tables, and firewall rules. Information on resource utilization for the hardware node and each container can be retrieved by reading the accounting files in the proc filesystem. The host system runs inside a privileged container. OpenVZ provides container checkpointing, which is the ability to suspend an executing container, save its state to a file and restart it again later. Container live migration is a natural extension of checkpointing. This process consists of two phases. First, the container’s file system is copied to the target machine while the container is still running. In the second phase, the container is checkpointed, its state file is transferred to the target machine and a second copy of the container’s file system is started. This second copy is incremental, in the sense that it only affects those files that were modified after the first copy. When the second copy finishes, the container is restored from the state file at the target machine. All the network connections are migrated with the container, so the user perceives no downtime, but does perceive a delay in processing. OpenVZ does not provide container replication, but it can be implemented. The first step is to stop the container that is to be replicated. The second step is to copy the container’s file system and configuration file to the target machine. (Once the file system is copied, the original container can be restarted.) The third step is to modify the replica’s configuration file with its own information (identifier, IP address, etc). After this last step, the replica can be started. Our current implementation of the replication process avoids stopping the container to replicate by using a stored image of it. III. M ANAGEMENT S YSTEM Golondrina was conceived as a multi-resource management system for data centers. This first prototype, however, works with the CPU as its only managed resource. For that reason, we will use the term CPU stress situation instead of the more general term resource stress situation, as defined in Section I. Similar procedure will be followed with related terms.
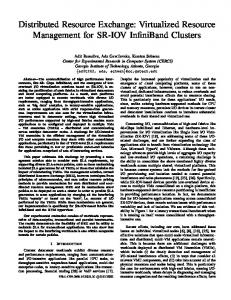
Figure 1.
Golondrina’s architecture
Golondrina consists of three primary management entities: Client, Manager and Gate (see Figure 1) which are described in this section. A. Client Each hardware node has a Client instance that runs in the priviledged container. The Client requires access to the operating system’s configuration and accounting files, and the OpenVZ management tools. The Client instance provides the following functionality: 1) The periodic collection of CPU utilization statistics from the containers and the hardware node. This is done by reading the hardware node’s operating system’s accounting files through the proc file system. These statistics are sent to the Manager; 2) Support for migration and replication of containers. This is done upon a request from the Manager. Migration is provided by one of the OpenVZ Management tools. However, since OpenVZ does not provide a replication feature, the Client has to follow a sequence of steps to trigger a replication. For the container to be replicated requires the following: a) An identifier is generated for the replica; b) An image of the container is retrieved from a central repository and placed on the target hardware node; c) The appropriate configuration files on the hardware node are edited. B. Manager Upon receiving the CPU utilization statistics sent by the Client, the Manager stores the statistics. The data model used assumes that the hardware node is an aggregation of containers. The attributes of the hardware node and containers represent CPU utilization metrics. This information is analyzed (III-B1) to execute CPU stress checks (III-B2) and relocation searches (III-B3).
2010, © Copyright by authors, Published under agreement with IARIA - www.iaria.org
International Journal on Advances in Software, vol 3 no 3 & 4, year 2010, http://www.iariajournals.org/software/
335
1) Analyzing CPU Utilization Statistics: The CPU utilization statistics sent by the Clients are used to create a CPU utilization profile over time. A mathematical model uses the CPU utilization statistics collected at time ti for predicting the CPU utilization of a container or hardware node at time ti+1 . The mathematical model used is the Auto-regressive Model of Order 1 AR(1) [6], which relies on the last observation in the sequence of observations and two parameters: µ, the mean of the values in the sequence, and θ, which accounts for the variations of the values in the sequence. Given a sliding window of CPU utilization statistics W = [ux , ..., ut ] with maximum size w and where x = max(0, t− w + 1). The parameters µ and θ at time t are calculated as follows: t X
µt =
ui
i=x
(1)
t−x+1
t−1 X (ui − µt ) ∗ (ui+1 − µt )
θt =
i=x
max(1,
t−1 X
(2) 2
(ui − µt ) )
i=x
Having the values ut , µt and θt , it is possible to predict the CPU utilization at time t + 1: u ˆt+1 = µt + θt ∗ (ut − µt )
(3)
The profiling process uses a historical policy to calculate the container’s profiled CPU utilization. This value has to satisfy a given percentile of the container’s CPU needs registered in the last window of time W = [ux , ..., ut ], in addition to the container’s current CPU needs. The process sorts in increasing order the collected statistics in W and takes the value corresponding to the 90th percentile. The profiled CPU utilization at time t + 1 is the maximum of the 90th percentile and the container’s predicted CPU utilization plus an additional ∆: u ¯t+1 = max(90th percentile, u ˆt+1 + ∆)
(4)
2) CPU Stress Detection Mechanism: The Manager executes a CPU stress check on every hardware node that is not currently involved in a relocation. The hardware nodes already involved in relocations (be it as source or target) are likely to change their CPU utilization soon, so they are deemed unstable until all current relocations are completed. The CPU stress check consists of two steps. First, it verifies whether the predicted CPU utilization of the hardware node exceeds the CPU utilization threshold. Then, if the latter is true, it checks whether k out of the previous n CPU stress checks also exceeded the threshold, in which case
the hardware node is considered to be under a CPU stress situation.
(ˆ ut+1 > threshold) ∧ (
n X (ˆ ui > threshold) ≥ k)
(5)
i=1
3) Relocation Search: The problem of finding a sequence of relocations is complex. As it is noted in [7], the problem is similar to the NP-hard problem N-dimensional bin packing, but with the additional restriction that the bins are loaded right from the beginning. For this reason, the relocation search uses a greedy strategy to solve the problem. After the CPU stress check round is completed the hardware nodes are classified as stressed or non-stressed hardware nodes. If both sets are non-empty, then the Manager searches for a sequence of relocations to solve the CPU stress situations. This decision making process consists of determining which containers hosted in stressed hardware nodes will be relocated and which non-stressed hardware nodes will serve as a target for those relocations. The input to the algorithm (shown in Algorithm 1) includes information about stressed hardware nodes (denoted by SH) and nonstressed nodes (denoted by NSH). SH and NSH are assumed to be sorted in descending order of CPU load and ascending order of CPU load respectively. A container is chosen to be relocated (line 3). Currently the implementation starts with the containers using the most CPU cycles. The next step (line 4) is to determine a target hardware node that the container is either replicated or migrated to. The migration or replication is then carried out (line 5). for i = 0 to SH.length() do while SH[i] is stressed do CT = pickMostHeavilyLoadedCT(SH[i]); targetHN = pickMostLightlyLoadedHN(NSH); ExecuteAction(CT,targetHN); 6: end while 7: end for Algorithm 1: Relocation search 1: 2: 3: 4: 5:
Essentially the policy encapsulated by the algorithm is that for each stressed hardware node the containers using the most CPU cycles should be the first ones to be considered for relocation. Targets of relocation should be as lightly loaded as possible. A check of a potential target hardware node is done to determine if the potential target hardware node is able to accommodate the container to be relocated. For replication, an additional check is done to determine if the target hardware node already has a copy of the container to be replicated. C. Gate The Gate component runs in a non-virtualized physical server, which is used as the gate of the cluster (i.e., all
2010, © Copyright by authors, Published under agreement with IARIA - www.iaria.org
International Journal on Advances in Software, vol 3 no 3 & 4, year 2010, http://www.iariajournals.org/software/
336
service requests come through this physical server). Its responsibility is to update the load balancer’s configuration after a replication occurs. IV. E XPERIMENTS The objective of the experiments was to study how the system reacted to CPU stress situations using the container relocation mechanisms. In order to cause CPU stress situations, load had to be generated for the containers. For this purpose, HTTP requests were sent to web servers running inside the containers. The HTTP requests involved dynamic content so as to increase CPU utilization. With every request, a PHP file was executed to process a two MBytes text file [8], counting the number of words in the file. The execution returned a HTML file with the result of the process. The web servers were Apache [9] instances and the HTTP requests were generated using httperf [10] (running on physical servers in the cluster that were not part of the managed system). The frequency with which requests were sent determined the weight of the generated load. The weight of the load was the percentage of CPU cycles required from one CPU core to handle that load. For example, sending 1 request per second (1 req/sec) resulted in a CPU core being used at 70% capacity. The metrics used to evaluate the system included lost requests and response time of the web servers. The requests were classified into three categories: lost, failed and successful. Lost requests were those not processed before a client timeout (client-timo). Failed requests were those where the server refused a connection (connrefused), sent a RESET (connreset) or replied with a Server Error 5xx status code (reply-status-5xx). A web server’s effectiveness was defined as the ratio of the number of successful requests to the total generated requests. The web servers’ response time was measured as the average (avg) duration of the established connections (when sending a request, a connection is established between the client and the server, and once the reply is received, the connection is terminated), measured in milliseconds. The infrastructure on which Golondrina ran consisted of a cluster where one physical server was the gate of the cluster, another physical server was a manager server and the rest of the physical servers were OpenVZ hardware nodes. Each physical server was an Intel Pentium D 3.40GHz (dual-core) with two GBytes of RAM. The containers were built with the default resource allocation provided by OpenVZ. A. Experiments Design and Configurations Three different experiments were designed to evaluate Golondrina. Each experiment used the same number of hardware nodes, but the number of containers and the weight of the loads varied.
Each experiment was run three times. For the first run, Golondrina was configured to monitor the CPU utilization and check for CPU stress situations. The relocation mechanisms were disabled. This run provided a baseline, enabling observations on how the environment performed without Golondrina taking corrective actions. In the second and third runs, Golondrina was configured to use replications and migrations, respectively. The results of these runs were compared with each other and against the baseline. Golondrina’s CPU stress detection mechanism was configured in all cases with a CPU utilization threshold of 0.75. Given that the physical servers possessed two cores, the threshold was equivalent to 150% CPU capacity. (The total CPU capacity of a physical server with x cores is equal to x∗100%. In this case, the total CPU capacity of the hardware nodes was 200%.) The mechanism was also configured to trigger CPU stress checks every 10 seconds (same frequency with which the monitoring mechanisms were configured). The HTTP requests sent to the web servers had an associated timeout of 10 seconds and the time span between the start of two different loads during an experiment was 60 seconds. 1) Experiment 1: The managed system consists of two hardware nodes, bravo02 and bravo03, and two containers, A and B, hosted in bravo02. At a given point in time, container A receives a load of around 70% (450 requests at a rate of 1 req/sec). After 60 seconds, container B receives a load of around 105% (450 requests at a rate of 1.5 req/sec). At this point in time, the hardware node bravo02 experiences a load of around 175%, which exceeds the CPU utilization threshold of 150%. Thus, bravo02 is under a CPU stress situation. In this scenario, no request should be lost since the CPU needs of both containers can be satisfied. However, Golondrina will determine that bravo02 is under a CPU stress situation and will try to address this situation through a relocation. Golondrina should try first to relocate to bravo03 the container with the highest load, that is, B. 2) Experiment 2: The second experiment is similar to the previous one with the exception that both containers receive a load of around 105% (450 requests at a rate of 1.5 req/sec) each. Consequently, the hardware node bravo02 becomes CPU stressed with a load of 200% (total CPU capacity). In this scenario, the web servers running in A and B will lose requests, due to the lack of spare CPU cycles to allocate to the containers. Golondrina will detect the CPU stress situation experienced by bravo02 and will respond by triggering a relocation for the container with the highest load (in this case, both containers are candidates). Two replications or one migrations should be enough to terminate the CPU stress situation. 3) Experiment 3: In this experiment, the managed system consists of two hardware nodes, bravo02 and bravo03, and
2010, © Copyright by authors, Published under agreement with IARIA - www.iaria.org
International Journal on Advances in Software, vol 3 no 3 & 4, year 2010, http://www.iariajournals.org/software/
337
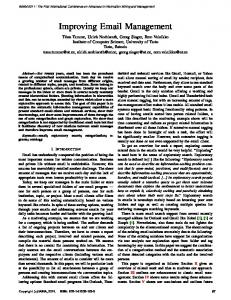
four containers, A, B, C and D, hosted in bravo02. One after another, with a 60-second separation in time, the containers receive a load of around 51% (300 requests at a rate of 0.72 req/sec). Thus, bravo02 experiences a CPU stress situation with a load of 200%. In this scenario, the web servers hosted in the four containers will lose requests. Golondrina will detect the CPU stress situation and will search for relocations in order to dissipate it. Three replications or two migrations should be enough to terminate the CPU stress situation. B. Results This subsection presents the results of the experiments described in Subsection IV-A. 1) Experiment 1: In the first run of the experiment, Golondrina was monitoring the CPU utilization of the hardware node and containers, but no action was taken in response to CPU stress situations. Figure 2 shows the CPU utilization of containers A and B, and the CPU utilization and predicted CPU utilization (as explained in Subsection III-B1) of the hardware node bravo02. The first time the CPU utilization of bravo02 went over the 150% threshold was at t = 11. Golondrina’s CPU stress detection mechanism signaled the problem at t = 15. Since no action was taken, the CPU stress situation persisted and was signaled every single time until t = 39 (included). Since there were enough CPU cycles to satisfy the demand of the containers, no request was lost or failed. The web server one.com, hosted in A, had an average connection time of 701.9 milliseconds. The web server two.com, hosted in B, had an average connection time of 904.5 milliseconds. In the second run of the experiment, Golondrina was to search for feasible replications if a CPU stress situation was detected. Figure 3 shows the CPU utilization of containers A and B, and the CPU utilization and predicted CPU utilization of the hardware node bravo02. Figure 4 shows the CPU utilization of the replicas A’ and B’, and the CPU utilization and predicted CPU utilization of bravo03. The first CPU stress situation in bravo02 was signaled at t = 15. At that time, Golondrina determined that container B had to be replicated in bravo03. By t = 16 the replica B’ had been created and the load balancer at the gate of the cluster was updated. At t = 17, B’ had CPU load, but then it did not process any request for three consecutive periods. As a consequence of container B’ not receiving any load, the CPU stress situation persisted in bravo02 and a second CPU stress situation was signaled at t = 19. This time container A was replicated in bravo03. It could be said then that the creation of container A’ took place due to an improper balancing of the load for the web server two.com, hosted in B and B’. At t = 17 and t = 22 it can be seen in Figure 3 and Figure 4 that the curves sloped down. During the periods
Table I E XPERIMENT 1 - P ERCENTAGE OF SUCCESSFUL REQUESTS Web Servers’ Effectiveness Servers
Run 1
Run 2
Run 3
one.com
100%
99.11%
100%
two.com
100%
98.44%
100%
(16, 17) and (21, 22) the load balancer was being updated, that required it to be restarted. As a consequence, some connections were refused or reset, and hence there was a slight decrease in the reported load. The web server one.com, hosted in A and A’, had 4 failed requests out of 450 (connrefused 3 connreset 1), which resulted in an effectiveness of 99.11%. The web server two.com, hosted in B and B’, had 7 failed requests out of 450 (connrefused 5 connreset 2), which resulted in an effectiveness of 98.44%. The web server one.com had an average connection time of 749.1 milliseconds. The web server two.com had an average connection time of 853.0 milliseconds. In the third run of the experiment, Golondrina was to look for migrations upon detection of a CPU stress situation. Figure 5 shows the CPU utilization of containers A and B, and the CPU utilization and predicted CPU utilization of the hardware node bravo02. Figure 6 shows the CPU utilization of B, and the CPU utilization and predicted CPU utilization of bravo03. A CPU stress situation was signaled at t = 15 in bravo02. Golondrina determined that container B was to be migrated to bravo03. At that point, the CPU utilization of both hardware nodes increased, due to the start of the migration process. Since there were spare CPU cycles in both hardware nodes, the containers saw their CPU needs unaffected. In the period (26, 27), the migration process was completed, but it was not until t = 28 that a CPU utilization report from container B was sent to the Manager component (running in the manager server) by the Client component running in bravo03. That report showed a peak of around 140% in CPU utilization, which could be attributed to the hosted web server processing the requests that could not be handled during the suspension period of the migration process. None of the web servers hosted in A and B had lost or failed requests. That means that the web servers had an effectiveness of 100%. The web server one.com, hosted in A, had an average connection time of 715.2 milliseconds. The web server two.com, hosted in B, had an average connection time of 991.1 milliseconds. From the web servers’ effectiveness results (Table I), it could be concluded that the replication mechanism is not a convenient tool since requests were lost. However, that loss
2010, © Copyright by authors, Published under agreement with IARIA - www.iaria.org
International Journal on Advances in Software, vol 3 no 3 & 4, year 2010, http://www.iariajournals.org/software/
338
Figure 2.
Figure 3.
Experiment 1 - No Action
Experiment 1 - Replication, bravo02
2010, © Copyright by authors, Published under agreement with IARIA - www.iaria.org
International Journal on Advances in Software, vol 3 no 3 & 4, year 2010, http://www.iariajournals.org/software/
339
Figure 4.
Figure 5.
Experiment 1 - Replication, bravo03
Experiment 1 - Migration, bravo02
2010, © Copyright by authors, Published under agreement with IARIA - www.iaria.org
International Journal on Advances in Software, vol 3 no 3 & 4, year 2010, http://www.iariajournals.org/software/
340
Figure 6.
Experiment 1 - Migration, bravo03
Table II E XPERIMENT 1 - W EB SERVERS ’ AVERAGE CONNECTION TIME IN MILLISECONDS
Web Servers’ Response Time Servers
Run 1
Run 2
Run 3
one.com
701.9
749.1
715.2
two.com
904.5
853.0
991.1
can be traced back to the load balancer’s need for a restart when updating its configuration after a replication. The comparison of the web servers’ response time does not offer conclusive results (Table II). In conclusion, when a hardware node experiences a CPU stress situation, but the CPU is not exhausted, no requests are lost. Thus, no action is necessary from the management system. However, migration and replication cause no (serious) performance degradation, so they could be used as preventive actions in case the load was expected to increase. 2) Experiment 2: In the first run of the experiment, Golondrina was monitoring the CPU utilization of the hardware node and containers, but no action was taken in response to CPU stress situations. Figure 7 shows the CPU utilization of containers A and B, and the CPU utilization and predicted CPU utilization (as explained in Subsection III-B1) of the hardware node bravo02. The first time the CPU utilization of bravo02 went over the 150% threshold was at t = 11. Golondrina’s CPU stress
detection mechanism signaled the problem at t = 14. Since no action was taken, the CPU stress situation persisted and was signaled every single time until t = 38 (included). Starting at t = 11 the CPU was equally shared between the two containers, using almost 100% each. However, the number of CPU cycles allocated to each container was not enough for the hosted web servers to process all requests. The web server one.com, hosted in A, had 101 lost requests out of 450 (client-timo 101), resulting in an effectiveness of 77.55%. The web server two.com, hosted in B, had 169 lost requests out of 450 (client-timo 169), resulting in an effectiveness of 62.44%. It can be seen in Figure 7 that during the interval [36, 38] container B almost doubled its CPU utilization, taking advantage of container A not requesting CPU cycles. This behaviour could be attributed to web server two.com processing all the requests that it had not been able to satisfy before due to a lack of CPU cycles. The web server one.com had an average connection time of 2816.3 milliseconds. The web server two.com had an average connection time of 3371.6 milliseconds. In the second run of the experiment, Golondrina was to search for feasible replications if a CPU stress situation was detected. Figure 8 shows the CPU utilization of containers A and B, and the CPU utilization and predicted CPU utilization of the hardware node bravo02. Figure 9 shows the CPU utilization of the replicas A’ and B’, and the CPU utilization and predicted CPU utilization of bravo03.
2010, © Copyright by authors, Published under agreement with IARIA - www.iaria.org
International Journal on Advances in Software, vol 3 no 3 & 4, year 2010, http://www.iariajournals.org/software/
341
Figure 7.
Figure 8.
Experiment 2 - No Action
Experiment 2 - Replication, bravo02
2010, © Copyright by authors, Published under agreement with IARIA - www.iaria.org
International Journal on Advances in Software, vol 3 no 3 & 4, year 2010, http://www.iariajournals.org/software/
342
Figure 9.
Experiment 2 - Replication, bravo03
The first CPU stress situation in bravo02 was signaled at t = 14. Golondrina determined that both containers had to be replicated in bravo03. By t = 16 the replicas B’ and A’ had been created and the load balancer at the gate of the cluster was updated. The load balancer was first updated (and restarted) for B’ in the period (15, 16) and updated again in the period (16, 17) for A’. During those two periods, it can be seen in Figure 8 that the CPU utilization of A and B decreased, due to connections that were refused or reset. At t = 17, containers A’ and B’ had a low CPU utilization and remained with minimal CPU utilization until t = 20 (included). During those periods, the requests were handled by A and B. In consequence, the CPU stress situation continued in bravo02 and was signaled at t = 18, 19, 20, 21, 22. At every one of those five points in time, Golondrina could not find suitable replications since A and B had already been replicated in bravo03 and the system does not allow two replicas of the same container to reside in the same hardware node. The web server one.com, hosted in A and A’, had 21 failed requests (connrefused 4 connreset 17) and 35 lost requests (client-timo 35) out of 450, which resulted in an effectiveness of 87.55%. The web server two.com, hosted in B and B’, had 25 failed requests (connrefused 4 connreset 21) and 29 lost requests (client-timo 29) out of 450, which resulted in an effectiveness of 88%. The web server one.com had an average connection time of 1408.1 milliseconds. The web server two.com had an
average connection time of 1781.4 milliseconds. In the third run of the experiment, Golondrina was to look for migrations upon detection of a CPU stress situation. Figure 10 shows the CPU utilization of containers A and B, and the CPU utilization and predicted CPU utilization of the hardware node bravo02. Figure 11 shows the CPU utilization of A, and the CPU utilization and predicted CPU utilization of bravo03. A CPU stress situation was signaled at t = 14 in bravo02. Golondrina determined that container A was to be migrated to bravo03. The migration process was started, increasing the CPU utilization in bravo03. The CPU in bravo02 was already exhausted, so the migration process competed for the CPU with the containers. A and B saw a reduction in their CPU allocation in the interval (14, 20] until the migration process ended in the period (20, 21). In the period [21, 22], container B increased its CPU utilization around 180%, and in the period [24, 25] A increased its CPU utilization around 195%. The behaviour of both containers could be attributed to the hosted web servers processing the requests that could not be handled during the migration process. The web server one.com, hosted in A, had 10 failed requests (reply-status-5xx 10) and 89 lost requests (clienttimo 89) out of 450, which resulted in an effectiveness of 78%. The web server two.com, hosted in B, had 70 lost requests (client-timo 70) out of 450, which resulted in an effectiveness of 84.44%.
2010, © Copyright by authors, Published under agreement with IARIA - www.iaria.org
International Journal on Advances in Software, vol 3 no 3 & 4, year 2010, http://www.iariajournals.org/software/
343
Figure 10.
Experiment 2 - Migration, bravo02
Figure 11.
Experiment 2 - Migration, bravo03
2010, © Copyright by authors, Published under agreement with IARIA - www.iaria.org
International Journal on Advances in Software, vol 3 no 3 & 4, year 2010, http://www.iariajournals.org/software/
344 Table III E XPERIMENT 2 - P ERCENTAGE OF SUCCESSFUL REQUESTS Web Servers’ Effectiveness Servers
Run 1
Run 2
Run 3
one.com
77.55%
87.55%
78%
two.com
62.44%
88%
84.44%
Table IV E XPERIMENT 2 - W EB SERVERS ’ AVERAGE CONNECTION TIME IN MILLISECONDS
Web Servers’ Response Time Servers
Run 1
Run 2
Run 3
one.com
2816.3
1408.1
1723.6
two.com
3371.6
1781.4
1661.6
The web server one.com had an average connection time of 1723.6 milliseconds. The web server two.com had an average connection time of 1661.6 milliseconds. From the web servers’ effectiveness results (Table III), it can be concluded that migration offers an improvement over taking no action upon detection of a CPU stress situation. However, the migration mechanism does not achieve as much benefit as the replication mechanism does. The comparison of the web servers’ response time (Table IV) shows that both relocation mechanisms help in reducing the average connection time. However, the comparison between the second and third runs does not offer conclusive results. In conclusion, when a hardware node experiences a CPU stress situation and the CPU is exhausted, some requests will not be satisfied. Both relocation mechanisms offer a convenient solution, since they help to reduce the losses. However, the migration process competes with the containers for CPU cycles in the CPU stressed hardware node, hence diminishing the benefit the migration mechanism could provide. 3) Experiment 3: In the first run of the experiment, Golondrina was monitoring the CPU utilization of the hardware node and containers, but no action was taken in response to CPU stress situations. Figure 12 shows the CPU utilization of containers A, B, C and D, and the CPU utilization and predicted CPU utilization (as explained in Subsection III-B1) of the hardware node bravo02. The first time the CPU utilization of bravo02 went over the 150% threshold was at t = 17. Golondrina’s CPU stress detection mechanism signaled the problem at t = 22. Since no action was taken, the CPU stress situation persisted and was signaled every single time until t = 51 (included). Starting at t = 23 the CPU was equally shared between the four containers, using almost 50% each. However, the number of CPU cycles allocated to each container was not enough for the hosted web servers to process all requests.
The web server one.com, hosted in A, had 36 lost requests out of 300 (client-timo 36), resulting in an effectiveness of 88%. The web server two.com, hosted in B, had 24 lost requests out of 300 (client-timo 24), resulting in an effectiveness of 92%. The web server three.com, hosted in C, had 39 lost requests out of 300 (client-timo 39), resulting in an effectiveness of 87%. The web server four.com, hosted in D, had 6 lost requests out of 300 (client-timo 6), resulting in an effectiveness of 98%. It can be seen in Figure 12 that at t = 47, when A saw a decrease in its CPU utilization, the remaining containers had a peak in their CPU utilization. This behaviour could be attributed to the hosted web server processing all the requests that could not be satisfied before due to a lack of CPU cycles. The web server one.com had an average connection time of 2916.9 milliseconds. The web server two.com had an average connection time of 2462.3 milliseconds. The web server three.com had an average connection time of 2537.6 milliseconds. The web server four.com had an average connection time of 2268.5 milliseconds. In the second run of the experiment, Golondrina was to search for feasible replications if a CPU stress situation was detected. Figure 13 shows the CPU utilization of containers A, B, C and D, and the CPU utilization and predicted CPU utilization of the hardware node bravo02. Figure 14 shows the CPU utilization of the replicas A’, B’, C’ and D’, and the CPU utilization and predicted CPU utilization of bravo03. The first CPU stress situation in bravo02 was signaled at t = 23. Golondrina determined that containers A, B and C had to be replicated in bravo03. By t = 27 the replicas A’, B’ and C’ had been created and the load balancer at the gate of the cluster was updated. The load balancer was updated (and restarted) three times (one for each replication) in the period (27, 28). During that period and the following one, it can be seen in Figure 13 that the CPU utilization of A, B, C and D decreased, due to connections that were refused or reset. At t = 28, containers A’, B’ and C’ had a low CPU utilization and remained with minimal CPU utilization until t = 31 (included). During those periods, the requests were handled by A, B and C. In consequence, an additional CPU stress situation was signaled in bravo02 at t = 30. Golondrina determined that D had to be replicated in bravo03, indicating also that the action would not be enough to dissipate the CPU stress situation in bravo02. The web server one.com, hosted in A and A’, had 7 failed requests (connrefused 4 connreset 3) and 2 lost requests (client-timo 2) out of 300, which resulted in an effectiveness of 97%. The web server two.com, hosted in B and B’, had 6 failed requests (connrefused 5 connreset 1) and 5 lost requests (client-timo 5) out of 300, which resulted in an effectiveness of 96.33%. The web server three.com, hosted in C and C’, had 10 failed requests (connrefused
2010, © Copyright by authors, Published under agreement with IARIA - www.iaria.org
International Journal on Advances in Software, vol 3 no 3 & 4, year 2010, http://www.iariajournals.org/software/
345
Figure 12.
Figure 13.
Experiment 3 - No Action
Experiment 3 - Replication, bravo02
2010, © Copyright by authors, Published under agreement with IARIA - www.iaria.org
International Journal on Advances in Software, vol 3 no 3 & 4, year 2010, http://www.iariajournals.org/software/
346
Figure 14.
Experiment 3 - Replication, bravo03
5 connreset 5) and 1 lost requests (client-timo 1) out of 300, which resulted in an effectiveness of 96.33%. The web server four.com, hosted in D and D’, had 9 failed requests (connrefused 5 connreset 4) and 2 lost requests (client-timo 2) out of 300, which resulted in an effectiveness of 96.33%. The web server one.com had an average connection time of 1151.3 milliseconds. The web server two.com had an average connection time of 1130.8 milliseconds. The web server three.com had an average connection time of 1281.0 milliseconds. The web server four.com had an average connection time of 1275.9 milliseconds. In the third run of the experiment, Golondrina was to look for migrations upon detection of a CPU stress situation. Figure 15 shows the CPU utilization of containers A, B, C and D, and the CPU utilization and predicted CPU utilization of the hardware node bravo02. Figure 16 shows the CPU utilization of A and B, and the CPU utilization and predicted CPU utilization of bravo03. A CPU stress situation was signaled at t = 24 in bravo02. Golondrina determined that container A was to be migrated to bravo03. The migration process was started, increasing the CPU utilization in bravo03. The CPU in bravo02 was already exhausted, so the migration process competed for the CPU with the containers. The four containers saw a reduction in their CPU allocation in the interval [26, 28] until the migration process ended in the period (28, 29). At t = 29, A had a peak of around 170% in CPU utilization. Taking advantage of the CPU availability, containers B,
C and D increased their CPU utilization during the interval [29, 33], what caused a second CPU stress situation to be signaled at t = 30. At that time, Golondrina decided to migrate B to bravo03. The migration process ended in the period (35, 36) and B reached a peak of around 85% in CPU utilization after being migrated. A final CPU stress situation was signaled at t = 37 with the CPU utilization of bravo02 being 150.48% and becoming 100.5% at the following point in time. Golondrina found no solution to the situation. The web servers one.com and two.com, hosted in A and B respectively, had 18 lost requests out of 300 (client-timo 18), which resulted in an effectiveness of 94%. The web server three.com, hosted in C, had 14 lost requests out of 300 (client-timo 14), which resulted in an effectiveness of 95.33%. The web server four.com, hosted in D, had 19 lost requests out of 300 (client-timo 19), which resulted in an effectiveness of 93.66%. The web server one.com had an average connection time of 1051.0 milliseconds. The web server two.com had an average connection time of 1412.8 milliseconds. The web server three.com had an average connection time of 1343.0 milliseconds. The web server four.com had an average connection time of 1248.8 milliseconds. As in the second experiment, it can be concluded that container migration offered an improvement over taking no action upon detection of a CPU stress situation. Once more, the benefits offered by the replication mechanism exceeded
2010, © Copyright by authors, Published under agreement with IARIA - www.iaria.org
International Journal on Advances in Software, vol 3 no 3 & 4, year 2010, http://www.iariajournals.org/software/
347
Figure 15.
Experiment 3 - Migration, bravo02
Figure 16.
Experiment 3 - Migration, bravo03
2010, © Copyright by authors, Published under agreement with IARIA - www.iaria.org
International Journal on Advances in Software, vol 3 no 3 & 4, year 2010, http://www.iariajournals.org/software/
348 Table V E XPERIMENT 3 - P ERCENTAGE OF SUCCESSFUL REQUESTS Web Servers’ Effectiveness Servers
Run 1
Run 2
Run 3
one.com two.com
88%
97%
94%
92%
96.33%
94%
three.com
87%
96.33%
95.33%
four.com
98%
96.33%
93.66%
Table VI E XPERIMENT 3 - W EB SERVERS ’ AVERAGE CONNECTION TIME IN MILLISECONDS
1: 2: 3: 4: 5: 6: 7: 8: 9: 10: 11:
for i = 0 to SH.length() do while SH[i] is stressed do CT = pickMostHeavilyLoadedCT(SH[i]); targetHN = pickMostLightlyLoadedHN(NSH); if SH[i].CPULoad > t then ExecuteReplication(CT, targetHN); else ExecuteMigration(CT, targetHN); end if end while end for Algorithm 2: Relocation policy
Web Servers’ Response Time Servers
Run 1
Run 2
Run 3
one.com
2916.9
1151.3
1051.0
two.com
2462.3
1130.8
1412.8
three.com
2537.6
1281.0
1343.0
four.com
2268.5
1275.9
1248.8
the benefits obtained through migration. V. D ISCUSSION The experiments presented in Section IV show that both relocation mechanisms offer an improvement over taking no action upon detection of a CPU stress situation. Even if there are spare CPU cycles to allocate in the stressed hardware node, the mechanisms do not have a negative impact, which supports the use of the relocation mechanisms as preventive actions in case the resource utilization were to continue increasing in the stressed hardware node. The replication mechanism offers a better improvement over the migration mechanism. One exception is the scenario where enough spare CPU cycles are available at the stressed hardware node for the migration process to use. In that scenario, the hosted containers see no performance degradation during the migration process, and hence the migration mechanism provides the same benefits as the replication mechanism. This suggests the creation of a policy that can be briefly described as follows: Replication is preferred over migration when the CPU utilization is high. If the CPU utilization is relatively low, then the migration mechanism is preferred. An algorithm that implements this policy is shown in Algorithm 2. This policy may result in more replicas being created than there are actually needed, but that can be dealt with by later terminating any of the replicas. As explained in Section III, this first prototype of Golondrina only manages CPU. Therefore, the prototype is limited in its relocation search feature (Subsection III-B3). A hardware node is classified as non-stressed based only on its CPU utilization. However, the hardware node could be stressed with respect to other resources (such as memory or network
bandwidth). The current version of the relocation search does not address this issue and thus a container that makes use of the stressed resource may be relocated to the hardware node, which intensifies the hardware node’s resource stress situation. Future work will address this limitation. Another interesting outcome of the experiments is the difference between the number of relocations expected in each experiment (as described in Subsection IV-A) and the number of relocations actually triggered by Golondrina to deal with the CPU stress situations. The first experiment resulted in two replications being triggered when only one should have been enough. The CPU stress situation that resulted in the second replication was caused by an improper balancing of the load for the web server two.com, hosted in B and B’, during the first four periods after the creation of B’. In the second experiment, no unexpected relocation took place. However, multiple CPU stress situations were signaled during the second run of the experiment. The reason why no additional replications were triggered resides on the managed system consisting only of two hardware nodes and Golondrina being restricted by the policy of not allowing two replicas of the same container to reside in the same hardware node. Had more hardware nodes been available or that policy not existed, Golondrina would have triggered additional replications. Once more, the CPU stress situations were originated on an improper working of the load balancer. The third experiment resulted in one additional replication being triggered due to the issue with the load balancer. In addition, a third CPU stress situation was unexpectedly signaled in the third run of the experiment. Be it noted, however, that that third CPU stress situation was more of a false alarm given that the CPU utilization of the hardware node was drastically decreasing in the period when the CPU stress situation was signaled. If the managed system had consisted of more than two hardware nodes, Golondrina would have triggered more relocations during the second and third experiments. Have additional relocations happened, the web servers’ effectiveness could have been improved, but with the cost of an overall
2010, © Copyright by authors, Published under agreement with IARIA - www.iaria.org
International Journal on Advances in Software, vol 3 no 3 & 4, year 2010, http://www.iariajournals.org/software/
349
lower CPU utilization at cluster-level. This may suggest that Golondrina should give a greater grace period to a stressed hardware node where actions have been taken to restore its stability before checking it again for CPU stress situations. This may suggest as well that the CPU stress detection mechanism should take into account CPU utilization trends (increasing or decreasing) instead of absolute measures of CPU utilization only. VI. R ELATED W ORK Virtualization has become an essential technology in the data center. First, because it enables server consolidation, which may result in lowering costs for building and running data centers. Second, because it creates a very dynamic environment where virtual servers can be resized and relocated on-demand, and new virtual servers can be promptly instantiated. However, this introduces new challenges, which are being addressed by the research community. Wood et al. studied two approaches to virtual server monitoring: black-box and grey-box [11]. Black-box monitoring consisted of collecting statistics from the virtual servers without directly contacting them. Grey-box monitoring required running an additional software module inside each virtual server to collect operating system statistics and process application logs. The authors concluded that the grey-box approach enabled the system to make better informed decisions. Still, Golondrina only implements black-box monitoring, since grey-box monitoring could be considered an invasive mechanism that clients might find undesirable. Zhao and Figueiredo studied the virtual server migration process to be able to predict its performance [12]. After several experiments, they concluded that the migration process’ time and performance could be predicted for a number of virtual servers based on measurements from a single virtual server. Kochut and Beaty worked on an analytical model to estimate the improvement in response time achieved through a virtual server migration [13]. Given the current system load and the virtual servers’ expected resource demand, the model could help determine whether a migration should be started and which virtual servers to migrate. These studies are important for the development of decision-making support mechanisms that could be used by management entities such as Golondrina’s Manager. Gmach et al. evaluated resource reallocation policies that a node controller could use to periodically do resource reallocation among virtual servers hosted in a physical server [14]. Their study showed that work conserving policies were more effective than non-work conserving policies and that dynamically adjusting workloads’ priority resulted in better compliance with Service Level Objectives. These results would be useful if we were to incorporate hardware nodelevel resource reallocation to Golondrina.
Zhu et al. developed an automated resource management system composed of three controllers that worked at different hierarchical levels and intervals in time [15]. Node controllers would reallocate resources among the workloads hosted in the physical server they were responsible for, pod controllers (a pod was a set of nodes) would migrate workloads between physical servers in their pod, and pod set controllers would migrate workloads between pods. The controllers implemented different analytic techniques, such as control theory, bin packing, and trace-based analysis. The integrated work of these controllers offered great results in terms of resource utilization and Quality of Service. Golondrina’s Manager component fulfills a similar role to that of the pod controller. However, Golondrina’s Manager executes both migrations and replications, whereas the pod controller only executes migrations. Kumar et al. addressed the lack of coordination between management systems in data centers [16]. They proposed a framework that loosely coupled platform management and virtualization management, and enabled coordinated management actions to be taken. They concluded from their experiments that coordinated management resulted in energy savings, greater stability, and better Quality of Service being provided. Munasinghe and Anderson worked on developing a data center architecture (hardware and software configuration) that could provide guaranteed Quality of Service to its clients [17]. They developed two mechanisms to do resource scaling: horizontal scaling (virtual server replication), and vertical scaling (resource allocation adjustments and virtual server migration). Their approach to resource scaling was similar to the one implemented in Golondrina. Their prototype at the moment, however, could not do horizontal scaling. VII. C ONCLUSION AND F UTURE W ORK This work is one of the very few (if any at all) that proposes a resource management system for operating systemlevel virtualized environments. In addition, this is the first study that uses replication as an alternative to migration and compares both mechanisms. Others have proposed to do replication, but have not done it [11]. Others have implemented replication, but not migration [17]. There are many ways in which Golondrina could be extended. One of them is implementing a mechanism to monitor the activity of replicas and stop those that become unnecessary (see Section V). Another extension is to implement a CPU under-stress detection mechanism, which would detect and suspend lightly loaded hardware nodes. Adding memory and network as managed resources is obviously a very attractive extension. A second prototype of Golondrina has already been developed featuring a memory stress detection mechanism and a simple heuristic for adjusting memory allocations [18].
2010, © Copyright by authors, Published under agreement with IARIA - www.iaria.org
International Journal on Advances in Software, vol 3 no 3 & 4, year 2010, http://www.iariajournals.org/software/
350
Currently, we are studying the interaction between the CPU and memory subsystems and the management strategies that can be implemented to solve different combinations of resource stress situations. ACKNOWLEDGMENTS
[12] M. Zhao and R. J. Figueiredo, “Experimental study of virtual machine migration in support of reservation of cluster resources,” in VTDC ’07: Proceedings of the 3rd international workshop on Virtualization technology in distributed computing. New York, NY, USA: ACM, 2007, pp. 1–8.
R EFERENCES
[13] A. Kochut and K. Beaty, “On Strategies for Dynamic Resource Management in Virtualized Server Environments,” in MASCOTS ’07: Proceedings of the 2007 15th International Symposium on Modeling, Analysis, and Simulation of Computer and Telecommunication Systems. Washington, DC, USA: IEEE Computer Society, 2007, pp. 193–200.
[1] G. Keller and H. Lutfiyya, “Replication and migration as resource management mechanisms for virtualized environments,” in ICAS ’10: Proceedings of the 2010 Sixth International Conference on Autonomic and Autonomous Systems. Washington, DC, USA: IEEE Computer Society, 2010, pp. 137–143.
[14] D. Gmach, J. Rolia, and L. Cherkasova, “Satisfying service level objectices in a self-managing resource pool,” in SASO ’09: Proceedings of the 2009 Third IEEE International Conference on Self-Adaptive and Self-Organizing Systems. Washington, DC, USA: IEEE Computer Society, 2009, pp. 243–253.
[2] A. McCloskey, B. P. Simmons, and H. Lutfiyya, “Policy-based dynamic provisioning in data centers based on slas, business rules and business objectives,” in IEEE/IFIP Network and Operations Management Symposium (NOMS 2008), Salvador, Bahia, Brazil, Apr. 2008. [Online]. Available: http://ieeexplore.ieee.org/xpls/abs all.jsp?arnumber=4575243
[15] X. Zhu, D. Young, B. J. Watson, Z. Wang, J. Rolia, S. Singhal, B. McKee, C. Hyser, D. Gmach, R. Gardner, T. Christian, and L. Cherkasova, “1000 islands: Integrated capacity and workload management for the next generation data center,” in Proceedings of the 2008 International Conference on Autonomic Computing (ICAC’08), Chicago, IL, USA, Jun. 2008, pp. 172–181. [Online]. Available: http://ieeexplore.ieee.org/xpl/freeabs all.jsp?arnumber=4550838
We would like to thank the National Sciences and Engineering Research Council (NSERC) of Canada for their support.
[3] P. Padala, K. G. Shin, X. Zhu, M. Uysal, Z. Wang, S. Singhal, A. Merchant, and K. Salem, “Adaptive control of virtualized resources in utility computing environments,” in EuroSys ’07: Proceedings of the 2nd ACM SIGOPS/EuroSys European Conference on Computer Systems 2007. New York, NY, USA: ACM, 2007, pp. 289–302. [4] (2010, Aug.) Openvz http://openvz.org/
project.
[Online].
Available:
[5] K. Kolyshkin. (2005) Virtualization in linux. openvzintro.pdf. Documentation on OpenVZ. [Online]. Available: http://download.openvz.org/doc/OpenVZ-Users-Guide.pdf [6] G. Box, G. M. Jenkins, and G. Reinsel, Time Series Analysis: Forecasting And Control, 3rd ed. Prentice Hall, Feb. 1994. [7] C. Hyser, B. Mckee, R. Gardner, and B. J. Watson, “Autonomic virtual machine placement in the data center,” HP Laboratories, Palo Alto, CA, USA, Tech. Rep. HPL-2007189, Dec. 2007.
[16] S. Kumar, V. Talwar, V. Kumar, P. Ranganathan, and K. Schwan, “vmanage: loosely coupled platform and virtualization management in data centers,” in ICAC ’09: Proceedings of the 6th international conference on Autonomic computing. New York, NY, USA: ACM, 2009, pp. 127– 136. [17] G. Munasinghe and P. Anderson, “Flexiscale - next generation data centre management,” in UKUUG Spring Conference, 2008. [Online]. Available: http://homepages.inf.ed.ac.uk/dcspaul/publications/ukuug2008.pdf [18] A. Pokluda, G. Keller, and H. Lutfiyya, “Managing dynamic memory allocations in a cloud through golondrina,” in Proceedings of the 4th International DMTF Academic Alliance Workshop on Systems and Virtualization Management (SVM’10), Oct. 2010, (Accepted to appear).
[8] (2010, Aug.) Don quijote by miguel de cervantes saavedra - project gutenberg. [Online]. Available: http://www.gutenberg.org/etext/2000 [9] (2010, Aug.) The apache http server project. [Online]. Available: http://httpd.apache.org/ [10] (2010, Aug.) Httperf site. HP Labs. [Online]. Available: http://www.hpl.hp.com/research/linux/httperf/ [11] T. Wood, P. Shenoy, A. Venkataramani, and M. Yousif, “Black-box and gray-box strategies for virtual machine migration,” in Proceedings of the Fourth Symposium on Networked Systems Design and Implementation (NSDI’07), Cambridge, MA, USA, Apr. 2007, pp. 229–242. [Online]. Available: http://www.usenix.org/events/nsdi07/tech/wood.html
2010, © Copyright by authors, Published under agreement with IARIA - www.iaria.org