Storage Systems With Heterogeneous IO Workloads. Zhengyu Yangâ ...... 187â200. [7] âDell fluid cache for storage area networks,â http://www.dell.com/learn/.
GR E M: Dynamic SSD Resource Allocation In Virtualized Storage Systems With Heterogeneous IO Workloads Zhengyu Yang∗ , Jianzhe Tai∗ , Janki Bhimani∗ , Jiayin Wang‡ , Ningfang Mi∗ , and Bo Sheng‡ ∗ Dept.
of Electrical & Computer Engineering, Northeastern University, 360 Huntington Ave., Boston, MA 02115 of Computer Science, University of Massachusetts Boston, 100 Morrissey Boulevard, Boston, MA
‡ Dept.
Abstract—In a shared virtualized storage system that runs VMs with heterogeneous IO demands, it becomes a problem for the hypervisor to cost-effectively partition and allocate SSD resources among multiple VMs. There are two straightforward approaches to solving this problem: equally assigning SSDs to each VM or managing SSD resources in a fair competition mode. Unfortunately, neither of these approaches can fully utilize the benefits of SSD resources, particularly when the workloads frequently change and bursty IOs occur from time to time. In this paper, we design a Global SSD Resource Management solution - GR E M, which aims to fully utilize SSD resources as a secondlevel cache under the consideration of performance isolation. In particular, GR E M takes dynamic IO demands of all VMs into consideration to split the entire SSD space into a long-term zone and a short-term zone, and cost-effectively updates the content of SSDs in these two zones. GR E M is able to adaptively adjust the reservation for each VM inside the long-term zone based on their IO changes. GR E M can further dynamically partition SSDs between the long- and short-term zones during runtime by leveraging the feedbacks from both cache performance and bursty workloads. Experimental results show that GR E M can capture the cross-VM IO changes to make correct decisions on resource allocation, and thus obtain high IO hit ratio and low IO management costs, compared with both traditional and state-ofthe-art caching algorithms. Keywords—Solid State Drives, Resource Allocation, Virtualized Storage Systems, Caching Algorithms, Bursty Detection, I/O Workload Characterization
I.
I NTRODUCTION
Virtualized systems nowadays are a basic supporting infrastructure in commercial cloud computing environments. In such a virtualized system, multiple virtual machines (VMs) often share storage services, and each VM has its own workload pattern and IO requirements. It then becomes very important to provide high performance and availability to virtual machines. Therefore, flash-based Solid-State Drives (SSDs) are widely being deployed as a per-virtual disk, second-level cache of Hard Disk Drives (HDDs) in virtualized systems to improve IO access performance (e.g., increasing IO throughput and reducing IO latency), and achieve low power consumption. In most of these shared virtualization platforms, SSD is statically pre-allocated to each virtual disk (VMDK) for simplicity, and the caching algorithm decides the cache admission and eviction for each VM only based on IO requests from that particular VM regardless of IOs from the others. It is difficult This work was partially supported by National Science Foundation grant CNS-1552525, National Science Foundation Career Award CNS-1452751, and AFOSR grant FA9550-14-1-0160. c 2016 IEEE 978-1-5090-5252-3/16$31.00
for the hypervisor to cost-effectively partition and allocate SSD resources among multiple VMs, particularly under diverse IO demands, because it lacks a global view of the clusterwide disk IO activities. Therefore, in this paper, we focus on addressing a critical design problem for a virtualized storage system, i.e., how to dynamically partition flash-based SSDs among multiple VMs and cost-effectively update the content of SSDs according to VM workload changes? The goal of this design is to fully leverage the outstanding performance of shared SSD resources under the global view of caching management. Typically, there are two straightforward approaches that allocate SSD resources among VMs by either equally or proportionally assigning SSDs to each VM or managing SSD resources in a fair competition mode. In the former approach, all VMs are purely isolated in using their own SSDs and the caching management is fully affected by their own workload changes. While, the second approach allows all VMs to freely use or share the entire SSDs, such that the caching management is centrally interfered by the intensity of all workload changes. However, we found that neither of these approaches can fully utilize the benefits of SSDs, especially when the workloads frequently change and bursts or spikes of IOs occur from time to time. For instance, if SSDs are equally reserved and assigned to all VMs, then VMs with bursty IOs cannot obtain more SSD resources. On the other hand, the second approach solves this issue by allowing all VMs to preempt or compete SSD resources based on their present IO demands. As a result, VMs with higher IO demands can occupy more SSDs by evicting less-accessed data from other VMs. However, under this approach, VMs with bursty IOs might occupy almost all the SSD resources, and then pollute the critical caching of other VMs. It is even worse that bursty workloads usually have less re-accesses in the long term. In this paper, we strive to solve the above problems by designing a new Global SSD Resource Management solution, named “GR E M”, which takes dynamic IO demands of all VMs into consideration to split the entire SSD space into a long-term zone and a short-term zone and update the content of SSDs in these two zones cost-effectively. Intuitively, the long-term zone is designed for reserving SSD resources for each VM, in order to cache their own hottest data without any pollution from other VMs. Such a long-term zone is expected to guarantee high hit ratios from VMs that have cache-friendly workloads. On the other side, the short-term zone is used to absorb and handle bursty IOs (mostly from VMs with cache-unfriendly workloads) by being fairly competed among VMs according to their data popularities. In addition, we use a coarse temporal (e.g., 5min) and spatial (e.g., 1M B) granularity to update the
contents of SSDs in the two zones for reducing the cost of managing and operating SSD resources. An important issue in the design of this new global Flash manager is “how to dynamically partition SSD resources into two zones?” and “how to further dynamically allocate SSD resources in the long-term zone to different VMs?”. It is very challenging to effectively address this issue because we often have VMs with heterogeneous IO workloads (e.g., with a mix of cache-friendly and cache-unfriendly workloads) to share SSD resources and their IO access patterns can frequently change across time. Equally partitioning SSDs in the longterm zone to each VM can only improve the hit ratio for each VM to some extent, but cannot best utilize the reserved SSD resources in the long-term zone. Not all VMs keep fully utilizing their reserved SSDs during their lifetime, as their working data sets might be smaller than its reserved SSD space, or IO popularities of their data blocks decrease during some periods. Thus, GR E M dynamically reserves SSDs in the long-term zone for each VM based on its runtime workload changes. Similarly, evenly splitting SSDs into the long- and short-term zones does not consider the diversity and dynamics in IO workloads. Therefore, we further develop D_GR E M, a dynamic version of GR E M, which online monitors the changes in IO demands of all VMs as well as the SSD allocation performance (e.g., IO hit ratios) and uses this information to dynamically partitioning SSD resources between two zones, and reserving different amounts of SSD resources to each VM. We conduct trace-driven experiments by replaying real enterprise IO workloads, and evaluate the effectiveness of our new global resource management scheme with respect to IO hit ratio and IO cost. Experimental results show that our GR E M well utilizes the benefits of SSDs with the improvement of IO hit ratios across different IO workloads. By dynamically partitioning SSDs into two functional zones, D_GR E M further increases IO hit ratio, especially for those VMs with cacheunfriendly workloads. Meanwhile, both GR E M and D_GR E M are able to save the operational cost of SSDs by up to 85%. The remainders of this paper is organized as follows. Section II presents our understanding of IO access patterns in real production systems, and discusses the limitations of existing SSD resource allocation solutions. Section III introduces the details of our algorithms that can dynamically assign SSD resources to multiple VMs, considering both performance isolation and workload changes. Section IV evaluates the effectiveness of our algorithms. Section V describes the related work. Finally, we summarize our findings and discuss the future work in Section VI. II. M OTIVATION In a virtualized storage system, SSDs are commonly shared by multiple VMs with heterogeneous IO workloads and caching requirements. An effective resource management scheme should absorb hot data in SSDs, ensure good performance isolation across VMs, and maintain high resource utilization of SSDs. To achieve this goal, we need to thoroughly understand IO access patterns of heterogeneous VM workloads and dynamically allocate SSDs among these VMs according to IO workload changes. Therefore, in this section, we present our analysis of IO access patterns in real production systems, and discuss the limitations of two straightforward approaches.
A. Understanding IO Access Patterns We studied a suite of real IO traces to analyze and understand IO access patterns in enterprise production systems. [MSR Cambridge] One week IO block traces collected by MSR Cambridge in 2007 [1]. In these IO traces, each data entry describes an IO request, including timestamp, disk number, logical block number (LBN), number of blocks and the type of IO (i.e., read or write). There are 36 traces from MSRCambridge, which includes a variety of workloads. [FIU] Two sets of IO block traces collected by Florida International University (FIU) [2]. FIU IODedup contains collected downstream of an active page cache for three weeks in 2008. FIU SRCMap covers IO accesses from an email server, a virtual machine monitor running two web servers, and a file server workload during 2008-2009. [UMASS] Two financial IO traces (Fin1 and Fin2) from OLTP applications running at large financial institutions and three IO traces (WebSch1, WebSch2 and WebSch3) from a web search engine [3]. Table I shows some statistical results of selected IO traces, including: • Hit Ratio: the percentage of IOs that are hit in SSDs under the LRU algorithm with a fully associative cache of 4KB cache line and 1GB cache size. • Working Volume (W V ) Size: the total amount of data (in bytes) accessed in the disk. • Working Set (W S) Size: the total address range (in bytes) of accessed data, which is the unique set of W V . A large working set covers more disk space. If the cache size is larger than or equal to a workload’s W S, then the IO hit ratio of this workload can be close or equal to 100% under the LRU caching algorithm [4]. • Sequential Ratio (Seq): the amount (in bytes) of total sequential IOs (both read and write) divided by the total IO amount (in bytes). In general, SSDs have better performance under sequential IOs than under random IOs. • Write IO Ratio (W r): the number of write IOs divided by the total number of IOs. • Peak Throughput (IOPS): the peak throughput of the IO workload (with the sampling window of 5 min). As shown in Table I, high variance can be found in IO hit ratios across different IO workloads. For example, the IO hit ratio is more than 90% under the MSR-hm0 workload while the IO hit ratio under the MSR-src21 workload is less than 3%. We thus coarsely classify these IO workloads into two categories: (1) cache-friendly workloads (e.g., MSR-hm0, UMASS-Fin1) always obtain high IO hit ratios, while (2) cache-unfriendly workloads (e.g., MSR-web2, FIU-hm2i1) have relatively low IO hit ratios. We observe that the working set (i.e., the unique data blocks) in cache-friendly workloads (denoted as "F" in Table I) is usually small, which indicates V high spatial locality (i.e., high reuse ratio, defined as W W S ), and thus is highly likely to be cached and hit in SSDs. In contrast, cache-unfriendly workloads (denoted as "U" in Table I) often have large working volume sizes (see the W V column in Table I) and working set sizes (see the W S column in Table I). This observation motivates that we should differentiate these two classes of workloads by reserving a particular amount of SSD resources for VMs that have cache-friendly workloads to hold their popular data blocks. Moreover, the reserved SSDs
Group
MSR-F1
MSR-F2
MSR-U
FIU-F1
FIU-F2
FIU-U
Umass-F Umass-U
S TATISTICS FOR S ELECTED MSR-C AMBRIDGE , FIU AND UMASS WORKLOADS . Trace Name mds0 stg0 usr0 src12 hm0 prn0 web0 web1 stg1 usr2 web2 src21 wbusr1 wbrsh5 wbmal4 wbmal5 hm4t3 hm4t1 wbusr3 mal1c1 hm2i1 hm2i2 hm3m3 hm3m2 Fin1 Fin2 WebSch1 WebSch2 WebSch3
Hit (%) 90.84 89.28 88.25 85.63 91.34 85.16 77.14 54.25 34.59 19.48 6.2 2.82 83.78 74.92 70.8 70.18 83.38 76.97 75.98 72.04 41.41 28.04 26.79 17.23 99.07 98.51 6.08 6.3 6.15
WV (GB) 67.83 21.63 31.81 16.00 27.88 132.65 67.82 135.66 203.47 1060.78 339.16 339.15 15.22 15.75 36.48 36.35 283.40 264.81 15.75 557.74 258.32 391.50 37.25 36.49 1289.06 1.16 33.35 33.35 33.35
WS (GB) 6.43 13.21 7.49 5.14 9.03 32.74 14.91 8.68 162.03 763.12 152.65 41.63 0.32 0.41 5.87 4.39 1.65 1.67 3.55 36.27 15.68 5.27 0.48 0.04 1.08 1.11 18.37 18.98 19.21
Seq (%) 32.50 42.43 64.38 42.45 33.76 38.71 40.37 84.57 85.64 77.64 85.43 89.50 62.29 73.23 48.28 49.89 87.22 41.95 69.11 94.96 61.77 74.19 82.65 80.27 32.52 11.79 1.78 3.71 14.62
Wr (%) 88.11 84.81 59.58 74.63 64.50 89.21 70.12 45.89 36.25 18.87 85.43 2.14 99.97 100.00 85.20 87.26 99.91 92.66 87.48 88.35 76.31 91.45 99.17 99.85 76.84 17.65 0.02 0.02 0.03
P eak IOP S 207.02 187.01 138.28 143.51 271.65 254.55 249.67 146.44 197.75 584.50 0.75 303.64 1.83 31.64 136.25 156.63 467.58 118.98 129.10 488.93 284.06 371.74 39.36 1.88 218.59 159.94 355.38 375.02 245.09
do not need to be too large to guarantee high hit ratios of VMs with cache-friendly workloads since their working set sizes are usually small. (a) mds0 Accessed Data (MB)
3000 2500 2000 1500 1000 500 1 34 67 100 133 166 199 232 265 298 331 364 397 430 463 496 529 562 595 628 661 694 727 760 793 826 859 892 925 958 991 1024 1057 1090 1123 1156 1189 1222 1255 1288 1321 1354 1387 1420 1453 1486 1519 1552 1585 1618 1651 1684 1717 1750 1783 1816 1849 1882 1915 1948 1981 2014
0
Epoch (5min) Accessed Data (MB)
14000
(b) usr2
12000 10000 8000 6000 4000 2000 1 34 67 100 133 166 199 232 265 298 331 364 397 430 463 496 529 562 595 628 661 694 727 760 793 826 859 892 925 958 991 1024 1057 1090 1123 1156 1189 1222 1255 1288 1321 1354 1387 1420 1453 1486 1519 1552 1585 1618 1651 1684 1717 1750 1783 1816 1849 1882 1915 1948 1981 2014
0
Epoch (5min)
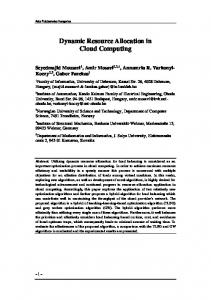
Fig. 1. Examples of bursty IOs (e.g., runtime working set sizes) under (a) cache-friendly workload mds0 and (b) cache-unfriendly workload usr2 .
Fig. 1 further shows the runtime working set sizes (W S) of two MSR workloads during every 5min epoch. We observe that cache-unfriendly workloads (see plot (b) in Fig. 1) have more IO spikes (i.e., a large amount of unique data blocks accessed during a short period of time) than cache-friendly workloads (see plot (a) in Fig. 1). These IO spikes in cacheunfriendly workloads are much more frequent, which can dramatically degrade IO hit ratios due to the first-time cache miss and even worse pollute the critical data in SSDs. This observation implies that VMs with cache-unfriendly workloads need to be assigned with a large amount of SSDs during their bursty periods to absorb and handle their bursty IOs for improving their hit ratios. However, to avoid severe cache pollution, allocated SSDs should not overlap the reserved SSDs for cache-friendly workloads. Therefore, a new SSD resource management scheme is needed to discriminate cache-friendly and cache-unfriendly workloads and improve IO performance for both types of workloads.
VM Occupancy Ratio (%)
TABLE I.
Fair Competition (b) COMP
100 100 90
8080 70
6060 50
4040 30
2020 10
00
0
100
100
200
300
300
400
500
500
600
700
700
800
900
900
1000
1100
1100
1200
1300
1300
1400
1500
1500
1600
1700
1700
1800
1900
1900
2000
Epoch (5min) src12
Fig. 2.
stg0
usr0
stg1
usr2
web2
src21
Runtime SSD allocation among VMs under fair competition.
B. Limitations of Straightforward Approaches Two straightforward approaches can be used to allocate SSD resources among multiple VMs. The first approach (referred to as “performance isolation”) is to proportionally reserve SSD resources for each VM in the system such that all VMs are purely isolated in using their own assigned SSD resources. Different cache replacement algorithms (e.g., LRU [5], CAR [6], DellFluid [7], Mercuy [8], and SCE [9]) can be used by each VM to cache their recently accessed data blocks and the caching management is fully affected by their own workload changes. In contrast, the second approach [10], [11] (referred to as “fair competition”) manages SSD resources in a fair competition mode by allowing all VMs to freely use or share the entire SSDs. A caching algorithm is usually used to centrally decide which data blocks should be held in SSDs for all VMs. Consequently, the caching management is inevitably interfered by the intensity of all workload changes. However, we found that neither of these approaches can fully utilize the benefits of SSDs when some of VMs have bursty IO workloads during runtime. To understand the limitations of these two approaches, we run trace-driven simulations by replaying a mix of real IO workloads and investigate the assignment of SSD resources to each VM (or each workload) across time duration about one week. We find that although the first approach (i.e., performance isolation) is able to avoid performance interference, VMs with bursty IOs unfortunately have no chance to obtain more SSD resources during their bursty periods. Each VM keeps the fixed amount of SSDs during their runtime. On the other hand, the second approach solves this issue by allowing all VMs to compete SSDs based on their present IO demands. As shown in Fig. 2, VMs (e.g., cache-unfriendly workloads web2 and usr2) occupy more SSD resources when there are IO spikes in their workload. Thus, their IO hit ratios are improved and the overall utilization of SSD resources is increased as well. However, we notice that under this approach, VMs with bursty IOs might occupy a large amount of the SSD resources (e.g., web2 at epoch 900 in Fig. 2) during their bursty periods by evicting other cached data, which might pollute critical caching of VMs with cachefriendly workloads and then degrade their IO hit ratios. III. D ESIGN AND A LGORITHMS A. Basic Idea of GR E M As observed in Section II, VMs with cache-friendly workloads can usually achieve high hit ratios when only a small amount of their critical data blocks (i.e., their working sets) are cached in SSDs. However, VMs with cache-unfriendly workloads often have spikes (i.e., a large amount of unique data blocks) of IOs across time, which can incur a significant amount of cache misses and further pollute the critical caching
of other VMs. In order to ensure all VMs benefit from SSDs, we design a new resource management scheme, named GR E M, which strives to discriminate different workload types (e.g., cache-friendly and cache-unfriendly workloads) by splitting SSDs into two zones (denoted as “ZL ” and “ZS ” see Fig. 3) such that one zone is designed for reserving SSD resources for each VM and the other zone is used to absorb and handle bursty IOs. GR E M manages SSD resources underlying the VM page buffer layer, thus it does not need to (reversely) interact with the VM page buffers.
Algorithm 1: Dynamic Partition in ZL 1 2 3 4 5 6 7 8 9 10
In particular, we refer “ZL ” to as a “Long-term Zone”, which is expected to cache the most popular data blocks for each VM based on their IO access frequency during a long period. Furthermore, SSD resources in “ZL ” are reserved for each VM such that their critical and popular data blocks can be kept in SSDs without any pollution from other VMs, which thus guarantees a high hit ratio from VMs with cache-friendly workloads. We refer “ZS ” to as a “Short-term Zone”, where SSD resources are fairly competed among VMs based on the popularities of their recently accessed data during a short period. Consequently, VMs with cache-unfriendly workloads can have a high chance to get SSD resources in ZS to cache data for their bursty IOs and achieve an improved IO hit ratio. Given the total capacity of SSD resources CT , we have CT
=
CZ L + CZ S ,
(1)
where CZL and CZS denote the capacities of ZL and ZS , respectively. Furthermore, given m VMs running in the system, each VM iP will be assigned with CZL (i) SSD resources in ZL m such that i=1 CZL (i) = CZL . Therefore, the design goal of GR E M is to determine the proper values of CZL , CZS , and CZL (i) in order to maximize the overall IO hit ratio and minimize the IO cost for operating IO access and updating SSD content. B. Dynamically Partition of the Long-term Zone As introduced in Sec. III-A, GR E M attempts to reserve SSD resources in ZL for each VM in order to ensure each VM have their own private SSDs to cache their critical hot data. One straightforward approach is to partition zone ZL among VMs equally or proportionally, i.e., CZL (i) = CZL · wi , where wi is a fixed weightPbased on the Service-Level Agreement m (SLA) for VM i and i=1 wi = 1, and reserve a fixed amount (i.e., CZL (i)) of SSDs in ZL for VM i. However, we found that this approach is ineffective when workloads frequently change and spikes of IOs occur across time. Reserved SSD resources cannot be fully utilized when some VMs start to have a low IO access rate and meanwhile other VMs may not be able to obtain sufficient SSDs when they experience bursty IOs that need to access a large amount of unique data blocks (i.e., large working sets). Therefore, we develop a dynamic partitioning algorithm for GR E M to dynamically decide the capacity (i.e., CZL (i)) for each VM’s reserved SSDs in ZL based on not only each VM’s access history in a long term but also their IO workload changes. Here, we assume that the capacities of two zones are fixed, e.g., CZL = CZS = C2T . Later, we present a new version of GR E M that adjusts the zone sizes in an online mode. [Dynamic ZL Partition and Cache Replacement Solution] Alg. 1 describes the procedure of GR E M, including how GR E M periodically updates the content in both ZL and ZS , and how GR E M online adjusts the amount of reserved SSDs
11 12 13
14 15 16 17 18 19 20 21 22 23 24 25 26 27 28 29 30 31 32 33
Procedure GR E M() UpdateLongTermZone(); UpdateShortTermZone(); f lashBin = shortBin + longBin; return f lashBin; Procedure UpdateLongTermZone() if size(historyBin) ≤ size(longBin) then longBin = historyBin.keys; else /* the max number of bins to be cached in ZL */ j = size(longBin); /* the top j popular bins */ itemH = number of j bins in historyBin.keys with highest historyBin.values; /* the evicted bins due to newly cached bins */ evictBin = bins of longBin which are not in itemH; longBin = itemH; return; Procedure UpdateShortTermZone() if size(longBin) < size(historyBin) ≤ CT then /* Case 1: warming up period */ shortBin = the remaining bins of historyBin.keys which are not in longBin; else if size(historyBin) > size(f lashBin) then /* Case 2: historyBin, evictBin, currEpochBin and existing bins in shortBin compete in the ZS */ shortBin − = bins of shortBin which are also in longBin; currEpochBin − = bins of currEpochBin which are also in longBin; if size(currEpochBin) ≥ size(shortBin) then j = size(shortBin); shortBin = number of j bins in currEpochBin with highest IO popularity; else shortBin + = evictBin; shortBin − = bins of shortBin which are also in currEpochBin; j = size(shortBin) − size(currEpochBin); shortBin = number of j bins in shortBin with highest IO popularity; shortBin + = currEpochBin; return;
in ZL for each VM. historyBin is a dictionary in which key is bin IDs of all VMs and value is the relative access count for each bin. currEpochBin is the accessed bins of all VMs in current epoch. shortBin and longBin are the cached bins of all VMs in ZS and in ZL , respectively. f lashBin is those bins need to be cached in Flash. Fig. 4 further shows the procedures of GR E M for cache admission and cache eviction. The key idea of GR E M is that the amount of reserved SSDs in ZL for each VM should be proportional to their long-term access behaviors. When the distribution of data bin popularities changes, GR E M dynamically adjusts the reservation of SSD resources for each VM in order to fully utilize the ZL zone. In detail, GR E M maintains a long-term IO access history for all running VMs (i.e., “historyBin” in Fig. 4) to record the accumulative IO popularity statistics for their bins (e.g., each bin size is 1M B). This historical information can be saved in the RAM. Similarly, these long-
CT CZL
VM1
VM2
VM3
VM4 Fair Competition
Performance Isolation
Fig. 3.
Based on the detected result, the strategy switcher will make different partitioning decisions for improving the SSD resource utilization.
CZS Short-term Zone (ZS)
Long-term Zone (ZL)
(i) Non-Bursty Case ZL
Basic structure of GR E M.
Feedbacks
Long-term Zone
Short-term Zone
longBin
shortBin
ZS
SSD CurrEpoch Workloads Change
Hit in ZL
Cache Hit
Hit in ZS
RAM
SSD
currEpochBin
SSD NextEpoch
Bursty Detector
Partition based on hit contribution ratio ρ
historyBin EvictBin
currEpochBin
RAM (a) Bursty
Lower Priority
longBin
Short-term Zone currEpochBin Higher Priority
Non-bursty
ZS
ZL
SSD CurrEpoch
Hit in ZL
Evict to HDD Strategies
Long-term Zone
(ii) Bursty Case
Strategy Switcher
SSD Lowest Priority
Aggressive Allocation
Conservative Adjustment
RAM SSD NextEpoch
Next Epoch
(b)
(a)
Fig. 4. High level idea of GR E M: (a) cache admission and (b) cache eviction.
term IO access records are incrementally updated every time epoch (e.g., every 5 min). An aging function is also used to capture the variation of IO popularities over time. Recent IO popularities (i.e., collecting IO activities in recent time epochs) are assigned with higher weights for contributing more to the accumulative IO popularity statistics. Once the IO popularity statistics are updated, GR E M selects the most popular bins with their overall size is equal to CZL , and then sets the amount of reserved SSDs for VM i, i.e., CZL (i), to the total size of its popular bins that have been selected and cached in ZL (see lines 6-15 in Alg. 1 and Fig. 4(a)). By this way, GR E M also updates the content of SSDs in ZL by caching the most popular bins with total size of CZL . On the other hand, GR E M attempts to leverage the recent data access information (e.g., the current epoch) to update the short-term zone ZS (see lines 16-33 in Alg. 1 and Fig. 4(b)). In particular, GR E M also records the IO popularity statistics for all bins that were accessed in the last epoch (i.e., “lastEpochBin” in Fig. 4) in the RAM. The most popular bins that have not been cached in ZL are then cached in ZS . The total size of these cached bins is bounded by CZS . We notice that it is possible that all accessed bins in the “lastEpochBin” might have the total size less than CZS . In such a case, GR E M further considers to cache the bins that are just evicted from ZL . C. Dynamical Partition for ZL and ZS : D_GR E M GR E M statically and equally partitions SSDs into two zones, i.e., CZL = CZS = C2T . However, we find that such a partitioning unfortunately may not be optimal to general cases. For example, if workloads have a large number of bins being popular only during a short period, then ZS may not be large enough to handle bursty IOs that access those bins. This can cause a very low IO hit ratio and increase the operational costs for caching new bins in ZS . To solve this problem, we design a bursty-detection based partition algorithm that allows GR E M to dynamically adjust the sizes of ZL and ZS . We refer this new version of GR E M to as D_GR E M. Fig. 5(a) depicts the high level sketch of D_GR E M consisting of two main components, i.e., bursty detector and strategy switcher. The bursty detector takes the feedbacks of workload changes and cache performance (e.g., IO hit or IO miss) as the input to determine if the current workload is bursty or non-bursty.
SWQf
SWLt
Qualification Threshold SlidingWindow (descending sort)
ZS ZL Aggressively allocate ZS based on SWQf
(b)
Fig. 5. (a) The high level sketch of D_GR E M. (b) Dynamic partition of ZL and ZS of D_GR E M.
1) Bursty Detection: Basically, bursts or spikes contain a relatively high number of IO accesses on a large amount of working set data. They often occur within a short time period. The bursty detector is expected to help D_GR E M decide (1) when to adjust the partition of SSDs, and (2) how to divide SSD resources between two zones. We find that the capacity adjustment of two zones is needed when the number of popular bins or the working set size significantly changes. Intuitively, the new capacity of each zone should be related with the number of popular bins in the current spike, the bin reuse rates, the bin access history during previous epochs, and the hit counts in the ZL and ZS . Therefore, D_GR E M uses a sliding window (SW ), e.g., 5 min, to record IO access history for all VMs in recent epochs. Again, this historical information can be kept in the RAM. D_GR E M tracks the changes in the working set sizes between the current (i.e., |W ScurSW |) and previous (i.e., |W SprevSW |) sliding windows. The relative difference between these two sliding windows is then defined as bursty degree (denoted as Bd ) as follows. Bd
= =
∆(W ScurSW , W SprevSW ) ||W ScurSW | − |W SprevSW || . |W ScurSW |
(2)
The value of Bd is a good indicator of working set changes across time. The bursty detector claims the arrival of bursty IOs when the value of Bd is beyond a predefined threshold β. We set β to 0.6 in our experiments. 2) Non-Bursty Case Strategy: When there is no burstiness in current IO workloads, i.e., Bd < β, D_GR E M tunes the splitting point between two zones (i.e., ZL and ZS ) by leveraging the feedback of each zone’s caching performance under the present partition (as shown in Fig. 5(b)(i)). In particular, we evaluate the importance of two zones (i.e., their contributions to the overall IO performance) by recording the total IO hit volumes (i.e., the amount of all cached data that are hit by one or multiple IOs) in each zone during the recent epoch (e.g., 5 min). We define a contribution ratio ρ as follows: ρ=α×
HVL , HVS
(3)
where α ∈ [0, 1] is a tunable parameter of importance, and HVL and HVS represent the IO hit volumes of ZL and ZS , respectively. By default, α = 0.35. Once ρ is updated at the end of an epoch, D_GR E M adjusts the capacities of two zones for next epoch using Eq.(4).
(
CT CZS = 1+ρ , CZL = CT − CZS ,
(4)
where CT is the capacity of SSDs and CZS and CZL are the new anticipated capacities of ZL and ZS , respectively. Intuitively, the zone that contributes more to the overall hit ratio is highly likely to get more SSD resources and the allocation of SSDs is proportional to the contribution ratio. 3) Bursty Case Strategy: When bursty IOs are identified by the bursty detector, D_GR E M turns to aggressively shift SSD resources from one zone to the other. Using the contribution ratio as a feedback to reset the capacities of two zones unfortunately does not work well under this case because this approach cannot quickly adapt to workload changes. The corresponding delay can further incur “cascade effect" (also called “thrashing effect”) of insufficient capacity in one of the zones. For example, when bursty IOs that access new bins arrive, the IO hit volume of ZS in the current epoch might not be large enough to get more SSDs for handling those bursty IOs. Consequently, this zone’s IO hit volume becomes even less in the next epoch, which indicates less importance and then keeps reducing the capacity of ZS if we use Eq.(4). To avoid such a cascade effect, we attempt to dynamically and aggressively assign more SSDs to ZS when bursty IOs are found in workloads, and further to minimize the penalty on ZL ’s caching performance. The general idea of our approach is that if the working set size of accessed bins in the current epoch increases dramatically compared with the previous epoch, then it would also be helpful if we increase the size of ZS for absorbing the spikes in the near future. Meanwhile, we should ensure those popular bins, which are cached in ZL and are recently hit, to keep staying in ZL , as shown in Fig. 5(b)(ii). Therefore, we use the sliding window (SW ) to record IO popularity statistics for all bins that are accessed in recent several epochs (instead of the latest one). D_GR E M identifies all bins that are recorded in the current sliding window and are also cached in the ZL zone. We refer this set of bins to as “BSW Lt ”. D_GR E M uses the average number of accesses (BSW Lt ) of all bins in BSW Lt as a criterion to set the threshold (T hSW ) for choosing hot bins to be cached in ZS as follows. T hSW = γ × BSW Lt ,
(5)
where γ is an adjustment parameter, and is set to 1.2 by default. D_GR E M then finds all the bins that have been accessed in the current sliding window more than T hSW times but are not currently cached in ZL . We refer this set of “qualified” bins to as “BSW Qf ”, as: BSW Qf = {x|x ∈ SW, x ∈ / BSW Lt , x > T hSW }.
(6)
We then set the anticipated capacity of ZS to the total size of bins in BSW Qf . CZS = |BSW Qf | .
(7)
4) Dynamic Tuning Procedure: As shown in Fig. 5(a), initially, capacities of both two zones are set to half of the entire SSDs. D_GR E M recalculates Bd , the present bursty degree at the end of each sliding window and determines if bursty IOs are arriving by comparing with the threshold β. Under the bursty case, D_GR E M aggressively enlarges the capacity of ZS according to Eq.(7). On the other hand, D_GR E M bases on the contribution ratio of two zones to adjust the allocation of SSDs to these zones when there is no burstiness, as shown in lines. A boundary checking is further considered to ensure the minimum capacity for each zone.
IV. E VALUATION In this section, we conduct trace-driven evaluation by replaying real enterprise IO workloads. We implement two versions of our proposed algorithm: (1) GR E M that assigns 50% of the total SSDs to each of two zones, and adaptively adjusts partitions of each VM in ZL according to the workload change; and (2) D_GR E M that further dynamically adjusts the sizes of ZL and ZS during runtime. For comparison, we also implement conventional caching algorithms, such as global LRU (GLRU) [5] and global CAR [6], and a recently proposed tiering algorithm V FRM [10]. We evaluate the effectiveness of GR E M with respect to our primary goals, i.e., maximizing the IO hit ratio and minimizing the IO cost incurred in managing SSDs. A. Testbed and Implementation Details Our evaluation environment is calibrated based on the real testbed specs summarized in TableII. In detail, to deal with the management across physical nodes and multiple tiers, we adopt the same hybrid file developed in our previous work [10], which consists of two “files”: a base file on the spinning disk tier and a corresponding peer file on the Flash tier. Furthermore, we use the following three key techniques to lower the overhead: (1) a “Pointer Block Cache” of the peer file is used as the block look up table, which can eliminate the need for an extra lookup table; (2) a “Heat Map” is used to represent the IO popularity statistics of each "1MB block" of the files on VMFS, and 1MB block only requires 16 bytes to hold the popularity stats, which is only 0.0015% of the size of the VMDK; and (3) a “Tiering Map” is used to represent the placement of the blocks between tiers, whose space overhead is about 0.00001% of the size of the VMDK. Moreover, both the heat and tiering maps do not need to be pinned in memory permanently. Lastly, based our observation in Sec. II and our offline sensitivity analysis results, we set 1MB and 5min as spatial and temporal granularities, respectively, to avoid adverse impact from spikes as well as to reduce the caching management overhead. TABLE II. Component Processor Processor Cores Memory Capacity Operating system Linux Kernel SSD Model SSD Capacity HDD Model HDD Capacity
T ESTBED S PECS . Specs Intel Xeon E5-2430 2.20GHz 6 Cores 48GB ECC DDR3 R-DIMMs Ubuntu 12.04.5 3.14 Mainline Intel DC S3500 Series 80 GB Western Digital 20EURS-63S48Y0 (5400 RPM) 2 TB
B. IO Hit Ratio Fig. 6 shows the overall (i.e., read & write) IO hit ratios as a function of SSD cache size (in GB) under diverse workloads that are mixed with different MSR, FIU and UMASS repositories. For example, “FIU-F1U” is a mixed workload with the IO traces of “FIU-F1” and “FIU-U”, where “F” and “U” refer to cache-friendly and cache-unfriendly workloads, as summarized in Table I. In overall, we can see that GR E M and D_GR E M are superior to other existing caching algorithms. For instance, Fig. 6(a) presents the results under MSR-F1, a cache friendly workload. When the cache size is smaller than 2GB, V FRM, GR E M and D_GR E M all have lower IO hit ratios than the conventional algorithms. However, as the
(b) MSR−F2
90 85 80 75 1
2
4
8 12 16 Cache Size (GB)
24
32
(c) MSR−U
1
2
4
8
60 55
35 2
4
8
16 24 32 48 64 80 96 128 Cache Size (GB)
4
8
10
12 16 20 Cache Size (GB)
24
LRU
GLRU LRU Global
vFRM vFRM vFRM
8
16 24 32 48 64 80 96 128 Cache Size (GB) (h) UMASS
80 75
70 60 50 40
4
Global vFRM vFRM
CAR
80
8
10
12 16 20 Cache Size (GB)
GREM
24
32
4
8
10 12 16 20 Cache Size (GB)
24
32
D_GREM
1
2
4
38.81%
8 12 Cache Size (GB)
36.73%
36.49%
16
24
36.49%
32
(d) (a) FIU–F1U (d) FIU–F1U F1U 91.60%
86.38%
4
8
92.08%
GR EGlobal M Global−vFRM vFRM
93.41%
10 12 Cache Size (GB)
94.47%
16
100.00%
32
100 90 80 70 60 50 40 30 20 10 0
D_GR EM Global Global
12.69%
12.69%
12.60%
1
2
4
12.94%
(c) (c) MSR–F1U MSR−F1U
13.25%
8 12 Cache Size (GB)
14.04%
15.18%
16
24
15.09%
Normalized IO IO Cost (%)(%) Normalized Cost
38.04%
vFRM vFRM vFRM
32
100 90 80 70 60 50 40 30 20 10 0
14.76%
14.66%
14.32%
2
4
8
(e) (e) FIU-F2U FIU–F2U (b) FIU−F2U 120 110 100 90 80 70 60 50 40 30 20 10 0
89.82%
4
92.56%
8
92.59%
91.79%
10 12 Cache Size (GB)
91.58%
16
97.58%
32
Normalized IOIO CostCost (%) (%) Normalized
58.00%
50.95%
Normalized IOCost Cost Normalized IO (%) (%)
61.32%
d-e: Global−LRU LRU
Global –STFRM D_GR EM –Auto Global Global
GREM Global−vFRM vFRM Global
(b)(b)MSR–U MSR−U
Normalized IO Cost Normalized IO Cost (%) (%)
Normalized IO (%) (%) Normalized IOCost Cost
4
IO hit ratio results of workload combinations of MSR, FIU and UMASS repositories under different cache sizes and caching algorithms. a-c:
Normalized IOCost Cost Normalized IO (%) (%)
2
90
32
(a)(a)MSR–F1 MSR−F1
Fig. 7.
35 25
12 16 24 32 40 48 64 Cache Size (GB)
70
GLRU
120 110 100 90 80 70 60 50 40 30 20 10 0
8
Hit Ratio (%)
65
50
40
100
Hit Ratio (%)
Hit Ratio (%)
Hit Ratio (%)
40
100 90 80 70 60 50 40 30 20 10 0
4
85
45
Fig. 6.
2
(f) FIU−F1U
50
45
(g) FIU−F2U
60 55
50
30 1
70
65
30
55
12 16 24 32 40 48 64 Cache Size (GB)
(e) MSR−F2U
(d) MSR−F1U 60
40 35 30 25 20 15 10 5
Hit Ratio (%)
Hit Ratio (%)
Hit Ratio (%)
95
100 95 90 85 80 75 70 65
Hit Ratio (%)
(a) MSR−F1 100
120 110 100 90 80 70 60 50 40 30 20 10 0
14.20%
15.63%
16
24
(f) UMASS Cache Size (GB) (f) UMASS
LRU Global−LRU
vFRM vFRM
Global−CAR CAR
GREM_EQ Global−vFRM UMASS
15.96%
32
15.59%
48
15.52%
64
D_GR–ESPFRM M Global –Auto
60.23%
53.65% 42.89% 25.53%
1
22.33%
2
4 Cache Size (GB)
8
32
Normalized IO cost of MSR, FIU and UMASS workloads, which is total latencies of read/write operations of SSD and HDD.
capacity of SSDs increases to 4GB, D_GR E M outperforms GLRU and CAR. When we have more than 8GB SSDs, the IO hit ratios under both GR E M and D_GR E M are beyond those of GLRU and CAR. More importantly, the conventional algorithms cannot take advantage of a large SSD cache. Their IO hit ratios reach to the converging point (i.e., about 94%) when the cache size is 4GB. In contrast, GR E M and D_GR E M can further use the benefits of the increasing SSD capacity to improve IO hit ratios up to 98%. Moreover, due to large working set sizes and bursty IOs, most caching algorithms, including GR E M, cannot achieve high IO hit ratios for cacheunfriendly workloads (e.g., MSR-U in Fig. 6(c)) even when we increase the SSD capacity. By dynamically adjusting the size of the short-term zone (ZS ) to absorb bursty IOs, D_GR E M keeps improving IO hit ratio up to 40% when we have 64GB SSDs. We further notice that D_GR E M still do not converge even with 64GB SSDs„ which indicates that this algorithm is able to further achieve better IO hit ratios. C. IO Cost Fig. 7 shows the normalized overall IO costs (SSD/HDD access and SSD-HDD contents updating latencies [11]) based on the measured data from an 80GB Intel DC S3500 Series SSD and a 2T B 5400 RPM Western Digital WD20EURS-63S48Y0 HDD, e.g., IO latencies of SSD/HDD read and write operations under 4KB and 128KB cache lines. In our evaluation, the conventional caching algorithms (i.e.,
GLRU and CAR) use 4KB as the cache line size, while other algorithms (i.e., V FRM, GR E M and D_GR E M) use the cache line size of 128KB and group IOs into 1M B bins. We observe that by using the coarse-update granularity, all these algorithms (e.g., V FRM and D_GR E M) significantly reduce the overall IO costs compared to the conventional caching solutions, especially when there are cache-unfriendly workloads (e.g., MSR-U and MSR-F1U). Furthermore, D_GR E M always achieves the lowest cost in all these cases. For example, as shown in Fig. 7(a), with 8GB cache size, the overall IO costs of MSR with four cache-friendly workloads under D_GR E M are 61.96% lower than GLRU, 11.77% lower than V FRM and 7.62% lower than GR E M. Similar observations can be found under cache-unfriendly workloads, see Fig. 7(b). In Fig. 7(c)-(d), we further investigate the IO costs under different algorithms when we have workloads mixed with both cache-friendly and cache-unfriendly workloads. Again, by dynamically adjusting the sizes of ZL and ZS and updating SSD content in the coarse granularity, D_GR E M significantly reduces cache pollution due to IO spikes, and avoids too frequent SSD content updates, which thus achieves much lower IO costs compared to the conventional caching algorithms, e.g., GLRU, CAR. Both GR E M and D_GR E M further slightly reduce the IO costs compared to V FRM, which also adopts the coarse granularity for SSD content updating, but cannot avoid bursty IOs evicting the cached critical data.
V.
R ELATED W ORK
Host-side caches are being widely accepted in modern storage systems. ARC [12] and LRFU [13] are commonly used caching algorithms that consider the frequency and recency of workloads. Inspired by ARC and based on Clock [14], CAR and CART [6] are developed to inherit virtually all advantages of ARC, but not serialize cache hits behind a single global lock. Studies [15], [16] investigated how to model the IO bandwidth performance, and designed a NUMA-aware cache mechanism to align cache memory with local NUMA nodes and threads. mClock [17] follows the proportional-share fairness approach which subjects to minimum reservations and maximum limits on the IO allocations for VMs. VirtualFence [18] is a storage system that provides predictable VM performance and conducts space-partitioning of both the SSD cache and the HDD. Studies [19]–[22] investigated SSD and NVMe storagerelated resource management problems, such as how to reduce the total cost of ownership and how to increase the Flash device utilization. A hypervisor-based design “S-CAVE”, was presented in [23]. Its optimization is based on runtime working set identification, while GR E M explores a different dimension by monitoring changes in data locality, burstiness and IO popularity. vCacheShare [24] presented a dynamic, self-adaptive framework for automated server flash cache space allocation in virtualization environments. However, it only treats SSD as a read-only cache and bypasses write IOs to the disk, which unfortunately degrades the overall hit ratio. Recently, [11] presented a new VMware Flash Resource Manager, named V FRM, which considers of both performance and incurred cost for managing Flash resources, and updates the content of SSDs in a lazy and asynchronous mode. VI.
[5]
[6]
[7] [8]
[9]
[10]
[11]
[12]
[13]
[14] [15]
[16]
C ONCLUSION
In this paper, we presented GR E M, a new global SSD resource management scheme to allocate a suitable amount of SSDs to heterogeneous VMs. The design goal is to best utilize the SSD resources by maximizing the IO hit ratio and minimizing the IO costs. GR E M splits the entire SSD space into the long-term and short-term zones and takes dynamic IO demands of all VMs into consideration for reserving SSD resources in the long-term zones to each VM. We further developed D_GR E M to dynamically adjust the partition of SSDs between two zones by leveraging the feedback of workload changes and SSD performance. We show that our new schemes allow VMs with different types of workloads to utilize the benefits of SSDs and thus improve the overall IO hit ratio. We also show that D_GR E M successfully detects the changes (or bursts) in IO workloads and quickly adapts to the changes by shifting SSD resources between two zones. The IO hit ratio is further improved under D_GR E M.
[17]
[18]
[19]
[20]
[21]
R EFERENCES [22] [1]
[2]
[3] [4]
D. Narayanan, A. Donnelly, and A. Rowstron, “Write off-loading: Practical power management for enterprise storage,” ACM Transactions on Storage, vol. 4, no. 3, pp. 10:1–10:23, 2008. R. Koller and R. Rangaswami, “I/O deduplication: Utilizing content similarity to improve i/o performance,” ACM Transactions on Storage (TOS), vol. 6, no. 3, p. 13, 2010. “UMass Trace Repository,” http://traces.cs.umass.edu/index.php/ Storage/Storage. C. Ding and Y. Zhong, “Predicting whole-program locality through reuse distance analysis,” in ACM SIGPLAN Notices, vol. 38, no. 5. ACM, 2003, pp. 245–257.
[23]
[24]
E. O’Neil, P. O’Neil, and G. Weikum, “The LRU-K page replacement algorithm for database disk buffering,” in Proceedings of the 1993 ACM SIGMOD international conference on Management of data, Washington, DC, 1993, pp. 297–306. S. Bansal and D. S. Modha, “CAR: Clock with adaptive replacement.” in Proceedings of the 2th USENIX Conference on File and Storage Technologies, vol. 4, 2004, pp. 187–200. “Dell fluid cache for storage area networks,” http://www.dell.com/learn/ us/en/04/solutions/fluid-cache-san. S. Byan, J. Lentini, A. Madan, L. Pabon, M. Condict, J. Kimmel, S. Kleiman, C. Small, and M. Storer, “Mercury: Host-side flash caching for the data center,” in IEEE 28th Symposium on Mass Storage Systems and Technologies, Pacific Grove, CA, 2012, pp. 1–12. H. Kim, I. Koltsidas, N. Ioannou, S. Seshadri, P. Muench, C. L. Dickey, and L. Chiu, “Flash-conscious cache population for enterprise database workloads.” in ADMS@ VLDB, 2014, pp. 45–56. D. Liu, N. Mi, J. Tai, X. Zhu, and J. Lo, “VFRM: Flash resource manager in vmware esx server,” in Network Operations and Management Symposium (NOMS), 2014 IEEE. IEEE, 2014, pp. 1–7. J. Tai, D. Liu, Z. Yang, X. Zhu, J. Lo, and N. Mi, “Improving flash resource utilization at minimal management cost in virtualized flashbased storage systems.” N. Megiddo and D. Modha, “ARC: A self-tuning, low overhead replacement cache,” in Proceedings of the 2nd USENIX Conference on File and Storage Technologies, San Francisco, CA, 2003, pp. 115–130. D. Lee, J. Choi, J.-H. Kim, S. Noh, S. L. Min, Y. Cho, and C. S. Kim, “LRFU: A spectrum of policies that subsumes the least recently used and least frequently used policies,” IEEE Transactions on Computers, vol. 50, no. 12, pp. 1352–1361, 2001. L. A. Belady, “A study of replacement algorithms for a virtual-storage computer,” IBM Systems journal, vol. 5, no. 2, pp. 78–101, 1966. T. Li, Y. Ren, D. Yu, S. Jin, and T. Robertazzi, “Characterization of input/output bandwidth performance models in numa architecture for data intensive applications,” in 2013 42nd International Conference on Parallel Processing. IEEE, 2013, pp. 369–378. Y. Ren, T. Li, D. Yu, S. Jin, and T. Robertazzi, “Design, implementation, and evaluation of a numa-aware cache for iscsi storage servers,” IEEE Transactions on Parallel and Distributed Systems, vol. 26, no. 2, pp. 413–422, 2015. A. Gulati, A. Merchant, and P. J. Varman, “mclock: handling throughput variability for hypervisor io scheduling,” in Proceedings of the 9th USENIX conference on Operating systems design and implementation. USENIX Association, 2010, pp. 437–450. C. Li, Í. Goiri, A. Bhattacharjee, R. Bianchini, and T. D. Nguyen, “Quantifying and improving i/o predictability in virtualized systems,” in Quality of Service (IWQoS), 2013 IEEE/ACM 21st International Symposium on. IEEE, 2013, pp. 1–6. Z. Yang, M. Awasthi, M. Ghosh, and N. Mi, “A fresh perspective on total cost of ownership models for flash storage,” in 8th IEEE International Conference on Cloud Computing Technology and Science. IEEE, 2016. Z. Yang and M. Awasthi, “Online flash resource migration, allocation, retire and replacement manager based on multiple workloads waf tco model,” 2015, uS Patent, US15/094971. J. Roemer, M. Groman, Z. Yang, Y. Wang, C. C. Tan, and N. Mi, “Improving virtual machine migration via deduplication,” in 2014 IEEE 11th International Conference on Mobile Ad Hoc and Sensor Systems (MASS). IEEE, 2014, pp. 702–707. J. Bhimani, J. Yang, Z. Yang, N. Mi, Q. Xu, M. Awasthi, R. Pandurangan, and V. Balakrishnan, “Understanding Performance of I/O Intensive Containerized Applications for NVMe SSDs,” in 35th IEEE International Performance Computing and Communications Conference (IPCCC). IEEE, 2016. T. Luo, S. Ma, R. Lee, X. Zhang, D. Liu, and L. Zhou, “S-CAVE: Effective ssd caching to improve virtual machine storage performance,” in Proceedings of the 22nd international conference on Parallel architectures and compilation techniques. IEEE Press, 2013, pp. 103–112. F. Meng, L. Zhou, X. Ma, S. Uttamchandani, and D. Liu, “vCacheShare: automated server flash cache space management in a virtualization environment,” in USENIX ATC, 2014.