Dynamics of Electromigration Induced Void in Submicron Cu Interconnects Arijit Roy Department of Electronics West Bengal State University Barasat, Kolkata, India 700 126 e-mail:
[email protected] Abstract— A combined driving force model consisting of
three driving forces is implemented for copper dual damascene line-via interconnects using finite element method. Good agreement is found between the experimental and computational results on the void volume at failure and time varying resistance change during electromigration stressing. The void evolution is also computed showing the process of the void growth that lead to the void observed at failure, and it is found that the void grows at the inner corner between the metallization and the via initially. The model predicts that, the driving force from the stress gradient dominates at the very beginning of the mass transport while in the latter stage, the electron-wind force dominates. Keywords-Electromigration; Modeling.
I.
Reliability;
Void
Dynamics;
INTRODUCTION
Electromigration (EM) is a phenomenon of directional mass-transport driven by high electrical field in metallic interconnections. This phenomenon is commonly observed when electrical current density in the interconnection is of the order of 104 A/cm2. In order to observe significant masstransport, the interconnection must be stressed with high density of electrical current. It is believed that, the masstransport in EM occurs through the diffusion process. Thus EM is a forced diffusion phenomenon. The diffusion is believed to happen by jumping of atoms with nearby vacancy sites. Since operating current density is significantly high in thin film metallization used for interconnections in ICs, EM causes formation of voids or hillocks in the metallization. Commonly, voids are observed at the cathode side and hillocks are observed at anode side of the metallization of interest such as Al or Cu-based metallization (in few metals such as Ta voids and hillocks are found to occur at the anode and cathode side respectively). Due to the formation of voids, the electrical resistance of the metallization increases and may reach to unacceptable level which causes circuit functional or parametric failure. Due to the formation of hillocks, short circuit may occur with the nearby device (or metallization). Occurrence of passivation or dielectric cracks is obvious due to
the formation of hillocks. Hence, one needs to concern about the EM in thin film metallization for reliable application in ICs. The conceptual understanding of the process started more than 100 years ago in 1907 with Skaupy, who possibly for the first time recognized that the moving conduction electrons can drag atoms (towards the electron flow direction) through a frictional force in pure metals [1]. He argued that the atoms which are not at the regular lattice sites, will experience a different electron pressure than the atoms at the regular sites. The direction of mass-transport depends on the balance between the electron wind force and the electrostatic field force. The threat of EM in microelectronic is realized around 1951. In 1955, Wever et al. reported rear earth shattering experimental results on the directional motion of atoms in EM. They use Al-Cu metallization system and marker in the metallization to understand the directional nature of EM induced mass-transport [2]. They reported that, the masstransport of both constituents took place toward the anode in the β-phase (which is an electron conductor) but that the direction of transport is reversed in the γ-phase (which is a hole conductor). This experiment is taken as strong evidence for momentum transfer from current carriers to mobile atoms, those on the point of making a diffusion jump. It is quite natural that the next experiment should be to examine the direction of mass-transport in pure metal. Wever observed marker motions in the high temperature portions of copper specimens carrying a current density of 2 MA/cm2 for a period of one or two days. At temperatures below 950 °C, the markers moved toward the cathode which corresponded to masstransport toward the anode [3]. In 1960s, Huntington and his co-workers (at the Rensselaer Ploytechnique Troy, New York) contributed significantly in understanding the phenomenon and presented a model of EM known as ‘ballistic model’ of EM [4]. (Today the force on the metallic ions due to the application of electric field is known as ‘direct force’ and the force from the electron current is known as ‘electron-wind force’ or ‘wind force’ in the phenomenon of EM). Since, then a huge amount of research works have been carried out on EM, especially from microelectronic reliability point of view. This can be assessed easily from the review
articles and book published on the phenomenon EM [5-11]. Among these published articles, the most recent review article on EM by C.M. Tan and A. Roy [10], is probably the longest documented work in the history of this topic. On the other hand the interconnect technology evolves a lot, starting from Al-alloy metallization to Cu-based interconnects in microelectronic chip. Not only that the patterning technologies also evolves due to the change in the materials and due to the ever increasing complexity. These evolutions change direction of the EM research time to time. The dynamic process of EM in Cu based interconnection provides additional insight to the physics of EM. Also, it allows us to move a step closer to predict the time to failure of Cu interconnects through simulation. An atomic flux divergence based model is developed using finite element method (FEM). The void evolution, void size at failure and resistance change profiles are obtained from the model. EM experimentation on submicron Cu dual damascene (DD) interconnection is performed and it is shown that model predictions agree well with the experimental observations.
I performed some preliminary investigations on the above procedure and found that by deleting 5 elements having the highest AFD per iteration from the stored array will not change the resulting void shape and size as compared to that after 5 iterations of deleting one element per iteration for the present mesh density used in this work. On the other hand, deleting more than 5 elements will not preserve the void size and shape. Thus, we adopted the procedure of deleting 5 elements per iteration to speed up the simulation by 5 times. is probably the longest documented work in the history of this topic. To relate the simulated degradation time with the physical time of EM process, one can proceed as follows. Since positive AFD represents the number of atoms decreasing per unit volume per unit time, for an element with volume of ve, ve×AFDe represents the average rate of the number of atoms decrease in the element. Here AFDe is the average AFD value in the element. Thus, the physical time to delete an element will be inversely proportional to ve×AFDe, and we can write the relationship as follows. P (1) te = ve × AFDe where P is a dimensionless proportional constant. Since, I delete 5 elements in an iteration, the corresponding physical time for an iteration can be written as 5 (2) t = t i
∑
e
e =1
where, ti is the depletion time in ith iteration. It is to be noted here that the sum in Eq. (2) is taken for the last 5 elements from array which stores the element AFD values in ascending order. After a complete iteration, resistance is computed and checked against the pre-selected failure criterion. The process continues until failure occurs. Once the failure occurs, the EM failure time is estimated as m
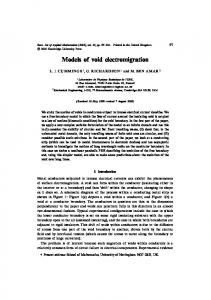
Fig. 1: Schematic of the test structure.
In this work, atomic flux divergence (AFD) based FEM for simulating EM voiding process in copper DD structure (see Fig. 1) is presented. The critical void volume for EM failure of the structure under consideration is estimated. The resistance change profile and void evolution during EM mass transport are also presented. II.
t f = ∑ ti
(3)
i =1
where m is the final iteration number at which failure occurs. The void volume at failure will be 2 times the total volume of all the deleted elements. The multiplication factor of 2 arises since only one half of the structure is considered in the model.
3-D MODELING
The static simulation of EM is performed first, and AFD distribution in Cu metallization near the via portion is obtained [12]. An array is then created to store the total AFD value of each element in ascending order at the end of every iteration. In order to simulate the void growth process and the resulting variation of AFDs and void shape change during the EM process, one needs to delete the element from the structure possessing highest AFD and then repeat the whole simulation again until failure occurs as defined by a resistance increase to a pre-selected level. However, such a process is time consuming.
III.
EXPERIMENTATION
Cu dual damascene samples of line width 0.7 μm and thickness 0.35 μm is fabricated and package level EM test is conducted with current density of 1 MA/cm2 at a test temperature of 300°C. Fig. 2 shows a micrograph (FIB-SEM) of a typical failed sample. The failure is found to occur in the M1 metallization underneath the cylindrical via as expected from the static FEM. The parameters r and d shown in Fig. 2 are found to be 0.19 μm and 45 nm respectively. Assuming the shape of void is cylindrical with diameter r and height d, the volume of the void is found to be 1.3×10⁻²¹ m3.
final void shape and location agree well with the experimental result shown in Fig. 2.
Fig. 2: SEM image of a typical EM failed sample.
IV.
RESULTS AND DISCUSSION
The resistance change and void volume as a function of time are obtained from model and shown in Fig. 3. In these evaluations, the unit of time is an arbitrary unit, since the fitting parameter P is unknown. It is found that the range of the P values from the fitting is from 1.7×10¹³ to 4.1×10¹³.
Fig. 4: Experimental and simulated resistance change profiles of the interconnection during EM.
Fig. 5: Computation results of the void size variation as a function of resistance change.
Fig. 3: Void volume and resistance change profile as a function of time during EM.
The interconnect resistance variation as a function of iteration number is obtained from the model and Fig. 4 shows the resistance change profiles from experiment and model with P value of 2.95×10¹³. The simulated void volume variation as a function of resistance change is shown in Fig. 5, and it is found that for the present case, the void volume at failure Vc=1.8×10⁻²¹ m3 and this value is found to be close to the void volume (1.3×10⁻²¹ m3) obtained from physical failure analysis assuming a cylindrical void. Fig 6 shows the evolution of void during the EM process. It is noted that the void initiation does not occur directly underneath the cylindrical via, instead it initiates at the inner corner between the M1 metallization and cylindrical via. The
Fig. 6: Void evolution process during EM. Void size (a), (b), (c) and (d) correspond to iteration number 2, 6, 9 and 13 respectively. The dark area represents void.
noticed that though the stress-induced driving force dominates in the early stage of the voiding, while the electron-wind force dominates at the later stage of the voiding process. REFERENCES [1] [2] [3] [4] [5] Fig. 7: Variation of AFDs as a function of time. EWF, SGIDF and TGIDF in the legend mean Electron Wind Force, Stress Gradient Induced Driving Force and Temperature Gradient Induced Driving Force respectively.
The variation of AFDs during void evolution is shown in Fig. 7. From this figure, it can be seen that the driving force from stress gradient is dominating at the beginning of the void formation while in the later part of the void evolution, electronwind force dominates. In other words, EM life-time can be improved by reducing the stress gradient induced driving force. Therefore, reducing the stress free temperature of the structure which in turn reduce the stress gradient induced driving force can enhance the EM lifetime of Cu interconnects, and this is indeed observed experimentally [13].
V.
CONCLUSON
A dynamic 3-D model is developed to study EM in Cubased submicron interconnects. Experiment is also conducted and presented to validate the model. Good correlation between the model predictions and experiment are found. It is also
[6] [7]
[8] [9] [10] [11] [12]
[13]
F. Skaupy, Verh. Dtsch. Phys. Ges., vol. 16, pp. 156, 1914; Z. Phys. Chem., vol. 58, pp. 560, 1907; Phys. Z., vol. 21, pp. 597, 1920. H. Wever, W. Seith, Z. Electrochem., vol. 59, pp. 942, 1955. H. Wever, Z. Electrochem., vol. 60, pp. 1170, 1956. H. B. Huntington, A. R. Grone, “Current-induced marker motion in gold wires”, J Phys. Chem. Solids, vol. 20, pp. 76, 1961. J. R. Lloyd and J. J. Clement, “Electromigration in copper conductors”, Thin Solid Films, vol. 262, pp. 135, 1995. J. R. Lloyd, “Electromigration in thin film conductors”, Semicond. Sci. Technol., vol. 12, pp. 1177, 1997. E. T. Ogawa et al., “Electromigration Reliability Issues in DualDamascene Cu Interconnections”, IEEE Trans. Relia., vol. 51(4), pp. 403, 2002. K. N. Tu, “Recent advances on electromigration in very-large-scaleintegration of interconnects”, J. Appl. Phys., vol. 94(9), pp. 5451, 2003. Baozhen Li, “Reliability challenges for copper interconnects”, Microelecton. Reliab., vol. 44, pp. 365, 2004. C. M. Tan and A. Roy, “Electromigration in ULSI interconnects”, Matrials Sci. Eng. Repports: R, vol. 58, pp. 1-75, 2007. Arijit Roy, Electromigration in Cu Interconnects: The Driving Force Formalism, Lambert Academic Publishing, Germany, 2011. Arijit Roy and Cher Ming Tan, “Probing into the asymmetric nature of electromigration submicron interconnect via structure”, Thin Solid Films, vol. 515, pp. 3867, 2007. Arijit Roy and Cher Ming Tan, “Experimental investigtation on the impact of stress free temperature on the electromigration performance of copper dual damascene submicron interconnect”, Microelecton. Reliab., vol. 46, pp. 1652, 2006.