EEG Epileptic Seizure Detection using k-Means Clustering and Marginal Spectrum based on Ensemble Empirical Mode Decomposition Paschalis A. Bizopoulos, Dimitrios G. Tsalikakis, Alexandros T. Tzallas, Dimitrios D. Koutsouris, Senior Member, IEEE and Dimitrios I. Fotiadis, Senior Member, IEEE
Abstract— The detection of epileptic seizures is of primary interest for the diagnosis of patients with epilepsy. Epileptic seizure is a phenomenon of rhythmicity discharge for either a focal area or the entire brain and this individual behavior usually lasts from seconds to minutes. The unpredictable and rare occurrences of epileptic seizures make the automated detection of them highly recommended especially in long term EEG recordings. The present work proposes an automated method to detect the epileptic seizures by using an unsupervised method based on k-means clustering end Ensemble Empirical Decomposition (EEMD). EEG segments are obtained from a publicly available dataset and are classified in two categories “seizure” and “non-seizure”. Using EEMD the Marginal Spectrum (MS) of each one of the EEG segments is calculated. The MS is then divided into equal intervals and the averages of these intervals are used as input features for kMeans clustering. The evaluation results are very promising indicating overall accuracy 98% and is comparable with other related studies. An advantage of this method that no training data are used due to the unsupervised nature of k-Means clustering.
I. INTRODUCTION
E
is one of the most common neurological disorders with a prevalence of about 1-2% of the world’s population [1]. Epilepsy is characterized by a sudden and recurrent malfunction of the brain which is named “seizure”. An epileptic seizure is a sudden PILEPSY
P.A. Bizopoulos is with the Biomedical Engineering Laboratory, School of Electrical and Computer Engineering, National Technical University of Athens (NTUA), GR-157 73 Zografou, Athens, Greece (e-mail:
[email protected]). D.G. Tsalikakis is with the Department of Informatics and Telecommunications Engineering, University of Western Macedonia, Kozani GR 50 100, Greece (e-mail:
[email protected]). A.T. Tzallas is with the Unit of Medical Technology and Intelligent Information Systems, Department of Materials Science and Engineering, University of Ioannina, Ioannina GR 45110, Greece and with the Department of Informatics & Telecommunications Technology Technological Educational Institute of Epirus, Arta, Greece (e-mail:
[email protected]). D.D. Koutsouris is with the Biomedical Engineering Laboratory, School of Electrical and Computer Engineering, National Technical University of Athens (NTUA), GR-157 73 Zografou, Athens, Greece (e-mail:
[email protected]). D.I. Fotiadis is with the Unit of Medical Technology and Intelligent Information Systems, Department of Materials Science and Engineering, University of Ioannina, Ioannina GR 45110, Greece and with the Biomedical Research Institute, FORTH, Ioannina GR 45 110, Greece (corresponding author: +30-26510-98803; fax: +30-26510-97092; e-mail:
[email protected]).
978-1-4799-3163-7/13/$31.00 ©2013 IEEE
synchronous and repetitive discharge of brain cells with symptoms depending on the location within the brain of the seizure onset, and the spread of the seizure. Long-term Electroencephalographic (EEG) monitoring is used to closely monitor patients over extended periods that have relatively infrequent but recurring atypical seizures or seizures. Long-term EEG monitoring comprises continuous multichannel EEG and video recording for several days. This allows the seizures to be “captured” for off-line analysis. This information enables the expert neurologist to determine whether or not such seizures are of epileptic origin and, if so, determine the type and location of the epileptogenic activity. Automated seizure detection schemes facilitate diagnosis of epilepsy and enhance the management of long-term EEG recordings. In general, automated epileptic seizure analysis refers collectively to methods for: (i) epileptic seizure detection [1-5], (ii) epileptic seizure prediction [6], and (iii) automatic focus channel identification [7]. In this paper, we focus on the automated epileptic seizure detection. Automated methods for epileptic seizure detection based on EEG analysis are related to: (i) the medical problem that they address [1], (ii) the methods they employ for analysis of the EEG signal [1-5], and (iii) the techniques they employ for the detection of epileptic seizures and the classification of the EEG segments [1-5]. The main objective of this study is to present an automated method for epileptic seizure detection from unlabeled segments. The general concept is the combination of EEMD as a feature extraction technique and the k-means Clustering as an unsupervised classification technique. II. METHODS A. Ensemble Empirical Mode Decomposition Empirical Mode Decomposition (EMD) is a fully datadriven method for decomposing non-linear, non-stationary signals. EMD generates a set of approximately orthogonal, monocomponent time signals of decreasing frequency, called Intrinsic Mode Functions (IMFs). IMFs have a wellbehaving Hilbert Transform and so their instantaneous frequencies can be calculated [8].
are defined as the extrema and the zero Ne , N z crossings of a function respectively. hmax (t ) and hmin (t ) are defined as the upper and lower envelopes of that function and T is the length of the signal. A monocomponent function satisfies the following conditions [9]: N z 1 Ne N z 1 ,
hmax (t ) hmin (t ) 2
0 , t 0, T .
n
k (t )
d k (t ) . dt
(8)
(1) (2)
Given a discretely sampled signal x(t ) , of a finite cardinality, on a finite discrete interval 1, T , the EMD algorithm can be applied [1, 3] and x(t ) can be represented as: x(t ) imf k (t ) r (t ), t 0, T ,
The Instantaneous Frequencies (IFs) k (t ) are defined as the derivative of the phase functions:
(3)
k 1
where r (t ) is the monotonous function that results from the EMD algorithm and is defined as the residue and imf k is the
k th IMF.
Using Eq. (7) the original signal can be reconstructed in the Hilbert-Huang Spectrum (HHS) from its IAs and IFs as follows: i k ( t ) dt n n HH (, t ) Z k (t ) ak (t ) e 0 , k 1 k 1 t
(9)
where denotes the real part. HHS offers a measure of amplitude contribution from each frequency and time. By integrating HHS over time the Hilbert Marginal Spectrum (HMS) is calculated: T
h( ) HH ( , t )dt .
(10)
0
The basic problem of EMD is Mode Mixing (MM) which is defined as the simultaneous presence of widely different rhythms in the same IMF, disabling any attempt to physically interpret the IMFs. Ensemble EMD (EEMD) is a Noise Assisted Data Analysis (NADA) method that was proposed to reduce the MM problems that EMD faces [8]. EEMD averages the IMFs, obtained by EMD, by applying to the signal independent series of Gaussian white noise, with a specific standard deviation N std . EEMD can be applied and x t is represented as the average over the ensemble [1]: imf k (t )
1 NE imfk ,m (t ) , NE m 1
(5)
After EEMD is applied, the signal is reduced to an orthogonal set of decreasing frequency monocomponent functions called IMFs. Hilbert Transform may be used for each IMF:
imf k (t ) d , t 1
(6)
where H denotes the Hilbert Transform. So by constructing a bank of analytical functions Z k (t ) we can associate the imf k (t ) with their Instantaneous Amplitudes (IAs) ak (t ) and their phase functions k (t ) :
Zk (t ) imf k (t ) i imf k (t ) ak (t ) ei k (t ) .
K-Means Clustering is an unsupervised learning method that classifies a given set of data using the distance of the feature points from the iteratively calculated centroids. The aim of this method is to minimize the sum of square errors within the clusters: k
set of the IMFs of the mth iteration of EEMD. The number of IMFs depends only on the length of the signal according to the following relation:
imf k (t )
B. K-Means Clustering
(4)
where NE is the Number of Ensemble and imf k , m (t ) is the
n log 2 T .
The difference of HMS from the corresponding Fourier analysis is that the existence of energy at a frequency ω, means that there is a higher likelihood for such wave to appear locally [9].
(7)
J xi c j
2
,
(11)
j 1 xi Si
where J is the objective function that needs to be minimized, k is the number of clusters, N is the number of features, xi is the i th data, S S1 , S2 , ..., Sk is the set of the
k clusters, c j is the j th centroid and distance measure.
.
is the chosen
III. RESULTS A publicly available dataset [11] is used in order to evaluate the proposed method. This dataset includes segments of both healthy and epileptic subjects and is split in five subsets of 100 independent segments with a sampling rate 173.61Hz. The sets Z and O have been measured using extracranial surface EEG recordings of five healthy subjects with eyes open and closed, respectively. The sets F and N have been acquired intracranially from the hippocampal formation and the epileptogenic zone. The set S consists of seizure activity from recording sites that exhibit ictal
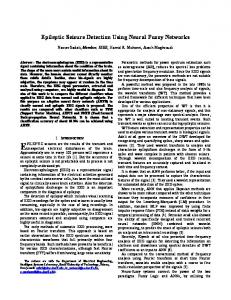
activity. All segments have 4096 samples so the number of IMFs is n = 12. For the purpose of this work the 5 sets were classified into two different classes: Z, O, F and N types of EEG segments were combined to a single class ZOFN and type S was the second class S. A. Feature Extraction and Selection The MS of 2 randomly selected signals from the 2 classes is shown in Fig.1:
The number of dimension that were used in this study were 2 d 9. B. Feature Clustering Instead of using the classic classification schemes we use a clustering technique based on k-Means Method for the average of the MS Intervals. The main idea is to define two centroids one for each cluster. This method aims at minimizing the objective function defined in Eq. (11), where the number of clusters that were used are k 2 and the number of data are 500. No seeds for the centroids were used therefore 2 random feature points were chosen as the initial means. Two distance measures were used; the squareEuclidean and the City Block. The results of k-Means Clustering using the previously generated features for the two low-dimensional cases (2-D and 3-D) are shown in Fig.3 and 4:
Fig.1 Marginal Spectrum of a Class ZOFN and S Signal.
A straightforward rule for separating these classes might be a simple threshold in the average MS of the test data. The Box plots of MS for the two classes in semi-log scale is shown in Fig.2: Fig.3. Evaluation of 2-Dimensional Feature Space using the City-Block Distance.
Fig.2. Box plots of Marginal Spectrum for Class ZOFN and Class S.
It is obvious from Fig.2 that using just the Mean of MS for each signal is insufficient when class separation is needed. For a threshold of MSt 0.2 the classification accuracy that is obtained is 90.6% which is considered as insufficient compared to recently published literature [1, 2, 3, 4, and 5]. So the rule that was applied for the feature extraction from the MS takes into account the different frequency components that Class ZOFN and S contain: Fd ,i Mean MS f ,
2 i 1 d
f
2i , 1 i d , (12) d
where Fd ,i is the i feature extracted from the d dimension of the feature space, Mean( . ) denotes the average, MS the Marginal Spectrum and f the frequency. th
Fig.4. Evaluation of 3-Dimensional Feature Space using the SquareEuclidean Distance.
where TP and FP are the True and False Positives respectively, for the corresponding classes and the centroids are denoted as a circle and an X for Class ZOFN and S Dimension respectively. So the coordinates of the centroids CClass in dB are calculated for the Class ZOFN: 2 CZOFN 20.84, 47.61 , 3 ZOFN
C
18.9, 36.06, 54.62 ,
(13) (14)
and for the Class S:
th
CS2 9.8 , 14.5 ,
(15)
C 11.1, 2.5, 22.18 .
(16)
3 S
TABLE I ACCURACY FOR A NUMBER OF MARGINAL SPECTRUM INTERVALS AND TYPES OF DISTANCES Number of Marginal Spectrum Intervals
Type of Distance
1
Euclidean
94,80
City Block
2
3
4
5
6
7
8
9
95,60
96,80
97,20
97,40
97,80
98,00
98,00
98,00
95,40
96,80
97,00
97,80
97,00
97,20
97,20
97,20
IV. CONCLUSIONS
REFERENCES
The accuracy results obtained from the proposed method for various number of MS Intervals and types of Distances used in k-Means Clustering are shown in Table I. A comparison of the classification accuracy obtained by our method and the methods that are presented in the literature is shown in Table II. Only the methods that evaluated the same dataset and the same two classes problem (ZOFN-S) are included. It is important to mention here that a method that discriminates EEGs into nonseizure (ZOFN) and seizure (S) is much closer in medical applications. For the specific problem, the results obtained from our method are promising; the difference between our results and works presented in the literature varies from -0.27% to 1.6% and due to the unsupervised nature of k-Means no training data were used unlike the other methods from the literature. It was also observed from Table I that further increase of the number of MS Intervals for feature selection does not increase the accuracy. The same applies for Sensitivity, when Euclidean distance is used, which reaches a maximum Euclidean SensZOFN 98,75% and SensSEuclidean 95,00% .
[4]
TABLE II
[8]
[1]
[2]
[3]
[5]
[6]
[7]
COMPARISON BETWEEN OUR METHOD AND OTHER METHODS PROPOSED IN THE LITERATURE FOR TWO CLASSES (ZOFN) AND S PROBLEM
[9] Author(s)
Method
Training Data /Test Data
Tzallas et al., 2007 [1]
Time-frequency Analysis & ANN
250/250
97.73%
250/250
98.27%
250/250
97.75%
Guo et al. 2010a[2]
Guo et al. 2010b[3]
a
Wavelet Transform Approximate Entropy & ANN Wavelet Transform – Line Length Feature & ANN
Accuracy
[11]
[12]
Liang et al. 2010[4]
Time-frequency AnalysisApproximate Entropy & SVMs
300/200
98.51%
Orhan et al. 2011 [5]
Wavelet Transform & ANN
250/250
99.60%
The Proposed Method
Ensemble Empirical Mode Decomposition & K-Means Clustering
0/500a
98%
No training data are used.
[10]
[13]
A.T. Tzallas, M.G. Tsipouras and D.I. Fotiadis, “Automatic seizure detection based on time-frequency analysis and artificial neural networks,” Comput Intell Neurosci, 80510, 2007. L.Guo, D. Rivero and A. Pazos. “Epileptic seizure detection using multiwavelet transform based approximate entropy and artificial neural networks,” J Neurosci Methods, Vol. 193, No. 1, 2010a, pp. 156-163. L. Guo, D. Rivero, J. Dorado, J.R. Rabunal., and A. Pazos (2010). “Automatic epileptic seizure detection in EEGs based on line length feature and artificial neural networks,” J Neurosci Methods, Vol 191, No.1, 2010b, pp. 101-109. S.F. Liang, H.C. Wang, and W.L. Chang. “Combination of EEG Complexity and Spectral Analysis for Epilepsy Diagnosis and Seizure Detection,” EURASIP Journal on Advances in Signal Processing, 853434, 2010. U. Orhan, M. Hekim, and M. Ozer. “EEG signals classification using the K-means clustering and a multilayer perceptron neural network model,” Expert Systems with Applications, Vol. 38, 2011, pp. 13475– 13481. F. Mormann, R.G. Andrzejak, C.E. Elger, and K. Lehnertz. “Seizure prediction: the long and winding road,” Brain, Vol. 130, 2007, pp. 314-333. J. Gotman, “Automatic detection of seizures and spikes,” J. Clin. Neurophysiol., Vol. 16, No. 2, 1999, pp. 130–140. Z. Wu and N.E. Huang, “Ensemble Empirical Mode Decomposition: A Noise-Assisted Data Analysis Method,” Advances in Adaptive Data Analysis. Vol.1, No.1, pp. 1-41, 2009. N.E. Huang, Z. Wu, S.R. Long, K.C. Arnold, X. Chen, K. Blank, “On instantaneous Frequency,” Advances in Adaptive Data Analysis. Vol.1, No.2, pp. 177-229, 2009. N.E. Huang, Z. Shen, S.R. Long, M.C. Wu, H.H. Shih, Q. Zheng, N.C. Yen, C.C. Tung and H.H. Liu, “The empirical mode decomposition and the Hilbert spectrum for nonlinear and nonstationary time series analysis,” Proceedings of the Royal Society London A. Vol. 454, No. 1971, 8 March 1998, pp. 903-995. R.G. Andrzejak, K. Lehnertz, F. Mormann, C. Ricke, P. David and C.E. Elger, “Indications of nonlinear deterministic and finitedimensional structures in time series of brain electrical activity: dependence on recording region and brain state,” Physical Review E, Vol.64, No.6, Article ID 061907, 8 pages, 2001. A.T. Tzallas, M.G. Tsipouras and D.I. Fotiadis, “Epileptic Seizure Detection in EEG Using Time-Frequency Analysis,” IEEE Transactions on Information Technology in Biomedicine, Vol. 13, No. 5, September 2009. H. Li, Y. Zhang and H. Zheng, “Hilbert-Huang transform and marginal spectrum for detection and diagnosis of localized defetcs in roller bearings,” Journal of Mechanical Science and Technology, Vol. 23, pp. 291-301, 2009.