Chiraporn Tocharoenchai, PhD*, Benjamin MW Tsui, PhD**, ... subset and postfiltered with a Butterworth filter with n = 5 and fc = 0.52 cycles/cm. Human ...
Effect of Attenuation Correction on Lesion Detection Using a Hybrid PET System Chiraporn Tocharoenchai, PhD*, Benjamin MW Tsui, PhD**, Eric C Frey, PhD**, Wen-Tung Wang, PhD*** * Department of Radiological Technology, Faculty of Medical Technology, Mahidol University ** Department of Radiology, Johns Hopkins University, USA *** Biomedical Engineering Department, University of Virginia, USA
Objective: The purpose of this study was to investigate the effect of attenuation correction (AC) on lesion detection for a hybrid PET system. Material and Method: Experimental list-mode data were acquired from hot spheres inside a uniform cylindrical phantom with an elliptical cross-section using a Siemens E.CAM+ dual-camera hybrid PET system. Spheres with inner diameters of 0.8- and 1-cm and the cylindrical phantom were filled with F-18 to simulate lesions with lesion-to-background (L/B) ratios of 14:1 and 8:1, respectively, found in clinical PET studies. The list-mode data of each sphere size were regrouped into sinograms with peak-to-peak energy window settings at 30% and 20% for the 0.8- and 1-cm diameter lesion, respectively. They were then rebinned using the single slice rebinning method. Attenuation correction was applied assuming uniform attenuation. The sinograms with and without AC were reconstructed using 5 iterations of OS-EM algorithm with 8 angles/ subset and postfiltered with a Butterworth filter with n = 5 and fc = 0.52 cycles/cm. Human observer performance study and localization receiver operating characteristic (LROC) analysis were used to evaluate the reconstructed images for maximum lesion detection. Average areas under the LROC curves (ALROC) across 8 observers obtained with and without AC were determined. The null hypothesis that there was no difference between with AC and without AC was tested using a two-tailed t-test with 95% confidence interval. Results: The results indicated that for the 0.8-cm lesion with 14:1 L/B ratio, the ALROC decreases from 0.66 to 0.62 when AC is applied as compared to without AC and from 0.69 to 0.63 for the 1.0-cm lesion with 8:1 L/ B ratio, but no statistical significant difference (p > 0.05). Conclusion: The authors conclude that for a phantom with hot lesions embedded in a uniform background, AC decreases lesion detectability compared to without AC using a hybrid PET system for small lesion sizes. Keywords: Hybrid PET, Attenuation correction, LROC study J Med Assoc Thai 2005; 88(1): 96-102 Full text. e-Journal: http://www.medassocthai.org/journal Positron emission tomography (PET) with F18-fluorodeoxyglucose (FDG) plays as an important role in cancer diagnosis. Hybrid PET system is an alternative when a dedicated PET system is not available. It allows the same system to perform both SPECT and PET imaging at a lower cost. It provides comparable spatial resolutions to a dedicated PET system. However, it has much lower sensitivity and count-rate performance resulting in poorer lesion detectability(1-3). Correspondence to : Tocharoenchai C, Department of Radiological Technology, Faculty of Medical Technology, Mahidol University, Bangkok 10700, Thailand.
96
In clinical oncology, the detection of lymph node involvements is important for cancer staging. The improvement in tumor detection is of interest for a hybrid PET system. Obviously, small lymph nodes in thoracic and abdominal regions suffer from low counts and photon attenuation. Attenuation correction has been used to improve the uniformity in the field-ofview and better quantitation. However, its effect on lesion detection remains unclear. The objective of this study was to investigate the effect of attenuation correction in small lesion detection with a hybrid PET system.
J Med Assoc Thai Vol. 88 No.1 2005
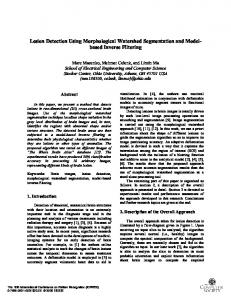
Material and Method Hybrid PET system A Siemens E.CAM+ dual-camera (Fig. 1) equipped with 1.58-cm-thick NaI (Tl) crystal with a field-of-view (FOV) of a 51.4 cm x 37.46 cm (Siemens Medical Systems, IL, USA) was used in the present study. The width of the coincidence-timing window, , was set at 6 nsec to identify prompt coincidence events (true + random + scatter). The estimated true coincidence events were obtained by subtracting random from the prompt coincidence events. To estimate the random coincidence events, an additional delayed timing window was used. To reduce random, scatter, and single events, a slat collimators (lead septa of 76.2 x 2.54 mm and separated by 12.7 mm) were installed. At the back of slat collimators, graded absorbers (lead, tin and copper) were employed to reduce low energy scatters. Phantom studies In the present study, a uniform cylindrical phantom with an elliptical cross section as shown in Fig. 2 was used to mimic the abdomen region of the patient. The lengths of the inner major and minor axes of the phantom were 29.2 cm and 21.6 cm, respectively. The inner height of the phantom was 24.2 cm yielding a total volume of ~12.8 liters. Six spheres filled with 18F were used to mimic the uptake of hypermetabolic lymph nodes in the abdominal region. The spheres were placed approximately 5 cm away from the axis-ofrotation (AOR) and distributed at 12 possible locations. They were positioned at six different heights from the bottom of the phantom and each sphere was separated from the adjacent spheres by ~2 cm in height or about 4 image slices. The phantom design allowed six lesionpresent and six lesion-absent images to be obtained from a single scan of the phantom. To obtain 12 possible sphere-location images, two scans of the phantom with the six spheres placed at two different sets of locations were acquired. The radioactivity concentration in the phantom was ~0.2 mCi/ml which gave the peak NEC (700 cps at 30% photopeak-to- photopeak (p-p) and ~650 cps at 20% p-p energy window widths) and busytime at ~60% at the beginning of the experiment. Two hot sphere sizes, 0.8-cm and 1-cm, were selected in the present study because they represented the smallest lesion sizes that can be detected using a hybrid PET system. From the pilot human observer study, the sphere-to-background contrasts of an 8-mm lesion and 10-mm lesion were ~14:1 and ~8:1, respectively, to give
J Med Assoc Thai Vol. 88 No.1 2005
Fig. 1
Siemens E.CAM+ Hybrid PET System
(A)
(B) Fig. 2
(A) The uniform cylindrical phantom consists of small spheres placed at 12 possible locations. (B) The design to place six spheres at different locations and heights so that six lesion-present and six lesionabsent were obtained from a single scan
97
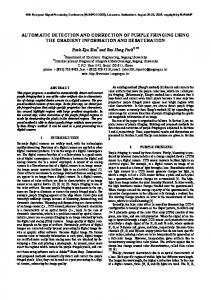
~75% accuracy in detecting the lesions in the reconstructed images. Optimal energy window setting From the authors’ previous study(4), the optimal energy window setting to maximize lesion detectability for a hybrid PET system was determined. Transaxial reconstructed images without attenuation correction at different energy window settings were evaluated. The results from the human observer study and LROC analysis showed that the 30% p-p energy window width provides the highest lesion detectability for the 0.8-cm lesion with ~14:1 lesion to background activity concentration ratio. For a 1-cm lesion with ~8:1 lesion to background activity concentration ratio, the optimal p-p coincidence energy window was found to lie between 15% and 20%. An additional photopeakto-Compton coincidence energy window did not improve lesion detectability for the Siemens E.CAM+ hybrid PET system. Therefore, the authors applied those results to the present study. Data acquisition and image processing List-mode coincidence data of the phantom were acquired (60 steps over 360o). The data within 45o transverse and 7.5o axial acceptance angles were included. The list-mode data were regrouped into 128x128x64 projection datasets (4.8-mm pixel size) with peak-to-peak energy window settings at 30% and 20% for the 0.8- and 1-cm diameter lesion, respectively. They were then rebinned using the single slice rebinning method and each binned projection datasets consisted of ~4 million counts. Attenuation Correction (AC) At the time of the present study, attenuation correction technique was not available on a Siemens hybrid PET system. In the present study, the authors used a simulated attenuation map of the phantom which was generated from a simulated phantom which had exactly the same dimensions and attenuation characteristics as the experimental phantom. The authors assumed a uniform attenuation map with a linear attenuation coefficient (m) of 0.072 cm-1. The emission projection data were corrected for attenuation using this attenuation map. The attenuation corrected projection data were reconstructed using 5 iterations of OS-EM with 8 angles/subset. The transaxial reconstructed images were postfiltered using a 3D Butter-worth filter with order 5 and 0.52 cycles/cm cutoff frequency. Fig. 3 shows the images with and without attenuation correction.
98
Fig. 3
The image of 1-cm lesion of (A) without attenuation correction and (B) with attenuation correction
Human observer study and LROC analysis To evaluate lesion detectability, a human observer study and LROC were used. For each lesion size, ninety-six (48 lesion-present and 48 lesion-absent) images without attenuation correction (w/o AC) and ninety-six images with attenuation correction (w/ AC) were generated and used as test datasets. A lesion present image contained only one lesion at one of the 12 possible locations. Observer studies using eight observers were separately conducted for two lesion sizes. Eight observers, six graduated students who majored in medical imaging and two nuclear medicine physicians, participated in the study. At the beginning of the observer studies, the observers were trained to use separate training datasets. The tasks of the observers were to indicate the location where the spherical lesion was most likely located and to rate the confidence from a continuous scale from 1 to 5 as shown in Fig. 4. In the observer’s task to localize a lesion, a correct response was scored when the observer placed the cursor within a given distance (~1.2 cm) from the center of the lesion(5,6). From an individual observer’s scoring of the test images and indication of lesion location, a fitted LROC curve was generated using the LROCFITC program developed by Swensson (7) . The area under the LROC curve (ALROC) was used as the detectability index. Statistical analysis The ALROC values derived from with and without attenuation correction images were compared. The null hypothesis is that there is no difference in the average ALROC across observers between with and without AC. Moreover, the authors assumed that there was no case-sample variation or within-observer variation and only the variation between observers was used. In this case, the paired t-test for paired data was performed(8). First, the difference between the two ALROC values from with and without AC for each J Med Assoc Thai Vol. 88 No.1 2005
For the 1-cm lesion, the results are similar to that of the 0.8-cm lesions. Table 2 shows that without AC the ALROC is higher than that of with AC. As shown in Fig. 6, the lesion detectability without AC is superior to with AC at all possible confidence thresholds. However, the difference in lesion detectability with and without AC of 1-cm lesion is not statistically significant (P-value = 0.7). Fig. 7 shows the variations of the differences from the mean in lesion detectability between with and without AC for both lesion sizes. The error bars show the range of + 2.33 SE (2.33 is the critical value of a t-distribution at the 95% confidence interval for seven degrees of freedom). Discussion Several studies have shown that hybrid PET is a useful alternative for tumor detection when dedicated PET system is not available(9,10). The tumor detectability of F-18 FDG using hybrid PET is compaFig. 4
Image display format used in the training session in the observer study. The instruction and study information are shown on the upper right, the test image is on the lower left, the rating scale is on the lower right and the corresponding low-noise image with indication of the true lesion location is on the upper left. The cross-hair “+” represents the lesion location selected by a reader and the “x” represents the true lesion location
observer was calculated. Those differences were averaged over eight observers and the standard deviation among observers’ was computed. Then, a twotailed t-test for paired data with 95% confidence interval was used to test for statistical significant difference of the mean.
Table 1. Estimated ALROC from individual observers in detecting 0.8-cm lesion. The data were obtained from with (w/) and without (w/o) attenuation corrections (AC) Observer Number
0.8-cm Lesion ALROC (w/o AC)
ALROC (w/ AC)
Difference in ALROC
1 2 3 4 5 6 7 8
0.6114 0.654 0.6559 0.6583 0.5988 0.6328 0.7414 0.7026
0.5827 0.5624 0.6706 0.5604 0.6894 0.5951 0.6436 0.6158
0.0287 0.0916 -0.0147 0.0979 -0.0906 0.0377 0.0978 0.0868
Average
0.6569
0.6150
0.0419
Results For the 0.8-cm lesion size, the ALROC and standard error (SE) in lesion detection for each observer obtained from with and without AC are reported in Table 1. It shows that the average ALROC without AC over the eight observers is higher than that of with AC. Table 1 also lists the differences between pairs of ALROC from with and without AC for each observer. Fig. 5 shows the average LROC curves of with and without AC. The curves do not cross each other. It implies that without AC gives higher lesion detectability than that with AC at all possible confidence thresholds. The result from a two-tailed t-test shows that the difference in lesion detectability from with and without AC is not statistically significant difference (P-value = 0.12).
J Med Assoc Thai Vol. 88 No.1 2005
Table 2. Estimated ALROC from individual observers in detecting 1-cm lesion. The data were obtained from with (w/) and without (w/o) attenuation corrections (AC) Observer Number
1-cm Lesion ALROC (w/o AC)
ALROC (w/ AC)
Difference in ALROC
1 2 3 4 5 6 7 8
0.6609 0.6734 0.6541 0.6789 0.6698 0.7572 0.8027 0.5903
0.6325 0.7071 0.6509 0.6403 0.5610 0.5961 0.6639 0.6013
0.0284 -0.0337 0.0032 0.0386 0.1088 0.1611 0.1388 -0.0110
Average
0.6859
0.6316
0.054275
99
Fig. 5
The average (over all 8 observers) LROC curves between with (w/) and without (w/o) attenuation correction for the 0.8-cm lesion
Fig. 6
The average (over all 8 observers) LROC curves between with (w/) and without (w/o) attenuation correction (AC) for the 1-cm lesion
Fig. 7
100
Average differences (D ave) in detecting the 0.8-cm and the 1-cm lesions. The error bars show the variations of the differences of the A LROC from the mean within the 95% confidence interval of the tdistribution for seven degrees of freedom (+ 2.33 SE)
rable to that of a full-ring PET system for lesions > 1.5 cm in diameter(11-13). Attenuation correction has been used for improving tumor detectability, especially, in thoracic and abdominal regions. Zimny et al(14) reported that the use of AC increased detection rate of lesions < 2 cm for hybrid PET system whereas the lesion detectability of w/AC and w/o AC was almost similar for lesion > 20 mm. Stevens et al(15) found that the data obtained from F-18 FDG imaging with hybrid PET were useful in the detection of non–small cell lung cancer and less suitable for staging of lymph node involvement, with accuracy comparable to that of CT. Attenuation correction gave more information about anatomic location, but the analysis of the non attenuated data and the attenuated images did not differ. Delbeke et al(16) also found that lesion detectability with AC for hybrid PET system did not increase but improved the visualization of anatomical landmarks. In the present study, the authors investigated the effect of AC on small lesion detectbility (< 1 cm in diameter) of a Siemens E.CAM+ hybrid PET system and the results showed that although the use of AC improves image quality with reduction of the hot rim artifacts (as shown in Fig. 2), there was no significant difference in lesion detection between images obtained w/AC and w/o AC. Actually, observers prefer images without AC for better lesion detection because AC not only increases lesion count but also amplifies noise. Moreover, lesion size may be close to the size of the noise blob resulting in difficulty in lesion detection. Although the results of the present study indicate that AC does not improve small lesion detection (< 1-cm diameter), attenuation correction is still useful due to several reasons. Without AC, the shape of the lesion in the reconstructed image is distorted making it difficult to localize. There is a hot rim artifact in the reconstructed images without AC. Also, AC provides quantitatively accurate images. As a result, the use of AC may be desirable for small lesion detection. In conclusion, for a phantom with hot lesions embedded in a uniform background, AC improves image quality and minimises hot rim artifacts but decreases lesion detectability as compared to without AC using a hybrid PET system for small lesion sizes. Acknowledgments The authors wish to thank the staff of the Division of Nuclear Medicine, Department of Radiology, UNC Hospital, the University of North Carolina at Chapel Hill for their technical supports. The authors also wish to thank the observers for their time and supports.
J Med Assoc Thai Vol. 88 No.1 2005
References 1. Budinger TF. PET instrumentation: what are the limits? Sem Nucl Med 1998; 28: 247-67. 2. Tocharoenchai C, Tsui BMW, Lalush DS et al. Factors affecting spatial resolution of a hybrid PET system [abstract]. J Nucl Med 2000; 41(Suppl): 194. 3. Farquhar TH, Llacer J, Sayre J, et al. ROC and LROC analyses of the effects of lesion contrast, size and signal-to-noise ratio on detectability in PET images. J Nucl Med 2000; 41: 745-54. 4. Tocharoenchai C. Optimum energy window setting for a hybrid PET system using an LROC study. Ph.D. dissertation. The University of North Carolina at Chapel Hill, 2001. 5. Gifford HC, Wells RG, King MA. A comparison of human observer LROC and numerical observer ROC for tumor detection in SPECT images. IEEE Trans Nucl Sci 1999; 46: 1032-7. 6. Wells RG, Simkin PH, Judy PF, et al. Maximizing the detection and localization of Ga-67 tumors in thoracic SPECT MLEM (OSEM) reconstructions. IEEE Trans Nucl Sci 1999; 46: 1191-8. 7. Swensson RG. Unified measurement of observer performance in detecting and localizing target objects on images. Med Phys 1996; 23: 1709-25. 8. Metz CE. Some practical issues of experimental design and data analysis in radiological ROC studies. Invest Radiol 1989; 24: 234-45. 9. Even-SapirE, Lerman H, Figer A, et al. Role of 18FFDG dual-head gamma-camera coincidence imaging in recurrent or metastatic colorectal carcinoma. J Nucl Med 2002; 43: 603-9. 10. Gerbaudo VH, Sugarbaker DJ, Britz-Cunningham S,
J Med Assoc Thai Vol. 88 No.1 2005
11.
12.
13.
14.
15.
16.
et al. Assessment of malignant pleural mesothelioma with 18f-fdg dual-head gamma-camera coincidence imaging: comparison with histopathology. J Nucl Med 2002; 43: 1144-9. Shreve PD, Steventon RS, Deters EC, et al. Oncologic diagnosis with 2-[fluorine-18] fluoro-2-deoxy-D-glucose imaging: dual-head coincidence gamma camera versus positron emission tomographic scanner. Radiology 1998; 207: 431-7. Boren EL Jr, Delbeke D, Patton JA, et al. Comparison of FDG PET and positron coincidence detection imaging using a dual-head gamma camera with 5/8-inch NaI (Tl) crystals in patients with suspected body malignancies. Eur J Nucl Med 1999; 26: 379-87. Tatsumi M, Kitayama H, Sugahara H, et al. Wholebody hybrid pet with 18f-fdg in the staging of nonhodgkin’s lymphoma. J Nucl Med 2001; 42: 601-8. Zimny M, Kaiser HJ, Cremerius U, et al. Dual-head gamma camera 2-[fluorine-18]-fluoro-2-deoxy-D-glucose positron emission tomography in oncological patients: effects of non-uniform attenuation correction on lesion detection. EurJ Nucl Med 1999; 26: 818-23. Stevens H, Bakker PFA, Schlo sser NJJ, et al. Use of a dual-head coincidence camera and18F-FDG for detection and nodal staging of non-small cell lung cancer: Accuracy as determined by 2 independent observers. J Nucl Med 2003; 44: 336-40. Delbeke D, Martin WH, Patton JA, et al. Value of iterative reconstruction, attenuation correction, and image fusion in the interpretation of FDG PET images with an integrated dual-head coincidence camera and x ray-based attenuation maps. Radiology 2001; 218: 163-71.
101
ผลกระทบของการแก้ไขค่า attenuation ในการตรวจหารอยโรคด้วยเครือ่ ง hybrid PET จิราภรณ์ โตเจริญชัย, Benjamin MW Tsui, Eric C Frey, Wen-Tung Wang วัตถุประสงค์: การศึกษานี้มีวัตถุประสงค์คือเพื่อศึกษาดูผลกระทบของการแก้ไขค่า attenuation ในการตรวจหา รอยโรคด้วยเครือ่ ง hybrid PET วัสดุและวิธีการ: ทำการเก็บข้อมูลแบบ list mode ของหุ่นจำลองรูปทรงกระบอกซึ่งมีเส้นผ่าศูนย์กลางเป็นวงรี และภายในมีวัตถุทรงกลม (จำลองรอยโรค) ที่มีขนาดเส้นผ่าศูนย์กลาง 0.8 และ 1.0 ซม. โดยบรรจุสารกัมมันตรังสี F-18 ที่จำลองให้เหมือนการตรวจในคลินิกด้วยอัตราส่วนระหว่างรอยโรคและบริเวณใกล้เคียงเป็น 14:1 และ 8:1 ตามลำดับ นำเอาข้อมูลของวัตถุทรงกลมแต่ละขนาดที่ได้มาทำเป็น sinogram โดยใช้หน้าต่างพลังงาน 30% peakto-peak สำหรับวัตถุทรงกลมขนาด 1.0 ซม.และใช้ 20% peak-to-peak สำหรับวัตถุทรงกลมขนาด 0.8 ซม. ด้วยวิธี single slice rebinning ข้อมูล sinogram แต่ละชุดจะถูกนำมาสร้างภาพตัดขวางโดยมีทง้ั แก้ไขและไม่แก้ไขค่า attenuation ด้วย OS-EM อัลกอลิธมึ ทีใ่ ช้ 5 iterations และ 8 angles/subset หลังจากนัน้ ใช้ Butterworth filter ที่ n = 5 and fc = 0.52 cycles/cm ภาพตัดขวางทั้งแก้ไขและไม่แก้ไขค่า attenuation ถูกนำมาประเมินเพื่อหาว่าคุณภาพของ ภาพใดให้การตรวจหารอยโรคได้ดีกว่าโดยใช้ human observer performance study and localization receiver operating characteristic (LROC) ทำการคำนวณหาค่าเฉลีย่ ของพืน้ ทีใ่ ต้กราฟ LROC ทีไ่ ด้จากผูอ้ า่ น 8 ท่าน โดยมี สมมติฐานศูนย์คอื ไม่มคี วามแตกต่างในคุณภาพของภาพทัง้ แก้ไขและไม่แก้ไขค่า attenuation โดยใช้ two-tailed t-test ด้วยความเชือ่ มัน่ 95% ผลการศึกษา: ผลการศึกษาแสดงให้เห็นว่าสำหรับรอยโรคขนาด 0.8 ซม. ที่มีอัตราส่วนระหว่างรอยโรคและบริเวณ ใกล้เคียงเป็น 14:1 ค่าเฉลีย่ ของพืน้ ทีใ่ ต้กราฟ LROC ของภาพตัดขวางทีไ่ ม่แก้ไขค่า attenuation 0.66 ลดลงเป็น 0.62 เมือ่ แก้ไขค่า attenuation และสำหรับรอยโรคขนาด 1.0 ซม. ทีม่ อี ตั ราส่วนระหว่างรอยโรคและบริเวณใกล้เคียงเป็น 8:1 ค่าเฉลีย่ ของพืน้ ทีใ่ ต้กราฟ LROC ของภาพตัดขวางทีไ่ ม่แก้ไขค่า attenuation 0.69 ลดลงเป็น 0.63 เมือ่ แก้ไขค่า attenuation และคุณภาพของภาพทัง้ แก้ไขและไม่แก้ไขค่า attenuation ไม่มคี วามแตกต่างกันอย่างมีนยั สำคัญทางสถิติ p > 0.05 สรุป: สำหรับการศึกษาด้วยหุน่ จำลองรูปทรงกระบอกซึง่ มีเส้นผ่าศูนย์กลางเป็นวงรีและภายในมีวตั ถุทรงกลมเพือ่ จำลอง รอยโรค พบว่าการแก้ไขค่า attenuation ลดประสิทธิภาพในการตรวจหารอยโรคทีม่ ขี นาดเล็กด้วยเครือ่ ง hybrid PET
102
J Med Assoc Thai Vol. 88 No.1 2005