Ahmed I. Abdel-Aziz et al.: Effect of Friction Stir Processing Parameters on Mechanical Properties and […]
Effect of Friction Stir Processing Parameters on Mechanical Properties and Microstructural Evolution for Al-11.4Si-4Cu-0.5Fe Ahmed I. Abdel-Aziz, Ahmed S.A. AbouTaleb, Ahmed I.Z. Farahat, Z.M. El-Baradie
The purpose of this paper is to optimize the process parameter to get the better mechanical properties of friction stir process (FSP) for A384 Al alloy. A384 aluminum alloy was cast using conventional stir casting process, the experiments have been conducted using vertical milling machine. The mechanical properties were evaluated by using tensile test. A three-factor, three-level central composite design (CCD) was used and a response surface methodology (RSM) with three parameters, three levels and 20 runs, was used to develop the relationship between the FSP parameters (rotational speed, traverse speed and cooling rate). The mechanical properties, such as proof strength (PS), ultimate tensile strength (UTS) and elongation percentage (El%), are considered as responses. Method of analysis of
variance (ANOVA) was used to determine the important process parameters that affect the responses. The results indicate that after friction stir process of A384 Al alloy, the optimum mechanical properties obtained from the response surface model are predicted by using a rotational speed of 1200 rpm, travel speed of 80 mm/min and liquid nitrogen (cooling rate 200 °C/min). Also, the rotaional speed is the first dominant parameter affecting mechanical properties, while the second dominant parameter is the cooling rate. Keywords: A384 aluminum alloy – Friction stir process – Response surface methodology – Mechanical properties
Die Auswirkungen der Parameter des Reibschweißverfahrens auf die mechanischen Eigenschaften und die mikrostrukturelle Entwicklung von Al-11.4Si-4Cu-0.5Fe Ziel dieser Abhandlung ist die Optimierung der Prozessparameter, um so bessere mechanische Eigenschaften beim Einsatz des Reibschweißverfahrens (Friction Stir Process – FSP) für die Aluminiumlegierung A384 zu erzielen. Die Aluminiumlegierung A384 wurde unter Verwendung des konventionellen Rührprozesses gegossen, für die Probenvorbereitung wurde eine Vertikalfräse verwendet. Die mechanischen Eigenschaften wurden mithilfe von Zugversuchen bestimmt. Zur Bestimmung der Verhältnisse zwischen den Reibschweiß-Parametern (Umdrehungszahl, Vorschubgeschwindigkeit und Abkühlgeschwindigkeit) wurde ein Central Composite Design (CCD) mit drei Faktoren und drei Stufen sowie die Antwortflächenmethode (Response Surface Methodology – RSM) mit drei Parametern, drei Stufen und 20 Durchgängen verwendet. Die mechanischen Eigenschaften wie Umformfestigkeit,
Reißfestigkeit und prozentuale Bruchdehnung werden als Antworten gewertet. Zur Bestimmung der einflussreichsten Prozessparameter wurde die Varianzanalyse (ANOVA) herangezogen. Die Ergebnisse zeigen, dass nach dem Reibschweißen der Aluminiumlegierung A384 die optimalen mechanischen Eigenschaften bei einer Umdrehungszahl von 1200 U/min, einer Vorschubgeschwindigkeit von 80 mm/min und Flüssigstickstoff (Abkühlgeschwindigkeit von 200 °C/min) vorhergesagt werden. Dabei ist die Umdrehungszahl der erste dominante Parameter, der die mechanischen Eigenschaften beeinflusst. Der zweite dominante Parameter ist die Abkühlgeschwindigkeit. Schlüsselwörter: Aluminiumlegierung A384 – Reibschweißen – Antwortflächenmethode – Mechanische Eigenschaften
Effet des paramètres du procédé de friction-agitation sur les propriétés mécaniques et l’évolution microstructurelle pour Al-11.4Si-4Cu-0.5Fe El efecto de los parámetros del proceso de fricción por agitación sobre las propiedades mecánicas y la evolución microestructural por Al-11.4Si-4Cu-0.5Fe This is a peer-reviewed article.
1 Introduction It is well known that aluminum alloys are realistic candidates for various structural applications in marine, automobile and aerospace industries due to their high strength to weight ratio, low weight density and high corrosion resisWorld of Metallurgy – ERZMETALL 71 (2018) No. 5
tance [1]. Metal working techniques that enhance localized mechanical properties of a material is getting much importance nowadays due to specific application requirements. Localized microstructural modification and mechanical property enhancement techniques that do not alter the properties of other regions in a material are the most im263
Ahmed I. Abdel-Aziz et al.: Effect of Friction Stir Processing Parameters on Mechanical Properties and […] portant among these metal working operations. Friction stir processing (FSPing) is emerging as one of the most competent severe plastic deformation (SPD) technique introduced by Mishra et al. [2]. The process is derived from basic principles of friction stir welding (FSW), a solid state metal joining technique developed at TWI (The Welding Institute) in 1991. FSP has been successfully applied to the aerospace, automobile, shipbuilding industries etc. In FSP, a non-consumable rotating tool with a specially designed pin and shoulder is plunged in to the monolithic plate and traversed in the defined direction to cover up the desired area of interest. Friction between tool and workpiece results in localized heating that softens the workpiece material. During this process, material undergoes intense plastic deformation which results in significant grain refinement. Though, FSP is basically advanced as a grain refinement technique for microstructural and surface properties improvement and removing various defects in cast products [3]. FSP parameters such as tool rotational speed, travel speed, tool tilt angle, the tool geometry, number of passes, axial force and cooling rate which play a significant role in uniform distribution of grain refinement and heat generation during FSP [4]. If the process parameters are not optimum, then a defect in the form of a through hole is observed in friction stir processed materials, and this defect is commonly referred to as wormhole defect. Though few other defects are also observed in FSP, significance of those defects are lesser compared to the wormhole defect [5]. It is well known that, the main challenge for the manufacturer is selecting the process parameters that would produce excellent FSP mechanical properties. Hence optimizing the process parameters before performing any detailed microstructural study is an important aspect to be followed in FSP. Since the FSP has a complex and too many parameters contributed in the process, development of an appropriate model which can predict the process‘s main characteristics is really complex. Most of the optimization work on FSP has been done using computational and analytical methods or a combination of both experimental and numerical methods, such as Taguchi technique [6, 7]. In the case of development of empirical models, the RSM has been extensively utilized to correlate relationships between FSP process inputs and its main responses. Montgomery [8] defines response surface methodology (RSM), as a collection of mathematical and statistical techniques that explores the relationships between several explanatory variables and one or more response variables. It is useful for analyzing problems in which several independent variables influence a dependent variables or response, and the goal is to optimize the response variable. RSM is a sequential procedure. It is used to determine the optimum operating conditions for the system, or to determine a region of the factor space in which the operating specifications are satisfied. Rajakumar et al. [9, 10] utilized the RSM to predict tensile strength, hardness, and corrosion rate of friction stir welded AA6061-T6 joint and AA 7075 Al alloy. R. Kadaganchi et al. [11] employed four-factor, five-level central composite design and RSM to develop the regression models to predict the mechanical properties. F. Sarsil264
maz & U. Çaydaş [12] applied the full factorial experimental design to study the effects of friction stir welding (FSW) parameters on mechanical properties of AA1050/AA 5083 alloy. Analysis of variance (ANOVA) and main effect plot are used to determine the significant parameters and set the optimal level for each parameter. Linear regression equation is derived to predict each output characteristic. G. Elatharasan & V.S. Kumar [13] developed central composite design technique and mathematical model by RSM with three parameters, three levels and 20 runs, to develop the relationship between the FSW parameters and the mechanical properties were established. ANOVA analysis showed that the developed model can be effectively used to predict response at 95 % confidence level. Elangovan & Balasubramanian [14] used RSM to develop a mathematical model for prediction of tensile strength of friction stir welded joints of AA6061 alloy. Optimizing the process parameters for a defect free process is one of the challenging aspects of FSP to mark its commercial use.
Accordingly, the present work consists of experimental investigation, modeling, and optimization approaches in order to reach best mechanical properties of friction stir process. Therefore, in this paper employ RSM to develop empirical relationships relating the FSP input parameters (rotational speed (R), travel speed (T), cooling rate (C)) and the three output responses (ultimate tensile strength (UTS), proof strength (PS) and elongation percentage (El%)) of A384 aluminum alloy to find the optimal operating parameters.
2
Experimental work
2.1 Casting A384 aluminum alloy was cast using conventional stir casting process. Melting and alloying operations were carried out at 720 °C in silicon carbide crucible by resistance electric furnace under argon as a protective atmosphere. After that, the metal was stirred using mechanical stirrer, kept for 10 min at 720 °C to ensure that all the required alloying elements were dissolved in the melt. The molten metal was skimmed periodically and then cast into ductile cast iron mold (240 mm × 200 mm × 20 mm) which was preheated to 250 °C. The chemical composition is listed in Table 1. Table 1: Chemical composition of as-cast A384 aluminum alloy [wt.-%] Si
Cu
Fe
Mn
Mg
Ni
Zn
Ti
Al
11.4
4.11
0.50
0.146
0.121
0.08
0.428
0.06
rest
2.2
Friction stir process
For FSP, the sheets having dimensions of 200 mm × 40 mm × 6 mm were sectioned from the cast plates using wire cutting machine. Vertical milling machine was used to conduct this process with fixed load. Tool of FSP was made from hardened H-13 tool steel (52HRC) with cylindrical pin profile with flat surface. The shoulder has 18 mm diameter, coupled with a zero tilt angle was used to severely reduce the amount of material flow at the shoulder region. The pin diameter and length are 4 mm and 5 mm, respectively. Pin and shoulder were plunged into a sheet of Al-Si World of Metallurgy – ERZMETALL 71 (2018) No. 5
Ahmed I. Abdel-Aziz et al.: Effect of Friction Stir Processing Parameters on Mechanical Properties and […] during rotating, until the shoulder comes in contact with the top surface of the sheet. The tool was then traversed along linear path. Multi passes with 100 % overlap were performed. Multi pass was applied in order to introduce homogeneous deformation into the processed zone during FSP and achieve finer and homogeneously distributed Si particles and other phases [15, 16]. The pin was rotated clockwise in the first pass and counter clockwise in the return pass. Three cooling media were used separately, water, gel and liquid nitrogen. A steel box filled with cooling media was used in contact with the lower surface of the specimen (backward). Those three cooling media were selected to cool Al-Si samples during the friction stir process (in process cooling) because they have high heat absorption capacity. Samples from cast and FSP were prepared for microstructure characterization. The specimens were ground and polished according to the standard metallographic techniques. After that, the samples were etched with Keller etchant solution (190 ml H2O, 5 ml HNO3, 3 ml HCl and 2 ml HF) for optical microscope (OM) examination. Image analysis was used, also, to calculate the particles size. X-Ray diffraction was employed for the identification of the constituent phases in the as-cast alloy using CuKα target. The tensile specimens were cross sectioned parallel to the process direction (FSP) with dimensions of 60 mm length × 6 mm width × 2 mm thickness. These specimens were machined using wire cutting machine. The tensile test was conducted by an INSTRON universal testing machine having a capacity of 20 kN and cross head speed was 0.5 mm/min. Tests were carried out at room temperature. 2.3
Mathematical model using Experimental Design Technique
The mathematical modeling of this study is conducted with 20 experiments and three levels as shown in the design-matrix of different runs as well as the levels of each parameter are demonstrated in Table 2. The response surfaces for the experimental results of Friction Stir Process for Al-Si are ultimate tensile strength (UTS), proof strength (PS), and elongation percentage (El%). The developed mathematical model is used to predict empirical formulae useful for predicting all output properties (UTS, PS, and El%) of the FSP. Mathematical model will also indicate the dominant parameter (rotational speed (R), travel speed (T) or cooling rate (C) as designed in Table 2) during friction stir process which affects the final responses (UTS, PS and El%). The limits of the working parameters are demonstrated in Table 3. The data generated from the experimentation are given in Table 4 is used to develop the mathematical model by regression analysis to estimate quadratic and two way interaction effects of the input process parameters on the mechanical properties. For all 20 experiments, about 5 kN load of milling machine was used, the combination between variable according to Table 2. Table 3 lists the FSP parameters and levels for experimental design using central composite design. The rotational speed of the tool ranged from 800 to 1200 rpm, the travWorld of Metallurgy – ERZMETALL 71 (2018) No. 5
Table 2: Central composite design with the three levels and three variables Run no.
Working parameter levels Rotational speed (R) Travel speed (T) Cooling Rate (C) [rpm] [mm/min] [°C/min]
1
–1
0
0
2
0
0
1
3
1
–1
1
4
0
0
0
5
0
–1
0
6
–1
1
1
7
0
0
0
8
1
1
1
9
1
1
–1
10
–1
–1
–1
11
0
0
0
12
–1
1
–1
13
0
0
0
14
0
1
0
15
0
0
0
16
1
0
0
17
1
–1
–1
18
–1
–1
1
19
0
0
0
20
0
0
–1
Table 3: Parameters and levels for experimental design using central composite design method Parameters
–1
0
1
Rotation speed (R) [rpm]
800
1000
Travel speed (T) [mm/min]
40
60
1200 80
Cooling rate (C) [°C/min]
100
150
200
el speed ranged from 40 to 80 mm/min and cooling rate ranged from 100 to 200 °C/min (100 °C/min for water cooling, 140 °C/min for gel cooling and 200 °C/min for liquid nitrogen). Representing the response Y, (UTS, PS and El%), the response is a function of rotational speed (R), travel speed (T) and cooling rate (C) and it can be expressed as Y = f (R, T, C) The second order polynomial (regression) equation used to represent the response surface is given by [17] Y = b0 + Σ(bixi) + Σ(biix2i) + Σ(bijxixj) (1) and for three parameters, the selected polynomial equation could be expressed as Y = b0 + b1R + b2T + b3C + b11R2 + b22T2 + b33C2 + b12RT + b13RC + b23TC + ε (2) where Y is the estimate of the response variable (UTS, PS and El%) and xi’s are the independent variables (rotational speed, travel speed and cooling rate) that are known for each experimental. The parameters b0, bi and bij are the regression parameters. Software package, Design-Expert 6.1, Stat-Ease, Inc., Minneapolis, USA, was used for regression analysis of ex265
Ahmed I. Abdel-Aziz et al.: Effect of Friction Stir Processing Parameters on Mechanical Properties and […] perimental data and to plot response surface. Analysis of variance (ANOVA) was used to estimate the statistical Table 4: Mean values of output responses according to design conditions in Table 2 Std
Run Parameters
Responses
Rotation Travel Cooling speed (R) speed (T) rate (C) [rpm] [mm/min] [°C/min]
UTS [MPa]
PS El [MPa] [%]
9
1
800
60
150
247
138
4
14
2
1000
60
200
325
173
6.4
6
3
1200
40
200
330
175
7
20
4
1000
60
150
278
161
5.3
11
5
1000
40
150
255
145
4.2
7
6
800
80
200
270
160
5.3
17
7
1000
60
150
280
163
5.4
8
8
1200
80
200
360
180
8
4
9
1200
80
100
303
168
5.8
1
10
800
40
100
240
137
3.8
15
11
1000
60
150
288
163
5.4
3
12
800
80
100
263
148
4.4
18
13
1000
60
150
272
162
5.3
12
14
1000
80
150
316
171
6.5
16
15
1000
60
150
282
163
5.4
10
16
1200
60
150
311
170
6
2
17
1200
40
100
293
165
4.5
5
18
800
40
200
264
150
4.7
19
19
1000
60
150
275
161
5.3
13
20
1000
60
100
267
155
5
parameters. The extent of fitting the experimental results to the polynomial model equation was expressed by the determination coefficient, R2. F-test was used to estimate the significance of all terms in the polynomial equation with in 95 % confidence interval. The final products (samples of Al-Si after FSP) were characterized using tensile testing at room temperature and optical microstrucure after FSP to determine UTS, PS, El%, silicon particle size (SS) and aspect ratio (AR).
3
Results and discussion
From the regression models, the effects of friction stir process parameters viz. tool rotational speed, travel speed and cooling type on proof strength, ultimate tensile strength, and elongation percentage of friction stir process were evaluated. The three operating parameters considered directly affect generation of frictional heat and cause in plastic flow of material. It is observed that when the combinations of parameters create very low or very high frictional heat and material flow, then lower tensile strength is observed. The friction stir process leads to the clustering of the strengthening precipitates in the region of stir zone. 3.1
Effect of FSP parameters on the mathematical model
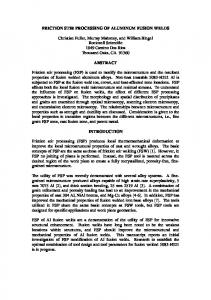
The UTS and PS of as-cast A384 Al-Si are 153 and 100 MPa, respectively. Figure 1 shows the effect of different in process cooling rates on UTS and PS after friction stir process. The arrow started from left to right is demonstrating the severity of cooling rates, where at low in process cooling
Fig. 1: Effects of tool rotation speed and travel speed on UTS, PS and El%; water cooling (a, b, c); gel cooling (d, e, f); liquid N2 cooling (g, h, i)
266
World of Metallurgy – ERZMETALL 71 (2018) No. 5
Ahmed I. Abdel-Aziz et al.: Effect of Friction Stir Processing Parameters on Mechanical Properties and […]
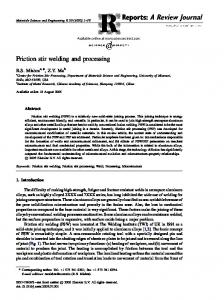
Fig. 2: Optical microstructure of as-cast and FSP samples with different in process cooling rates
rate (water 100 °C/min), the maximum UTS is 303 MPa (98 % increase than as-cast), by increasing the cooling rate (gel 140 °C/min) the maximum UTS increases to be 316 MPa (107 % increase than as-cast). At severe cooling rate (liquid N2 200 °C/min), the maximum UTS reaches 360 MPa (135 % increase than as-cast). Similary PS after FSP enhanced. The increase of UTS and PS is related to the effect of FSP on the microstructural constituents where FSP highly refines the microstructure as shown in Figure 2. On the other hand, maximum El% enhanced than the ascast condition (2 %), where, El% after FSP at in process water cooling showed 5.8 % (three times approximately). For in process gel cooling, maximum El% reached 6.5 % (3.25 times approximately). Finally for in process liquid N2
cooling, maximum El% enhanced to be 8 % (four times than as-cast) as seen in Figure 1. Figure 3 exhibits the silicon size (SS) and aspect ratio (AR) before and after FSP. It emphasizes that the microstructural constituents highly refined due to severe plastic deformation of FSP where the SS of Si changed from 50 µm (cast condition) to approximately 7 µm after FSP (86 % SS reduction). On the other hand, the aspect ratio of Si particles decreased from approximately 30 (cast condition) to 3.5 (88 % AR decrease). From Figure 4 it can be observed that Friction Stir Process modified the microstructure and redistributed the harmful alloying elements such as Fe-rich intermetallic. The X-ray
Fig. 3: Effect of FSP parameters on both Si particle size and aspect ratio
World of Metallurgy – ERZMETALL 71 (2018) No. 5
267
Ahmed I. Abdel-Aziz et al.: Effect of Friction Stir Processing Parameters on Mechanical Properties and […]
Fig. 4: X-ray as-cast and after FSP at optimum conditions at different cooling rate of A384 aluminum alloy
plateau of the as-cast Al-Si shows heterogeneous chemical composition such as Chinese Script Al8Fe2Si which blocks the interdendritic path and prevents liquid flow of the molten metal during solidification. On the other hand, the X-ray plateaus of FSP samples (water, gel, and liquid nitrogen cooling) exhibit homogenous chemical composition and fine microstructure where Chinese Script completely disappeared. Friction stir process partially dissolved Curich phases as seen in gel cooling while in water or liquid N2 cooling, the friction stir process completely dissolved Cu-rich phases. 3.2
Optimization of FSP parameters
All the experimental results (UTS, PS and El%), collected at the 3-D cubic as shown in Figure 5. Figure 5a reveales
that UTS, which ranged from 238 to 363 MPa could be produced. For example, 282 MPa UTS value can be obtained at two different conditions, i.e., at high level of rotational speed and low levels of travel speed and cooling rate and/or high level of travel speed and cooling rate and low levels of rotational speed. On the other hand, the highest UTS, 363 MPa, can be achieved at high levels of cooling rate, travel speed and rotational speed. 3.3
Checking for adequacy of model
The adequacy of the developed model is tested using the analysis of variance (ANOVA) technique and the results of second order response surface model fitting in the form of analysis of variance. ANOVA for ultimate yensile strength, proof strength and elongation percentage are shown in
Fig. 5: Cube graph for UTS, PS and El% in studied region
268
World of Metallurgy – ERZMETALL 71 (2018) No. 5
Ahmed I. Abdel-Aziz et al.: Effect of Friction Stir Processing Parameters on Mechanical Properties and […] Source
Sum of squares
Model
16019.24
DF 9
Mean square
F value
Prob > F
1779.916
12.34589
0.0003
significant
0.0188
significant
Residual
1441.707
10
144.1707
Lack of fit
1284.873
5
256.9747
Pure error
156.8333
5
31.36667
Cor total
17460.95
19
Source
Sum of squares
DF
Model
2414.875
9
Residual
225.925
10
22.5925
Lack of fit
221.0917
5
44.21833
Pure error
4.833333
5
Cor total
2640.8
19
Source
Sum of squares
DF
Model
19.62316
Mean square
F value
Prob > F
268.3194
11.87648
0.0003
significant
45.7431
0.0004
significant
Mean square
F value
Prob > F
24.71098
F for three developed models is less than 0.05 (95 % confidence level), which indicates that the model is significant and lack of fit is significant as desired [8, 18, 19]. 3.4
Table 6: ANOVA for PS (Response Surface Quadratic Model)
0.966667
Residual Pure error
8.192605
Table 5: ANOVA for UTS (Response Surface Quadratic Model)
Residual analysis
A residual plot is a graph that shows the residuals on the vertical axis and the independent variable on the horizontal axis. If the points in a residual plot are randomly dispersed around the horizontal axis, a quadratic regres-
Table 7: ANOVA for El% (Response Surface Quadratic Model)
sion model is appropriate for the data. In versus fit, it is indicated that the points on the residual plot appear to be randomly scattered around zero. The vertical width of the scatter does not appear to increase or decrease across the fitted values, it is assumed that the variance in the error term is constant. The normal percentage probability vs. residual plots for proof strength, ultimate tensile strength percentage elongation are shown in Figure 6 which reveals that the residuals are falling on straightline, which means the errors are distributed normally. All the coefficients were estimated and tested by applying “F-test” using trial version of Design-Expert software for their significance at a 95 % confidence level. After deter-
Fig. 6: Normal plots of residuals for the responses
World of Metallurgy – ERZMETALL 71 (2018) No. 5
269
Ahmed I. Abdel-Aziz et al.: Effect of Friction Stir Processing Parameters on Mechanical Properties and […] mining the significant coefficients, the final model was developed to predict the ultimate tensile strength (UTS) Eq. (3), proof strength (PS) Eq. (4) and elongation percentage (El%) Eq. (5) of FSP of A384 aluminum alloy as given below (coded equation). UTS = 280.8818 + 31.3·R + 13·T + 18.3·C – 4.45455·R2 + 2.045455·T2 + 12.54545·C2 + 1.375·R·T + 7.875·R·C + 0.375·T·C (3) PS = 160.9 + 12.5·R + 5.5·T + 6.5·C – 5·R2 – 1·T2+5·C2 – 1.625·R·T – 0.375·R·C + 0.125·T·C (4) El% = 5.337273 + 0.91·R + 0.58·T + 0.79·C – 0.31818·R2 + 0.031818·T2 + 0.381818·C2 + 0.1375·R·T + 0.3625·R·C – 0.0375·T·C (5) where R denotes rotational speed, T travel speed and C cooling rate, from above empirical equations, it is noted that the dominant parameter is rotational speed. 3.5
Confirmity experimental tests for the developed models
Experiments are conducted to verify the validity of the developed regression equations. The purpose of the conformity test is to check the level of the process parameters and to test the reliability of the predicted and experimental values. Using different values of the process parameters, three test runs are conducted utilizing the same experimental setup of process parameters. The percentage of error is calculated for the differences in experimental and the predicted outcomes, as shown in equation (6). % Error = ((Av – Pv)/Pv)/100
(6)
where, Av = actual value, Pv = predicted value. Table 8: Predicted, experimental and % error values for response variables for UTS, PS and El%
4 Conclusions In this study, the UTS, PS and El% of Al-Si after FSP were modelled and analyzed using response surface methodology (RSM). A central composite design (CCD) in RSM consisting of three variables, rotational speed (R), travel speed (T) and in process cooling (C) (water, gel and liquid nitrogen) have been adopted to perform the experimental study. Analysis of variance (ANOVA) was conducted to judge the material behavior. The following points can be concluded: • Friction stir process with in process different cooling highly enhanced the tensile strength and elongation for A384 Al alloy. • FSP improved the microstrucure morphology from coarse and needle-like shape to fine shapes such as silicon particles and α-Fe (Chinese script). • Regression equations were developed based on the experimental values of proof strength, ultimate tensile strength and elongation percentage of the friction stir process of A384 aluminum alloy. The developed models can be used to predict the responses within ±12 % of their experimental values at 95 % confidence level. • Based on the regression models the effects of operating parameters on proof strength, ultimate tensile strength
UTS St. Order 1
270
Table 8 presents a comparison between the experimental data, the predicted values and % error depend on the input parameters obtained from Eqs. 1 to 3 using quadratic RSMs. So, the quadratic models are very useful for predicting the ultimate strength, proof strength and elongation percent.
PS
Actual value
Predicted value
240
238.0432
% of errors 0.82
El%
Actual Predicted value value 137
133.525
% of errors 2.60
Actual value
Predicted value
3.8
3.615227
% of errors 5.11
2
293
282.1432
3.85
165
162.525
1.52
4.5
4.435227
1.46
3
263
260.5432
0.94
148
147.525
0.32
4.4
4.575227
–3.83
4
303
310.1432
–2.30
168
170.025
–1.19
5.8
5.945227
–2.44
5
264
258.1432
2.27
150
147.025
2.02
4.7
4.545227
3.41
6
330
333.7432
–1.12
175
174.525
0.27
7
6.815227
2.71
7
270
282.1432
–4.30
160
161.525
–0.94
5.3
5.355227
–1.03
8
360
363.2432
–0.89
180
182.525
–1.38
8
8.175227
–2.14
9
247
245.1273
0.76
138
143.4
–3.77
4
4.109091
–2.65
10
311
307.7273
1.06
170
168.4
0.95
6
5.929091
1.20
11
255
269.9273
–5.53
145
154.4
–6.09
4.2
4.789091
–12.30
12
316
295.9273
6.78
171
165.4
3.39
6.5
5.949091
9.26
13
267
275.1273
–2.95
155
159.4
–2.76
5
4.929091
1.44
14
325
311.7273
4.26
173
172.4
0.35
6.4
6.509091
–1.68
15
288
280.8818
2.53
163
160.9
1.31
5.4
5.337273
1.18
16
282
280.8818
0.40
163
160.9
1.31
5.4
5.337273
1.18
17
280
280.8818
–0.31
163
160.9
1.31
5.4
5.337273
1.18
18
272
280.8818
–3.16
162
160.9
0.68
5.3
5.337273
–0.70
19
275
280.8818
–2.09
161
160.9
0.06
5.3
5.337273
–0.70
20
278
280.8818
–1.03
161
160.9
0.06
5.3
5.337273
–0.70
World of Metallurgy – ERZMETALL 71 (2018) No. 5
Ahmed I. Abdel-Aziz et al.: Effect of Friction Stir Processing Parameters on Mechanical Properties and […]
• •
•
•
and elongation percentage of the friction stir process were presented and interpreted in detail. The rotaional speed is the first dominant parameter affecting mechanical properties. While, the second dominant parameter is cooling rate. The effect of in process cooling prevents grain growth during FSP. The optimum mechanical properties obtained from the response surface model are predicted by using a rotational speed of 1200 rpm, travel speed of 80 mm/min and liquid nitrogen (cooling rate 200 °C/min). UTS, PS and El% of A384 Al alloy after FSP increased with the increase of tool rotational speed, travel speed and in process cooling. A maximum ultimate tensile strength of 360 MPa, proof strength of 180 MPa and elongation% of 8 %.
References [1] Rathee, S. et al. (2016): Process parameters optimization for enhanced microhardness of AA 6061/SiC surface composites fabricated via Friction Stir Processing (FSP). – Mater. Today Proc. 3, 10: 41514156. [2] Mishra, R.S. et al. (1999): High strain rate superplasticity in a friction stir processed 7075 Al alloy. – Scr. Mater. 42, 2: 163-168. [3] Mishra, R.S., Ma, Z.Y. & Charit, I. (2003): Friction stir processing: A novel technique for fabrication of surface composite. – Mater. Sci. Eng. A 341, 1-2: 307-310. [4] Chainarong, S., Muangjunburee, P. & Suthummanon, S. (2014): Friction stir processing of SSM356 aluminium alloy. – Procedia Eng. 97: 732-740. [5] Kim, Y.G. et al. (2006): Three defect types in friction stir welding of aluminum die casting alloy. – Mater. Sci. Eng. A 415, 1-2: 250-254. [6] Lakshminarayanan, A.K. & Balasubramanian, V. (2008): Process parameters optimization for friction stir welding of RDE-40 aluminium alloy using Taguchi technique. – Trans. Nonferrous Met. Soc. China 18: 548-554. [7] Jayaraman, M. et al. (2009): Optimization of process parameters for friction stir welding of cast aluminium alloy A319 by Taguchi method. – J. Sci. Ind. Res. 68, 1: 36-43. [8] Montgomery, D.C. (2002): Design and Analysis of Experiments. – 5th ed., New York; John Wiley and Sons. [9] Rajakumar, S., Muralidharan, C. & Balasubramanian, V. (2011): Predicting tensile strength, hardness and corrosion rate of friction stir welded AA6061-T6 aluminium alloy joints. – Mater. Des. 32, 5: 2878-2890. [10] Rajakumar, S., Muralidharan, C. & Balasubramanian, V. (2010): Optimization of the friction-stir-welding process and tool parameters to attain a maximum tensile strength of AA7075-T6 aluminium alloy. – Proc. Inst. Mech. Eng. Part B J. Eng. Manuf. 224, 8: 1175-1191.
World of Metallurgy – ERZMETALL 71 (2018) No. 5
[11] Kadaganchi, R., Gankidi, M.R. & Gokhale, H. (2015): Optimization of process parameters of aluminum alloy AA 2014-T6 friction stir welds by response surface methodology. – Def. Technol. 11, 3: 209-219. [12] SarsIlmaz, F. & Çaydaş, U. (2009): Statistical analysis on mechanical properties of friction-stir-welded AA 1050/AA 5083 couples. – Int. J. Adv. Manuf. Technol. 43, 3-4: 248-255. [13] Elatharasan, G. & Kumar, V.S.S. (2013): An experimental analysis and optimization of process parameter on friction stir welding of AA 6061-T6 aluminum alloy using RSM. – Procedia Eng. 64: 1227-1234. [14] Elangovan, K., Balasubramanian, V. & Babu, S. (2008): Developing an empirical relationship to predict tensile strength of friction stir welded AA2219 aluminum alloy. – J. Mater. Eng. Perform. 17, 6: 820830. [15] El-Rayes, M.M. & El-Danaf, E.A. (2012): The influence of multipass friction stir processing on the microstructural and mechanical properties of Aluminum Alloy 6082. – J. Mater. Process. Technol. 212, 5: 1157-1168. [16] Nakata, K. et al. (2006): Improvement of mechanical properties of aluminum die casting alloy by multi-pass friction stir processing. – Mater. Sci. Eng. A 437, 2: 274-280. [17] Rajakumar, S., Muralidharan, C. & Balasubramanian, V. (2010): Establishing empirical relationships to predict grain size and tensile strength of friction stir welded AA 6061-T6 aluminium alloy joints. – Trans. Nonferrous Met. Soc. China (English Ed.) 20, 10: 1863-1872. [18] Elangovan, K., Balasubramanian, V. & Babu, S. (2009): Predicting tensile strength of friction stir welded AA6061 aluminium alloy joints by a mathematical model. – Mater. Des. 30, 1: 188-193. [19] Sundaram, N.S. & Murugan, N. (2009): Dependence of ultimate tensile strength of friction stir welded AA2024-T6 aluminium alloy on friction stir welding process parameters. – Mechanika 4, 4: 17-25. Ahmed Ibrahim Abdel-Aziz, M.Sc. Faculty of Engineering Fayoum University Fayoum Egypt, ZIP code 63511
[email protected] Dr. Ahmed S.A. Abou Taleb Faculty of Engineering Fayoum University Fayoum Egypt, ZIP code 63511
[email protected] Prof. Dr. Ahmed I.Z. Farahat Department of Plastic Deformation Lab. Central Metallurgical Research and Development Institute (CMRDI) Helwan, Cairo Egypt, ZIP code 11731
[email protected] Prof.em. Dr. El-Zahraa Mohamed Yehia Mohamed El-Baradie Non-Ferrous Lab. Central Metallurgical Research and Development Institute (CMRDI) Helwan, Cairo Egypt, ZIP code 11731
[email protected]
271