Change in Stage III work hardening characteristics with structural quality in A206 ...... [34] E. DeBartolo and B. Hillberry, "A model of initial flaw sizes in aluminum .... [72] A. Simar, "Friction stir processing for arquitectured materials," ed: Not ...
UNF Digital Commons UNF Graduate Theses and Dissertations
Student Scholarship
2018
The Effect of Friction Stir Processing on The Microstructure and Tensile Behavior of Aluminum Alloys Nelson Gomes Affonseca Netto
Suggested Citation Gomes Affonseca Netto, Nelson, "The Effect of Friction Stir Processing on The Microstructure and Tensile Behavior of Aluminum Alloys" (2018). UNF Graduate Theses and Dissertations. 790. https://digitalcommons.unf.edu/etd/790
This Master's Thesis is brought to you for free and open access by the Student Scholarship at UNF Digital Commons. It has been accepted for inclusion in UNF Graduate Theses and Dissertations by an authorized administrator of UNF Digital Commons. For more information, please contact Digital Projects. © 2018 All Rights Reserved
THE EFFECT OF FRICTION STIR PROCESSING ON THE MICROSTRUCTURE AND TENSILE BEHAVIOR OF ALUMINUM ALLOYS by
Nelson Gomes Affonseca Netto
A thesis submitted to the School of Engineering in partial fulfillment of the requirements for the degree of Master of Science in Mechanical Engineering
UNIVERSITY OF NORTH FLORIDA COLLEGE OF COMPUTING, ENGINEERING, AND CONSTRUCTION April 2018 Published work © Nelson Netto
The thesis “The Effect of Friction Stir Processing on the Microstructure and Tensile Behavior of Aluminum Alloys” submitted by Nelson Gomes Affonseca Netto in partial fulfillment of the requirements for the degree of Master of Science in Mechanical Engineering has been Approved by the thesis committee:
Date
Dr. Murat Tiryakioğlu Thesis Advisor and Committee Chairperson
Dr. Paul D. Eason
Dr. Stephen Stagon Accepted for the School of Engineering:
Dr. Murat Tiryakioğlu Director of the School Accepted for the College of Computing, Engineering, and Construction:
Dr. Mark Tumeo Dean of the College Accepted for the University:
Dr. John Kantner Dean of the Graduate School
i
Dedication
…to my beloved Lisa.
ii
Acknowledgments I would first like to thank my thesis advisor, Dr. Murat Tiryakioğlu, for the mentorship and support throughout the course of my M.Sc. degree. His dedication, enthusiasm and hard work on this research consistently motivated me to reach for excellence in every single task. His support, guidance and comments were essential to my thesis and to my life. I would like to extend my thanks to Dr. Paul Eason for his technical support and guidance throughout the course of the experiments. I express my sincere gratitude to Dr. Stephen Stagon for always being willing to help me whenever I had a question and for the invaluable discussions. I would also like to thank all the staff at the School of Engineering for their continued cooperation. It was a pleasure and a priceless experience to live and work at the University of North Florida. I would like to thank my parents, Nelson and Patricia, for everything that they have done for me throughout my life, for the moral and financial support necessary to pursue my goals and dreams. Lastly, to Raissa for listening to my problems and always encouraging me to overcome them, softening the difficult journey until here.
iii
Table of contents Page Dedication ..................................................................................................................................ii Acknowledgments.................................................................................................................... iii Table of contents ....................................................................................................................... iv List of tables .............................................................................................................................. vi List of figures ...........................................................................................................................vii Abstract ...................................................................................................................................... 1 1. Introduction ............................................................................................................................ 3 2.1. Microstructure and defects .................................................................................................. 6 2.1.1 Tensile Deformation ................................................................................................ 10 2.1.2. The effect of Si particle size on tensile properties of cast Al-Si alloys .................. 14 2.1.3. Fracture Surface Characteristics ............................................................................. 15 2.1.3. Structural Quality ................................................................................................... 17 2.2.3. Microstructural zones in FSP ................................................................................. 23 2.2.4. The Effect of Multiple Passes ................................................................................. 25 2.2.5. Characterization of tool wear in FSP ...................................................................... 27 2.3
The Effect of FSP on Casting Defects ...................................................................... 30
3. Analysis of Results from the Literature ............................................................................... 33 3.1. The Effect of process parameters on microstructural evolution in Al-Si alloys ........... 33 3.2. The effect of FSP on tensile properties ......................................................................... 36 4. Research questions ............................................................................................................... 39 5. Experimental details............................................................................................................. 40 5.1. Preliminary investigation .............................................................................................. 40 5.2. Experimental Procedure for Phases I and II .................................................................. 41 6. Results and Discussion of Phase I: FSP of Extruded 6061-T6 ............................................ 44 6.1. Tool life and wear ...................................................................................................... 45 6.2 Characterization of microstructural zones .................................................................. 52 7. Results and Discussion of Phase II: FSP of Cast A356-F ................................................... 57 7.1. Microstructural Evolution of High quality ingot ....................................................... 57 7.2. The combined effect of initial metal quality and FSP on tensile deformation characteristics ................................................................................................................... 64 7.3. The effect of Si particle size on structural quality ..................................................... 73 iv
7.4. Fractography .............................................................................................................. 75 8. Conclusions .......................................................................................................................... 88 9. Future work .......................................................................................................................... 91 References ................................................................................................................................ 92 Appendix A: Preliminary Investigation ................................................................................... 99 Appendix B: Preliminary quantitative analysis of fracture surfaces ..................................... 101
v
List of tables Table 1. Details about the datasets from literature that were reevaluated in this study. .......... 38 Table 2. Chemical compositions for the A356 and 6061 alloys used in this study. ................ 41 Table 3. Constants for tool life and wear for the two phases. .................................................. 45 Table 4. Estimated parameters of the lognormal distributions and the fraction of each distribution in the mixture. ........................................................................................ 56 Table 5. Estimated parameters of the lognormal distributions for deq for the three FSP conditions in this study and the one by Baruch et al. [2]. ......................................... 62 Table 6. Estimated parameter of the lognormal distributions for Lnn for the three FSP conditions in this study. ............................................................................................ 62 Table 7. Experimental Tensile data for as-cast and FSPed specimens for the two types of ingots. ........................................................................................................................ 66 Table 8. Results of Kock-Mecking analysis for all specimens. ............................................... 67 Table 9. Estimated parameters of the lognormal distributions of the voids on six fracture surfaces as well as sample size (n) and estimated population average, dV. ........... 104
vi
List of figures Figure 1. Schematic illustration of friction stir processing (adopted from Ref. [2])............................... 4 Figure 2. Structural defects identified on the fracture surfaces of A356 alloy castings broken in tension [20]. ............................................................................................................................... 6 Figure 3. A bifilm on the fracture surface of an Al–7Si–0.4Mg alloy casting [27]. ............................... 7 Figure 4. Polished surface of Al–7Si–0.4Mg alloy breaking into a bifilm, showing upper part of the double film removed, revealing the inside of the lower film [28]. ............................................ 8 Figure 5. SEM image of a β-platelet in an Al-11.5Si-0.4Mg cast alloy [29]. ...................................... 9 Figure 6. Optical micrographs of the Al-11.6Si-0.37Mg alloy prepared under conditions of heavily agitated to maximize oxide film entrainment. The β-Fe plate in the agitated sample contains a crack-like defect[32]. ................................................................................................................. 9 Figure 7. The effect of area fraction of pores (f) on elongation of A356 castings. The expected defectfree elongation (eF(int)), as well as fits from two different models are also indicated [21]. ...... 10 Figure 8. Stages of work hardening in aluminum alloy specimens without sructural defects [40]. ..... 11 Figure 9. Sudden drop in work hardening rate just before the final fracture, due to structural defects in a A206 alloy cast specimen [42]. ............................................................................................. 12 Figure 10. Change in Stage III work hardening characteristics with structural quality in A206 aluminum alloy castings [42]. .................................................................................................. 12 Figure 11. The change in elongation with Kocks-Mecking parameter, k, in Al–7%Si–Mg castings [43] ................................................................................................................................................. 13 Figure 12. Schematic illustration of the change in work hardening behavior in cast Al alloys with structural quality and ideal behavior in the absence of structural defects [42]. ....................... 13 Figure 13. Expected elongation versus average equivalent diameter of Si particles [50]..................... 15 Figure 14. Structural quality versus average equivalent diameter of Si particles from two studies [51]. In both studies, Si particles were spheroidized by either the addition of modifying elements (Alexopoulos et al.) or solution treatment (Eisaabadi et al.).................................................... 15 Figure 15. Microvoids near a Si particle on the fracture surface of a high quality D357 aluminum alloy aerospace casting [41]. .................................................................................................... 16 Figure 16. Voids on the fracture surface of a high quality A357 aluminum alloy casting. A damaged silicon particles at the center of a void is indicated by the arrow [36]. .................................... 17 Figure 17. Schematic illustration of the use of QT to determine structural quality [67]. ...................... 18 Figure 18. FSP tool geometry and different types of FSP tools [11]. ................................................... 20 Figure 19. The effect of FSP tool tilt angle on the metal flow patterns during FSP (adapted from Ref. [11]). ........................................................................................................................................ 20 Figure 20. Microstructure of an A356 alloy casting (a) before, and (b) after FSP [81]. ....................... 21 Figure 21. Optical micrographs of the stir zone after FSP with various rotation rates: (a) 500, (b) 800, (c) 1000, and (d) 1250 (rpm) [3]. ............................................................................................. 22 Figure 22. Average aspect ratio and size of Si particles and grain size of as-cast and FSPed A356 [3]. ................................................................................................................................................. 22 Figure 23. The change in grain size in A356 cast aluminum alloy with rotational speed during FSP (Data from [3]). ........................................................................................................................ 23 Figure 24. a) The cross-sectional macrostructure of Case 1 (typical FSP) and (b) marked the BM, HAZ, TMAZ, and DXZ of the FSP 6061-T6 Al alloy [87]. ................................................. 24 Figure 25. TEM bright-field images measured 5760 h after the FSP: (a) BM and (b) DXZ (c) HAZ (root) and (d) TMAZ (face) [87] .............................................................................................. 25 Figure 26. Hardness profiles measured along the face and root in Case 1: (a) 168 hours and (b) 5760 hours after FSP [87]. ................................................................................................................ 25
vii
Figure 27. Optical micrographs of the stir zone showing Si particle size after (a) single pass (b) 2 passes and (c) 3 passes[84] ...................................................................................................... 26 Figure 28. Probability density functions of Si particle equivalent diameters after 1, 2 and 3 passes inferred from the results of Baruch et al. ................................................................................. 27 Figure 29. Wear characteristics of a FSW tool with distance welded in 6061+20% Al203 and 6061 [91]. .......................................................................................................................................... 28 Figure 30. Evolution of wear with FSW distance and tranverse speed for 6061+20% Al203 [91]. The point at which wear rate reaches steady state is indicated by arrows. ..................................... 29 Figure 31. The initial and “self-optimized” tool geometry after which there is no wear nor process defect [93]. The associated material flow around the tool is also indicated, where there is a turbulent flow around the threads (a) and a laminar flow after the wear (b). .......................... 29 Figure 32. Hardness profile in and around the weld zone at the start and end of the FSW process, showing the effect of tool wear n the hardness distribution [93]. ............................................ 30 Figure 33. Micrographs of an A319 alloy casting (a) before, and (b) after FSP [96]. .......................... 31 Figure 34. SEM backscatter image of intermetallic particles in A206 (a) in as-cast condition, and (b) after FSP [97]. .......................................................................................................................... 32 Figure 35. The evolution of diameter of Si particles with tool rotational speed, ω for different cast AlSi alloys including A356 [3, 84] A319 [85], A390 [86] FSPed at various transverse speeds. 33 Figure 36. Grain size distribution of A206 and FSPed samples by using data of Kapoor et al. ........... 35 Figure 37. The distribution of lengths of β-platelets before and after FSP in A206 castings. .............. 36 Figure 38. Yield strength – elongation plot for as-cast (no FSP) and FSPed specimens. ..................... 37 Figure 39. Micrographs showing the area below fracture surfaces [98] and their corresponding tensile properties in as-cast and FSPed A356 alloy casting tensile specimens. .................................. 38 Figure 40. FSP process set-up used in the present investigation. ......................................................... 40 Figure 41. Schematically of FSP Tool dimensions used in this study .................................................. 42 Figure 42. The FSP tool used in this study. .......................................................................................... 42 Figure 43. CAD model to machine the tensile specimen in the CNC following ASTM e8/M for subsize specimen (dimensions in mm) .......................................................................................... 43 Figure 44. (a) A SEM micrograph of the microstructure of the aluminum matrix and (b) X-ray map for Fe in the Al matrix. ............................................................................................................ 44 Figure 45. FSP tool diameter described as Taylor equation on Phase I and in a diferent regime after the material depostion, described as Phase II. ......................................................................... 46 Figure 46. FSP tool wear as a function of the FSPed distance (x), showing two distinct phases. ........ 47 Figure 47. SEM micrographs of cross sectioned and polished tool threads profile for: (a) no-FSP (unused tool mounted in epoxy) (b) after 60 seconds of FSP, and (c) after 120 seconds of FSP. ................................................................................................................................................. 49 Figure 48. SEM micrograph of a cross section of FSP tool broken inside the Al matrix. .................... 50 Figure 49. SEM micrograph of the same specimen shown in Figure 48, at higher magnification depeciting the deposition of aluminum between the threads ................................................... 51 Figure 50. Back-scattered SEM micrograph showing the presence of diferent microstructures and part of the tool that was fractured during the FSP process.............................................................. 51 Figure 51. A Vickers microhardness test indentation. .......................................................................... 52 Figure 52. (a) first 10 microhardness indentations, and (b) the last 10 indentations. .......................... 53 Figure 53. Microhardness profile of 6061-T6 extrusion as a function of distance from the tool end. .. 54 Figure 54. DXZ zone showing refine intermetallics particle with the presence of part of the FSP that was fractured during the process.............................................................................................. 55 Figure 55. Microstructure of Al6061-T6 presented in higher magnification, showing the Fe particle and distribution. ....................................................................................................................... 56 Figure 56. Fe particle size and dsitribution for the base material (No-FSP) and DXZ zone (FSP). ..... 56 Figure 57. The as-cast microstructure of the high quality ingot specimen showing the distribution of Si eutectic phase and aluminum dendrites. .............................................................................. 57
viii
Figure 58. (a) Microstructure of cast A356 presented in higher magnification showing the distribution of Si particles in the dendrite arms and (b) The x-ray map obtained for Si in the as-cast specimen. ................................................................................................................................. 58 Figure 59. A rare, large pore in the microstructure. ............................................................................. 59 Figure 60. X-ray maps for Si in the FSP stir zone for (a) 1 pass, (b) 2 passes, and (c) 3 passes. ......... 61 Figure 61. Probability density functions of Si particle equivalent diameters after 1, 2 and 3 passes: (a) in this study, and (b) Baruch et al presented again for comparison. ........................................ 63 Figure 62. Probability density functions of nearest neighbor distance for Si particles in the three FSP microstructures......................................................................................................................... 64 Figure 63. Engineering stress-strain curves for as-cast and FSPed specimens for A356 Aluminum Alloy from the high quality ingot. ........................................................................................... 65 Figure 64. Engineering stress-strain plots for tensile tests done on no-FSPed and multiple passes specimens from the low quality ingot. ..................................................................................... 66 Figure 65. Kocks-Mecking plot for the high quality ingot, no-FSP specimen showing the presence of Stage 3 work hardening. .......................................................................................................... 68 Figure 66. Kocks-Mecking plot for high quality ingot after 1 pass showing the presence of Stage 4 work hardening. ....................................................................................................................... 68 Figure 67. Kocks-Mecking plot for high quality ingot after 2 passes showing the presence of Stage 4 work hardening. ....................................................................................................................... 69 Figure 68. Kocks-Mecking plot for high quality ingot after 3 passes showing the presence of Stage 4 work hardening. ....................................................................................................................... 69 Figure 69. Kocks-Mecking plot of low quality ingot for no-FSP specimen. ........................................ 70 Figure 70. Kocks-Mecking plot for low quality ingot after 1 pass showing the presence of Stage 4 work hardening. ....................................................................................................................... 70 Figure 71. Kocks-Mecking plot for low quality ingot after 2 passes showing the presence of Stage 4 work hardening. ....................................................................................................................... 71 Figure 72. Kocks-Mecking plot for low quality ingot after 3 passes showing the presence of Stage 4 work hardening. ....................................................................................................................... 71 Figure 73. The change in elongation with KM parameter K. ............................................................... 72 Figure 74. The relationship between the two KM parameters for the FSPed specimens..................... 73 Figure 75. The relationship between Si particle size and QT in this study and by Baruch et al........... 74 Figure 76. Overall fractograph of no-FSP A356 specimen from the high quality ingot with an elongation of 10.9%. ................................................................................................................ 76 Figure 77. Fracture surface of no-FSP A356 specimen from the high quality ingot. ........................... 76 Figure 78. Fracture surface of No-FSP specimen from the high quality ingot showing the fracture along the Si-eutectic phase....................................................................................................... 77 Figure 79. Overall fractograph after 1 pass of FSP on A356 sample with elongation of 21.1% .......... 78 Figure 80. Fracture surface of 1 pass of FSP on high quality A356 sample. ........................................ 78 Figure 81. Transition zone in 1 pass of FSP in high quality ingot. ....................................................... 79 Figure 82. Overall fractograph after 2 pass of FSP on high quality A356 sample with elongation of 24%. ......................................................................................................................................... 80 Figure 83. Fracture surface of 2 passes of FSP on high quality A356 sample...................................... 80 Figure 84. Overall fractograph after 3 pass of FSP on high quality A356 sample with elongation of 20.9% ....................................................................................................................................... 81 Figure 85. Fracture surface of 3 passes of FSP on high quality A356 sample...................................... 81 Figure 86. Overall fractograph of no-FSP A356 sample with elongation of 1%. ................................. 83 Figure 87. Fracture surface of no-FSP low quality A356 specimen showing a faceted fracture. ......... 83 Figure 88. Presence of large pores on the fracture surface for low quality no-FSP specimen.............. 84 Figure 89. Overall fractograph after 1 pass of FSP on low quality A356 sample with an elongation of 5.8%. ........................................................................................................................................ 85 Figure 90. Fracture surface of 1 pass of FSP on low quality A356 sample. ......................................... 85
ix
Figure 91. Overall fractograph after 2 passes of FSP on low quality A356 sample with an elongation of 13%. ..................................................................................................................................... 86 Figure 92. Fracture surface of 2 passes of FSP on low quality A356 sample. ...................................... 86 Figure 93. Overall fractograph after 3 passes of FSP on low quality A356 sample with an elongation of 18.8%. .................................................................................................................................. 87 Figure 94. Fracture surface of 3 passes of FSP on low quality A356 sample. ...................................... 87 Figure 95. μ-CT scan on the specimen showing the tunnel defect due to process parameters with ω=1000 rpm and vt=100mm/min ............................................................................................. 99 Figure 96. μ-CT scan on the specimen showing the reduction in the defects density due to the process parameters of ω=700 rpm and vt=50mm/min ........................................................................ 100 Figure 97. Distribution of void size on the fracture surface of 304LN stainless steel [57]. ............... 101 Figure 98. The correlation between average void size and ductility [57]. .......................................... 102 Figure 99. Histogram of the data for the 3 passes of FSP in a high quality ingot, showing also the fitted 3 parameter lognormal distribution. ............................................................................. 103 Figure 100. The relationships between average void diameter and ductility of the specimens: (a) elongation,(b) reduction in area, and (c) quality index. ......................................................... 105 Figure 101. The correlation between average void size and average nearest-neighbor distance. ....... 107
x
Abstract Friction Stir Processing (FSP) is a promising thermomechanical technique that is used to modify the microstructure of metals locally, and thereby locally improve mechanical properties of the material. FSP uses a simple and inexpensive tool, and has been shown to eliminate pores and also reduce the sizes of intermetallics in aluminum alloys. This is of great interest for research on solidification, production and performance of aluminum alloy castings because FSP can enhance the structural quality of aluminum casting significantly by minimizing the effect of those structural defects. In the literature, there is evidence that the effectiveness of FSP can change with tool wear of the tool used. Therefore, a study was first conducted to determine the effect of FSP time on the tool life and wear in 6061-T6 extrusions. Results showed the presence of two distinct phases in the tool life and wear. Metallographic analyses confirmed that wear in Phase I was due to fracture of the threads of the tool and Phase II was due to regular wear, mostly without fracture. Moreover, built-up layers of aluminum were observed between threads. The microhardness profile was found to be different from those reported in the literature for 6061T6, with Vickers hardness increasing continuously from the the stir zone to the base material. To investigate the degree of effectiveness of FSP in improving the structural quality of cast A356 alloys, ingots with different quality (high and low) were friction strir processed with single and multiple passes. Analysis of tensile test results and work hardening characteristics showed that for the high quality ingot, a single pass was sufficient to eliminate the structural defects. Subsequent FSP passes had no effect on the work hardening characteristics. In contrast, tensile results and work hardening characteristics improved with every pass for the low quality ingot, indicating that the effectiveness of FSP was dependent on the initial quality of the metal.
1
The evolution of microstructure, specifically the size and spacing of Silicon (Si) eutectic particles, was investigated after friction stir processing of high quality A356 castings with single and multiple passes. Si particles were found to coarsen with each pass, which was in contrast with previous findings in the literature. The nearest neighbor distance of Si particles also increased with each FSP pass, indicating that microstructure became progressively more homogeneous after each pass. In the literature, the improvement observed after FSP of Al-Si cast alloys was attributed to the refinement of Si particles. Tensile data from high quality A356 ingot showed that there was no correlation between the size of Si particles and ductility. To the author’s knowledge, this is the first time that the absence of a correlation between Si particle size and ductility has been found. Keywords: Microstructural characterization; tool life; defect elimination; ductility improvement; quality index
2
1. Introduction Aluminum has a density of 2.7 g/cm3, approximately one-third of steel (7.83 g/cm3). This light weight combined with the high strength that can be obtained with certain alloying elements, such as Zn, Mg and Cu, allows for the design and construction of lightweight structures that are particularly advantageous for the aerospace and automobile industries [1]. The unique combinations of properties provided by aluminum and its alloys make aluminum one of the most versatile, economical, and attractive metallic materials for a broad range of uses - from soft, highly ductile wrapping foil to the most demanding engineering applications [1]. Cast Al–Si–Mg alloys are usually used for high-strength components in aerospace and automotive industries [2]. One of the most commercially applied Al–Si–Mg alloys in industry is the A356 (Al–7%Si–0.4% Mg) alloy [3]. However, structural defects, such as pores, oxide inclusions and intermetallics, reduce the mechanical properties of aluminum alloy castings, particularly the elongation and fatigue life. Several post processing techniques, such as hot isostatic pressing (HIP) [4, 5], are available to reduce the effect of these structural defects. However structural defects remain prevelant in aluminum castings, to the point that some researchers consider them to be intrinsic [6, 7] and therefore not possible to eliminate. However, recent research [8] has demonstrated that structural defects are extrinsic, and the true properties of cast aluminum alloys have yet to be determined. In wrought products, such as forgings and extrusions, deformation is applied to the continuously-cast aluminum . These deformation processes can eliminate pores completely, but inclusions and intermetallics remain in the microstructure, and continue to affect mechanical properties adversely [9, 10]. To determine the potential mechanical properties of wrought and cast aluminum alloys, parts either need to be produced without structural defects, or the defects should be minimized, if not eliminated by a secondary process. This study focuses on the second alternative. 3
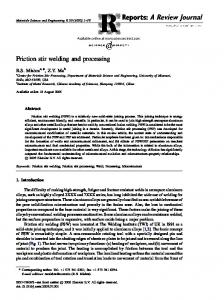
In friction stir welding (FSW), a rotating tool is used to produce plastic deformation and frictional heating to join two metallic components [11, 12]. The tool, consisting of a pin and a shoulder, is plunged between two plates while rotating, until the shoulder gets in contact with the outside surface of the workpiece. Subsequently, the tool is forced along the line of the joint while the shoulder remains in contact with the workpiece. Friction stir processing (FSP) is a technique derived from FSW [13, 14] and is shown schematically in Figure 1. In FSP, the purpose is not welding two pieces but modifying the local microstructure in a single workpiece.
Figure 1. Schematic illustration of friction stir processing (adopted from Ref. [2]).
In cast Al-Si-Mg alloys, FSP was found to modify Si eutectic-dendritic structures and refine the oxide inclusions [3, 15, 16]. The elimination of these defects has important ramifications on the use of castings. The literature for cast Al-Si-Mg alloys attributes the refinement of Si particles and defect elimination by FSP as possible reasons for improvement in mechanical properties enhancement [17, 18]. If FSP is capable of eliminating/healing those 4
defects, it becomes finally possible to determine intrinsic properties of these alloys after remelting and/or heat treatment to obtain various microstructures. This study is motivated by the potential of FSP to heal casting defects and significantly improve the structural quality of aluminum alloys.
5
2. Literature Review 2.1. Microstructure and defects In aluminum castings, structural defects, namely oxide bifilms and pores, are common [19]. These structural defects deteriorate tensile strength, elongation [20, 21], and fatigue life [2225]. Therefore, it is common to find oxide bifilms and pores on fracture surfaces in cast aluminum alloys. A pore and a folded-over surface oxide film (bifilm) found on the fracture surface of an A356 aluminum alloy casting are shown in Figure 2 [20].
Bifilm
Figure 2. Structural defects identified on the fracture surfaces of A356 alloy castings broken in tension [20].
6
Molten aluminum benefits from the formation of an oxide skin which acts as a protective layer, and prevents further oxidation into the melt. However, a harmful bifilm is formed when the surface oxide film is submerged due to an external or internal force and the film has to fold over itself while it is entrained into the bulk liquid. After entrainment, the two oxide surfaces will have contact without any bonding between them, which acts like a crack [26]. Bifilm defects that form during mold filling are usually too thin to detect via nondestructive tests but they have been observed on micrographs and fracture surfaces. A “young” bifilm, found [27] on the fracture surface of an Al–7Si–0.4Mg alloy casting is shown in Figure 3. The bifilm was confirmed to be pure alumina and the thickness of the thinnest part was approximately 20 nm [19], indicating that the film formed during mold filling. Divandari [28] captured a polished section of a cast aluminum alloy breaking into a tangled bifilm (indicated by arrows), presented in Figure 4. This coarse bifilm is an “old” bifilm that formed in the melt and found its way into the casting.
Figure 3. A bifilm on the fracture surface of an Al–7Si–0.4Mg alloy casting [27].
7
Figure 4. Polished surface of Al–7Si–0.4Mg alloy breaking into a bifilm, showing upper part of the double film removed, revealing the inside of the lower film [28].
In addition to pores and oxide bifilms, Fe-containing phases, especially β-platelets are known to reduce tensile properties.
Cao and Campbell [29-31] found that Fe-bearing
constituents, including β-platelets, nucleate on oxide films that get entrained into the melt from the ingot or during mold filling. They stated that (i) the gap between two dry inner sides of a bifilm act as a crack, and (ii) the wetted outer sides are preferred substrates for the nucleation and growth of some intermetallics, especially Fe-rich phases. Cao and Campbell provided some SEM images, such as the one in Figure 5, which shows central cracks in certain intermetallics and apparent decohesion between some intermetallics. Experimental results reported by Miller et al. [32] and Liu et al. [33] provide strong support for this explanation. In both studies, the nucleation of β-platelets on bifilms were observed. A micrograph, showing a bifilm in the center of a β-platelet, provided by Liu et al., is presented in Figure 6. DeBartolo and Hillberry [34] demonstrated that the size distribution of β-platelets can be taken as the flaw size distribution in wrought aluminum alloys. Hence, the number density and size of β-platelets are an indication of oxide film entrainment (damage) to liquid aluminum. 8
Bifilm
Figure 5. SEM image of a β-platelet in an Al-11.5Si-0.4Mg cast alloy [29].
Bifilm
Figure 6. Optical micrographs of the Al-11.6Si-0.37Mg alloy prepared under conditions of heavily agitated to maximize oxide film entrainment. The β-Fe plate in the agitated sample contains a crack-like defect[32]. The effect of area fraction of pores, determined by metallographic analysis, on the elongation of A356-T6 alloy castings with a yield strength of 250 MPa is presented in Figure 7. Note that 1% area fraction of porosity is sufficient to reduce elongation by 50%.
9
Tiryakioğlu
Figure 7. The effect of area fraction of pores (f) on elongation of A356 castings. The expected defect-free elongation (eF(int)), as well as fits from two different models are also indicated [21].
2.1.1 Tensile Deformation Work hardening takes place because of the increase in dislocation density with deformation. Characterization of work hardening involves analysis of both true stress (σ) -true strain (ε) relationship as well as the change of work hardening rate at different stages of deformation. Deformation occurs in mono- and polycrystals in several stages. Stage I occurs only during single slip in single crystals. This stage is known as easy glide because large amount of strain can be achieved without much work hardening. When certain amount of strain is reached, a transition occurs for single crystals from low hardening rate to larger and cause the raise of Stage II [35]. Stage II, also referred to as athermal work hardening, is a stage with a higher work hardening rate. Stage II occurs in both single crystals and polycrystals and work hardening rate decreases with increased testing temperature. Stage I and Stage II occur independently. Stage III (dynamic work hardening), corresponds to a steady decrease of work hardening rate [35].
10
In aluminum alloys, the Stage III work hardening rate was found to (i) start at approximately 3 GPa [36] and (ii) decrease linearly with true stress, which represents the Kocks - Mecking (KM) work hardening model [37-39]:
d 0 K d p
(1)
where Θ0 is the initial work hardening rate and K is the KM parameter.
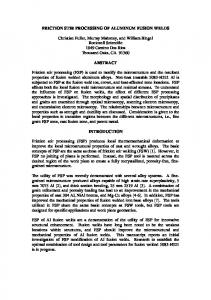
Figure 8. Stages of work hardening in aluminum alloy specimens without sructural defects [40]. Characteristics of tensile deformation can be used as a tool to assess the structural integrity of castings. In castings, work hardening rate analysis has been used [40, 41] to characterize structural quality; when Θ was plotted versus σ in cast aluminum alloys, a sudden drop was observed just prior to fracture [40-42]. Fractographic analyses showed that this sudden drop could be attributed to major casting defects. In specimens with higher structural quality (no major defects), there was no sudden drop in Θ and deformation continued past the intersection of the curves for Θ and σ. The KM parameter K has a profound effect on elongation, as shown in Figure 10 and Figure 11. With increasing K, elongation was found to
11
decrease in A206-T7, and A357 aluminum alloy castings [42]. Also there is a sudden decrease in Θ just prior to final fracture.
Figure 9. Sudden drop in work hardening rate just before the final fracture, due to structural defects in a A206 alloy cast specimen [42]. 2500
Eutectic HIP K=24.27 0=10558 MPa eF=4.9% Typical HIP Qs=24% K=21.83
(MPa)
2000
1500
0=9746 MPa eF=10.9% Qs=52%
no HIP K=43.64 0=16546 MPa eF=2.4% Qs=13%
Typical HIP K=10.05 0=5535 MPa eF=18.1% Qs=96%
1000
500
0 300
350
400
(MPa)
450
500
Figure 10. Change in Stage III work hardening characteristics with structural quality in A206 aluminum alloy castings [42].
12
Figure 11. The change in elongation with Kocks-Mecking parameter, k, in Al–7%Si–Mg castings [43] Based on the findings shown in Figure 10, Tiryakioǧlu et al. [42] explained schematically how work hardening behavior is affected with structural quality, as presented in Figure 12. When the castings are free from defects, Stage II continues uninterrupted until the Considere criterion is met, without a sudden drop in work hardening rate.
Figure 12. Schematic illustration of the change in work hardening behavior in cast Al alloys with structural quality and ideal behavior in the absence of structural defects [42].
13
2.1.2. The effect of Si particle size on tensile properties of cast Al-Si alloys Gangulee and Gurland [44] were among the first to observe in situ that Si eutectic particles fractured early in plastic deformation and intense slip bands appeared between fractured Si particles, which led to cracks and eventually to final fracture. It has been shown [44-47] that the fraction of cracked Si particles increases linearly with plastic deformation. Moreover, it was shown [48] that the probability of a Si particle to crack at a given plastic strain is related to its equivalent diameter (deq). Hence, the statement by Zhang et al. [49] that ductility in cast Al-7%Si-Mg alloys is determined by morphology and size of Si particles, is widely accepted in the literature. Recently Alexopoulos et al. [50] investigated the effect of Cu in A357 casting alloy produced by the Sophia process, coupled with Sr, Sm and Ag additions on microstructure and tensile properties. They found a correlation between mean particle size (m) and mean elongation (%) eF: 3.12 eF 9.48 deq
(2)
where elongation is in percent and Si particle size is in microns. Equation 2 provided respectable fits to data, which is in agreement with previous results in the literature. However, Alexopoulos et al. also observed that the Weibull distribution for elongation in A357-Cu-Sr castings was bimodal although the lognormal distribution for Si particle size was unimodal. Consequently, they concluded that the strong correlations between elongation and Si particle size and shape did not indicate causation. In a recent study on the effect of solution treatment on the microstructure and tensile properties of A383 aluminum alloy castings, Eisaabadi et al. [51] found that the structural quality, QT, measured as a function of elongation (to be discussed later) follows the reverse trend of what was reported by Alexopoulos et al. Hence, the authors stated that that ductility
14
may not be correlated only to si particle size, but may also be affected by another factor, such as oxide bifilms. 9.0 8.0 7.0 6.0
eF (%)
5.0 4.0 3.0 2.0 1.0 0.0 1.0
1.1
1.2
1.3
1.4
1.5
1.6
1.7
deq (μm)
Figure 13. Expected elongation versus average equivalent diameter of Si particles [50].
Figure 14. Structural quality versus average equivalent diameter of Si particles from two studies [51]. In both studies, Si particles were spheroidized by either the addition of modifying elements (Alexopoulos et al.) or solution treatment (Eisaabadi et al.).
2.1.3. Fracture Surface Characteristics Void initiation and growth models [52-54] predict the ductile fracture behavior of metals by assuming a pre-existing pore or inclusion distribution. Broek [53] reported that the void initiation strongly depends on size of the inclusion particle that nucleates the void. Voids do 15
not necessarily nucleate from inclusions alone [54]; they may nucleate from constituent intermetallic phases [55, 56], grain boundaries, shear bands, or heterogeneities such as dislocation pile-ups [57]. These voids later coalesce and lead to final fracture, and appear as dimples on fracture surfaces. Although fracture surfaces of most aluminum alloy castings are dominated by structural defects and cleavage [58], voids are clearly visible on the fracture surfaces of high quality castings. Two examples are provided in Figure 15 [41] and Figure 16 [36]. Note in Figure 15 that large, fractured Si particles are at the center of large voids on the fracture surface of a high quality D357 aluminum alloy aerospace casting. However, between those large voids, there are micovoids with sizes smaller than 1 μm, indicating that extensive deformation has taken place within the eutectic region prior to final fracture. In Figure 16, the entire fracture surface of an A357 alloy casting with a high quality level is occupied by voids. A fractured Si particle is at the center of a void, as indicated by an arrow.
Si
Figure 15. Microvoids near a Si particle on the fracture surface of a high quality D357 aluminum alloy aerospace casting [41].
16
Figure 16. Voids on the fracture surface of a high quality A357 aluminum alloy casting. A damaged silicon particles at the center of a void is indicated by the arrow [36].
2.1.3. Structural Quality The damaging effect of casting defects on the tensile strength and elongation (eF) of cast aluminum alloys have been reported in many studies [5, 21, 40-42, 60-63]. Elongation is the property that is most adversely affected by casting defects [59]. It has been reported [64] that cast Al-Si alloy specimens do not neck during tensile testing, even when they are excised from aerospace castings. Failure in metals is the outcome of two competing modes: plastic deformation and fracture [65]. If the stress necessary for permanent deformation is lower than the stress necessary to permanently separate atoms, plastic flow occurs instead of fracture. From the point of view of maximizing resistance to failure, plastic deformation is a more preferable “failure” mode, since plastic flow preceding fracture markedly increases the work accompanying the fracture. The energy absorbed per volume by a tensile specimen, which is commonly also referred to as the strain energy density, can be found by the area under the true stress-true strain curve. Alexopoulos and Tiryakioğlu [66] analyzed true stress-true strain curves in A357 alloy castings and showed that elongation to fracture is an excellent estimate 17
of the strain energy density. Similar results were reported for A206 aluminum alloy castings [42]. Tiryakioǧlu et al. [67-71] proposed the concept of ductility potential for cast aluminum alloy, to develop a new quality index. The author used tensile data from aerospace and premium quality castings to determine whether there is a relationship between maximum elongation, eF(max), and yield strength, σY. They reported that maximum elongation, i.e., ductility potential, can be estimated by [67]: eF(max) (%) = β0 − β1 σY
(3)
where β0 and β1 are alloy dependent coefficients, and are 36.0 and 0.064 MPa-1 for cast Al-SiMg alloys, respectively. Based on the concept, quality index, QT, is found by: QT =
eF
eF(max)
=
eF β0 -β1 σY
(4)
Note that Equation (4) represents the ratio of energy absorbed during deformation to energy that would be absorbed if deformation was not interrupted prematurely by fracture due to casting defects.
Maximum possible elongation, eF(max)
eF
eF(max)
eF experimental point
Y Figure 17. Schematic illustration of the use of QT to determine structural quality [67]. 18
2.2. Friction Stir Processing of Aluminum Alloys Friction stir processing of aluminum alloys has been investigated in several studies. Before reviewing the main findings of these studies, general concepts of FSP are first introduced. 2.2.1. A Review of FSP Parameters There are three important process parameters for FSP: Tool geometry, rotational rate (ω-rpm), in clockwise or counterclockwise direction and transverse speed (Vt -mm/min) [12]. The advance side (AS) is where the rotational tool is in the same direction of the advancing movement and the opposite side is called retreating side (RS) [72]. The FSP tool is composed of a pin and a shoulder, as shown at Figure 18. During the process, the tool has two main purposes: i) heat the material by internal friction due to severe plastic deformation and ii) cause the material flow locally [11, 12, 73]. The heat from the process generates a temperature increase of 400-500oC [11, 74], and consequently softens the aluminum alloy, bringing it to malleable state and promoting the flow from the front to the back of the tool and around the pin [11, 73]. The pin geometry is a critical parameter to determine the material flow during FSP process. Threads move the material down along the pin, and once the material reaches the bottom, the pin geometry will move the material up and away from the pin [11, 73]. The flutes in the pin can promote and amplify the material flow [73]. This complex pattern of material flow results in different heat dissipation zones and mechanical properties [75]. More details about the process can be found in a recent reviews [11, 76].
19
Figure 18. FSP tool geometry and different types of FSP tools [11]. Usually, the FSP tool is held at a tilt angle of 1- 3° to increase the forging action and adequate metal flow around the tool during FSP[79], as schematically shown in Figure 19. The shoulder also provides the confinement of the heated material [11]. If downward force or heat input is insufficient or the flow of plasticized metal is not appropriate, a tunnel defect, i.e., continuous pore along the traverse direction, can form [73, 80], known as the tunnel defect. A tunnel defect encountered in the preliminary experiments is provided in Appendix A.
Figure 19. The effect of FSP tool tilt angle on the metal flow patterns during FSP (adapted from Ref. [11]).
20
2.2.2. The Effect of FSP Parameters on Microstructure The effect of FSP on the sizes of Si particles in a cast A356 aluminum alloy is shown in Figure 20 [81]. Note that Si particles became smaller in size.
Figure 20. Microstructure of an A356 alloy casting (a) before, and (b) after FSP [81].
The evolution of the average equivalent diameter of Si eutectic particles, dSi, was investigated in cast Al-Si alloys, including A356 [3, 82-84], A319 [85], A390 [86]. In every study in the literature, Si particles were found to become smaller in size after FSP. The effect of rotational speed on the size of Si particles in final microstructure in A356 aluminum alloy is presented in Figure 21 and Figure 22. With increasing rotational speed, the size and aspect ratio of Si particles as well as the grain size, are reduced, which is consistent with similar studies in the literature [91].
21
Figure 21. Optical micrographs of the stir zone after FSP with various rotation rates: (a) 500, (b) 800, (c) 1000, and (d) 1250 (rpm) [3].
Figure 22. Average aspect ratio and size of Si particles and grain size of as-cast and FSPed A356 [3]. The grain size results reported by Alidokht et al. were reanalyzed. The reduction in average dG in cast A356 alloy with rotational speed is presented in Figure 23. Note that grain size is reduced approximately an order of magnitude for all FSP conditions.
22
Figure 23. The change in grain size in A356 cast aluminum alloy with rotational speed during FSP (Data from [3]).
2.2.3. Microstructural zones in FSP The stirring action during FSP can be expected to change drastically with distance from the tool, leading to complex microstructures and heat dissipation zones, described the cross section in Figure 24. The dynamic recrystallized zone (DXZ) is the fully processed zone caused by the stirring action. The heat from the plastic deformation will regenerate the thermomechanically affected zone (TMZA) and the heat affected zone (HAZ). The part that is not affected by the heat in the base material (BM)
23
Figure 24. a) The cross-sectional macrostructure of Case 1 (typical FSP) and (b) marked the BM, HAZ, TMAZ, and DXZ of the FSP 6061-T6 Al alloy [87].
Figure 25 shows a TEM image for each zone. The DXZ zone is cleary more refined and homogenous than the BM. Moreover, those different microstructural zone exihite different harndess profile. Figure 26 describes the hardness profile for each zone, took in different times (after 168 and 5760 hours of FSP). The DXZ shows lower hardness profile than the BM due to the coarsening and/or dissolution of strengthening precipitates in the Al matrix. Similar results were reported for the FSW of 6061-T6 [88].
24
Figure 25. TEM bright-field images measured 5760 h after the FSP: (a) BM and (b) DXZ (c) HAZ (root) and (d) TMAZ (face) [87]
Figure 26. Hardness profiles measured along the face and root in Case 1: (a) 168 hours and (b) 5760 hours after FSP [87].
2.2.4. The Effect of Multiple Passes In a majority of the studies on FSP, the effect of process parameters on the microstructure was characterized after a single pass. However, multiple-passes of FSP is another method to further 25
modify the microstructure in Al castings. Baruch et al. [2] investigated the evolution of microstructure in A356 castings with each FSP pass. They used a rotational speed of 600 rpm and transverse speed of 12 mm/min and performed two and three passes with 100% overlap from the previous zone. The average Si particle diameter without FSP was found to be 5.50 μm. After FSP, average dSi size was reduced to 1.17 μm after the first pass, and further reduced to 0. 86 and 0.80 μm after two and three passes, respectively. These results were not confirmed by Ma et al. [84] who found that average Si particle size obtained after a single pass remained unchanged after multiple passes at ω=700 rpm and Vt=203 mm/min with a triflute tool.
Figure 27. Optical micrographs of the stir zone showing Si particle size after (a) single pass (b) 2 passes and (c) 3 passes[84] Because Si particle size has been found [50, 89, 90] to also follow the lognormal distribution, Si particle size distributions were inferred from results of Baruch et al. The parameters of the lognormal distributions were determined based on the average and standard
26
deviation estimates reported by Baruch et al. Results are presented in Figure 28, which are similar to those reported [85] for A390 alloy castings.
Figure 28. Probability density functions of Si particle equivalent diameters after 1, 2 and 3 passes inferred from the results of Baruch et al.
2.2.5. Characterization of tool wear in FSP The wear characteristics of the tool in FSP/FSW of aluminum alloys were investigated in only a few studies. Prado et al. [91] investigated the tool wear for FSW of 6061+20% Al203 and reported a severe tool wear, eliminating all the threads of the pin, as depicted in Figure 29 [91]. Note that threads completely disappear with FSW distance for 6061+20% Al2O3. Zeng et al. [92] reported tool wear during FSW of 6061-T6 aluminum alloy, in which the tool made of H13 tool steel lost most of the threaded profile . The absence of threads resulted in a massive void in the bottom of the stir zone, a structural defect called tunnel defect (an example is presented in Appendix A).
27
6061+20% Al203
6061
Figure 29. Wear characteristics of a FSW tool with distance welded in 6061+20% Al203 and 6061 [91].
In another study, Prado et al. [93] reported how the FSW tool wears with weld distance and transverse speed, as presented in material flow changes as the FSP tool wears, which is presented in Figure 30. Note that for each transverse speed, wear reaches steady state, i.e., the tool wears to a shape after which there is no wear. Prado et al. [93] referred to this phenomenon as the “self-optimization” of the tool because no process defects were found after steady state has been reached. The initial and “self-optimized” tool geometries are shown schematically in Figure 31 [93], which shows that the flow pattern around the FSW tool also changes with wear. This may help explain why the hardness profiles in and around the weld zone at the start (no wear) and end (self-optimized) of FSW process presented in Figure 32 are different.
28
Figure 30. Evolution of wear with FSW distance and tranverse speed for 6061+20% Al203 [91]. The point at which wear rate reaches steady state is indicated by arrows.
Figure 31. The initial and “self-optimized” tool geometry after which there is no wear nor process defect [93]. The associated material flow around the tool is also indicated, where there is a turbulent flow around the threads (a) and a laminar flow after the wear (b).
29
Figure 32. Hardness profile in and around the weld zone at the start and end of the FSW process, showing the effect of tool wear n the hardness distribution [93].
2.3 The Effect of FSP on Casting Defects Structural defects from cast aluminum alloys, such as pores and oxide films, can affect the mechanical properties significantly [67]. Specifically, the size distribution of structural defects can be linked to the statistical distribution of fracture properties, such as fatigue life [94, 95]. If these extrinsic structural defects can be minimized or even eliminated, the intrinsic mechanical properties and performance of aluminum castings can be determined The primary benefit of FSP in cast aluminum alloys is the reduction in size, even elimination of pores [96]. The change in pore sizes in cast aluminum alloys after FSP have been reported in many studies [17, 86, 97, 98]. Overall, authors reported that FSP resulted in a significant decrease in the size of the pores in castings. The degree of pore healing is affected by the initial size of pores. Ma et al. [99] studied the effect of FSP in A356 castings with initial 30
pores of 1-2 μm in diameter. After FSP, no pores could be observed in the stir zone. Similar results were reported in A206 alloy castings by Apelian et al. [17] and Kapoor et al. [97]. Mahmoud et al. [86] found pores with sizes ranging from 10 to 150 μm in the as-cast A390 alloy samples. After FSP, only micropores of 1-2 μm in size were visible. Moreover, the size of the micropores were in the order of grain size, which was found to be 3 μm.
Micrographs
of a cast 319 aluminum alloy before and after FSP are shown in Figure 33. After FSP, no pores were visible in the microstructure.
Figure 33. Micrographs of an A319 alloy casting (a) before, and (b) after FSP [96].
Along with Si eutectic particles, constituents such as the Fe bearing β-platelets (Al5FeSi) are also altered during FSP. An example is presented in Figure 34, which shows that the β-platelets which are approximately 100 μm in length in as-cast condition are reduced in size to less than 5 μm in an A206 cast aluminum alloy [97].
31
Figure 34. SEM backscatter image of intermetallic particles in A206 (a) in as-cast condition, and (b) after FSP [97]. It is clear that FSP significantly reduces the sizes of pores and constituents, or oxide films on which they nucleate, in castings. Consequently, the mechanical properties of FSPed cast aluminum alloys are expected to be superior to those that are tested without FSP. The extent of improvement in mechanical properties is addressed next.
32
3. Analysis of Results from the Literature 3.1. The Effect of process parameters on microstructural evolution in Al-Si alloys The results from four independent studies on cast aluminum alloys are compiled and presented in Figure 35, which shows the effect of rotational speed on dSi. Note that there is no consistency between the studies on how average Si particle diameter evolves with increasing rotational speeds, other than the general observation that FSP reduces dSi. Transverse speeds, which are also indicated in Figure 35, affect dSi differently for different alloys and/or at different levels of ω.
For A319, increasing Vt from 12.5 to 20 mm/min produces larger Si particles. In
contrast, increasing Vt from 10 to 20 mm/min in A390 alloy castings results in finer Si particles. Because these observations were made at vastly different rotational speeds, i.e., 300 rpm for A319 and 1500 rpm for A390, there is a strong possibility that there is an interaction between Vt and ω. Hence the effect of Vt probably depends on the level of ω.
Figure 35. The evolution of diameter of Si particles with tool rotational speed, ω for different cast Al-Si alloys including A356 [3, 84] A319 [85], A390 [86] FSPed at various transverse speeds. 33
Kapoor et al. [97] investigated grain size before and after FSP for cast A206 alloy. The grain size results reported by Kapoor et al. were reanalyzed in the present study, and found follow the lognormal distribution, which is consistent with previous findings reported in the literature [100]. The density function, f, of the lognormal distribution is written as:
f(x) =
1 (x − τ)σ√2π
exp [
−(ln(x − τ) − μ)2 ] 2σ2
(5)
where τ is the threshold value below which probability of x is zero, μ is the location parameter and σ is the scale parameter. The mean of a 3-parameter lognormal distribution is found by: deq = τ + e
μ+
σ2 2
(6)
The lognormal analysis results are presented in Figure 36. Note that both axes are logarithmic so that both distributions can be presented in the same plot. As in A356 castings, FSP reduces dG in A206 but the level of reduction is higher than in A356, and is approximately two orders of magnitude.
34
Figure 36. Grain size distribution of A206 and FSPed samples by using data of Kapoor et al.
Because the length of β-platelets, Lβ, was shown [34] to also follow the lognormal distribution, the results of Kapoor et al. [97] were reinterpreted statistically. The fitted lognormal distributions for Lβ before and after FSP are presented in Figure 37. Note that FSP reduces the sizes largest β-platelets, i.e., largest oxide films, whereas the lower tail, i.e., smallest platelets (films) are not altered.
35
Figure 37. The distribution of lengths of β-platelets before and after FSP in A206 castings.
3.2. The effect of FSP on tensile properties As discussed previously, there is strong evidence in the literature that FSP reduces the sizes of casting defects significantly. To determine the extent of this effect on tensile properties, eleven datasets for the literature were collected and reanalyzed by using the quality index, Q T. The yield strength-elongation data from these datasets are presented in Figure 38. Note that the ductility potential for Al-Si-Mg alloy castings is also indicated and there are several data points that exceed the ductility potential line. These results are summarized in Table 1, in which the number of tensile results in as cast (no FSP), nac, number of tensile results after FSP, nFSP, and the corresponding maximum QT values are listed. Note that in every dataset, a significant increase in QT was achieved. Moreover, in seven datasets, the maximum QT after FSP was at least 0.90 and in five datasets, it exceeded 1.00. Hence, structural quality levels well in excess of aerospace and premium quality castings could be obtained by FSP although the starting as cast material had QT levels of 0.10 or less. These results provide compelling evidence that FSP heals casting defects to a great extent, if not completely.
36
Figure 38. Yield strength – elongation plot for as-cast (no FSP) and FSPed specimens. The micrographs showing the microstructure below the fracture surfaces in as-cast and FSPed A356 alloy tensile specimens are presented in Figure 39 [98]. The as-cast specimen that fractured at eF=3%, exhibited no necking, consistent with results reported for aerospace castings [64]. Moreover, secondary cracks under the fracture surface are visible. The fracture surface is tortuous which indicates that multiple cracks probably formed from entrained oxides during deformation, which later coalesced and led to final, premature fracture. In contrast, the FSPed specimen showed no secondary cracks below the surface and the specimen did neck prior to fracture. Additionally, some Si particles below the fracture surface seem to have cracked. However, these cracks did not extend into the aluminum matrix. Consequently, elongation was 31% which was above the ductility potential previously estimated for these alloys, as indicated by the QT value (1.13) exceeding 1.0.
37
Table 1. Details about the datasets from literature that were reevaluated in this study. Dataset
Alloy
nac
nFSP
1
1
10
2
1
11
1
5
4
1
10
5
1
10
6
3
3
1
15
8
2
3
9
1
12
0
10
1
12
3
7
10 11
A356
A319
A357
Ref. [16] [16] [16] [84] [84] [96] [101] [96] [102] [102] [102]
Notes
Max QT (No FSP)
Max QT (FSP)
No heat treatement
0.10
1.10
Aging
0.07
1.40
T6 heat treatment
0.08
1.34
Multiple passes
0.10
1.31
Multiple passes + T6
0.08
1.33
No heat treatement
0.04
0.45
No heat treatment
0.07
0.42
No heat treatment
0.02
0.34
No heat treatment
0.03
0.94
-
0.90
0.04
0.63
Aging T6 heat treatment
Figure 39. Micrographs showing the area below fracture surfaces [98] and their corresponding tensile properties in as-cast and FSPed A356 alloy casting tensile specimens.
38
4. Research questions Based on the literature review presented above, the following questions will be addressed in this study: 1. What are the effects of process parameters on the microstructural evolution in cast AlSi-Mg alloys? 2. What are the tool wear characteristics during FSP of aluminum alloys? What is the hardness profile after FSP? 3. How does FSP affect the size distribution of Fe containing constituent particles in Al alloys? 4. What is the effect of initial structure quality on the effectiveness of FSP? 5. What is the effect of multiple FSP passes on Si particle size, distribution, and homogeneity of the microstructure? 6. What is the relationship between Si particles size and ductility after FSP redistributes flaws and second phase particles?
39
5. Experimental details 5.1. Preliminary investigation One important feature of FSW/P is the use of readily available machines, such as vertical milling machines, to conduct the experiments. In this section, the experimental set-up, the basic equipment and process parameters optimization to conduct the FSP process are discussed in detail. The procedure to reach the optimum parameters is described in Appendix A. Friction stir processsing was conducted on a vertical Bridgeport milling machine. It was noticed that when the specimen was fixed on the milling machine, there was significant vibration and the specimen was moving during the process. The sample that was going to be subjected to FSP had to be clamped firmly before the process started. Therefore, a special fixture was designed and built for this research project, and was used to hold the workpiece fixed during the entire process. Figure 40 shows the FSP process set-up in the milling machine, with the specimen clamped in the fixture.
Figure 40. FSP process set-up used in the present investigation. 40
5.2. Experimental Procedure for Phases I and II FSP was conducted in 6061-T6 extrusions (Phase I) as well as high quality and traditional low quality cast ingots of A356-F (Phase II). The chemical composition for those alloys is described in table Table 2. Table 2. Chemical compositions for the A356 and 6061 alloys used in this study. Si
Fe
Cu
Mn
Mg
Zn
Ti
Al
A356
6.5-7.5
0.6
0.25
0.35
0.20-0.45
0.35
0.25
Remainder
6061
0.400.8
0.7
0.150.40
0.15
0.8-1.2
0.25
0.15
Remainder
Extruded bars of a 6061-T6 aluminum alloy with the dimensions 330×25.4 mm, were used in this study. Single passes of twenty sections of 25.4 mm were FSPed with no overlap from the previous zone. To evaluate the tool wear during the FSP, a micrometer was used to measure the pin diameter, placed in contact with the tool shoulder after cutting each section, in the same spot in every measurement procedure after 30 seconds of FSP, having cut 2.54 cm. Samples excised from high and low quality cast ingots of A356 were machined into 100×80×10 mm bars. Single and multiple passes of 100 mm were performed on a smooth working surface. Two and three passes had 100% overlap over the previous zone. FSP was conducted on a Bridgeport vertical milling machine, presented in Figure 40, with the FSP tool tilted 3º opposite to the processing direction. The specimens were clamped in the fixture as depicted in Figure 40. The tool rotation rate and transverse speed were kept constant at 700 rpm in clockwise direction and 50 mm/min, respectively. The FSP tool was made of H13 tool steel with a shoulder diameter of 18 mm. The cylindrical pin had a diameter of 5.9 mm, a length of 5 mm and M6-threads, represented at Figure 41 and Figure 42.
41
Figure 41. Schematically of FSP Tool dimensions used in this study
Figure 42. The FSP tool used in this study.
To evaluate the hardness profile for each FSP zone in the 6061-T6 extrusion, microhardness tests were carried out on a Shimadzu HMV G21 automated Vickers microhardness tester with load of 98.07mN and dwell time of 15s for 20 indentations. For the cast A356, tensile tests were conducted. Specimens were excised, parallel to the FSP direction, from FSPed materials at CNC HAAS mini-mill following the E8-M ASTM standard for sub-size specimen, represented at Figure 43, with the gage being completely within the stir zone. The specimens were then mechanically polished to have a smooth surface. The 42
tensile machine used was Instron with an extensometer attached to the specimen throughout the tensile tensting. Extensometer gauge length was 25 mm. Tensile tests were carried out at constant strain rate of 10-3 s-1.
Figure 43. CAD model to machine the tensile specimen in the CNC following ASTM e8/M for subsize specimen (dimensions in mm)
The specimens for microstructural examinations were cross sectioned perpendicular to the FSP direction and were prepared by traditional polishing methods, with final polishing performed on a Buehler Vibromet II. A Tescan Mira 3 field emission scanning electron microscope (FE-SEM) with equipped with an Oxford X-Max 50 energy dispersive spectrometer were used to evaluate microstructure on unetched specimens. All sample preparation and microstructural analysis were performed at the UNF Materials Science and Engineering Research Facility (MSERF). Si eutectic particle size and nearest neighbor distance data, Fe particles and dimples size were collected by using the ImageJ freeware. The fracture surfaces of both cats alloys and 1, 2 and 3 passes FSPed specimens were analyzed via scanning electron microscopy. Before fractography, all specimens were cleaned ultrasonically in a methanol solution. Fractographic analysis was conducted at UNF Materials Science and Engineering Research Facility (MSERF).
43
6. Results and Discussion of Phase I: FSP of Extruded 6061-T6 Figure 44.(a) shows the microstructure for the 6061-T6 extrusions used in this study. X-ray map presented in Figure 44.(b) shows the Fe particles in the microstructure. In this section, a complete study of tool wear and built-up edge is provided. Furthermore, particle size and distribution in the microstructure and in the processed zone are discussed in detail.
(a)
(b)
Figure 44. (a) A SEM micrograph of the microstructure of the aluminum matrix and (b) X-ray map for Fe in the Al matrix. 44
6.1. Tool life and wear Tool life in a machining process is described by the Taylor equation [103]; 𝑉𝑐 𝑡 𝑛 = 𝐶
(7)
where Vc is the cutting speed (mm/min), t is the tool life (min), n is an exponent that depends on the cutting parameters and C is a constant. To the author’s knowledge, the Taylor equation has not been applied to the characterization of tool wear in FSP. Vc can be written in terms of rotational speed, ω, and tool pin diameter, dpin, as; 𝑉𝑐 = 𝜔 ∙ 𝜋 ∙ 𝑑𝑝𝑖𝑛
(8)
Combining equations (7) and (8) and rearranging the terms, the change in pin diameter with processing time is written as: 𝑑𝑝𝑖𝑛 =
𝐶 𝜋𝜔𝑡 𝑛
(9)
The change in the pin diameter as a function of FSP time is presented in Figure 45. Equation (7) was fitted to the data presented in Figure 45. When a single curve was fitted, systematic
error was detected. Consequently, two separate curves were fitted, as shown in Figure 45, showing two distinct phases of tool wear. The Taylor equation parameters for the two phases are given in Table 3. Although the values of C for the two phases are not very different, the value of n is significantly lower in Phase II, indicating a substantially lower wear rate. Table 3. Constants for tool life and wear for the two phases. n C m B Phase I 0.0089 12800 0.411 1.33 Phase II 0.0029 12470 0.089 2.50
45
Figure 45. FSP tool diameter described as Taylor equation on Phase I and in a diferent regime after the material depostion, described as Phase II. Wear, defined as the percentage change in the tool diameter with respect to its original diameter, is presented in Figure 46. As can be expected, there are two distinct phases at which wear follow different curves. Note that there is no point where steady state has been reached, which is in contrast with the findings of Prado et al. The best fit curves have the form Bxm, where B and m are empirical constants. The values of B and m are for the two phases are also presented in Table 3.
46
Figure 46. FSP tool wear as a function of the FSPed distance (x), showing two distinct phases.
To determine the reason for the presence of two distinct phases, the cross sections of three pins were analyzed via scanning electron microscopy (SEM); (i) one tool before FSP (no wear), (ii) one tool used in FSP for 60 seconds (7.6 cm) and (iii) one tool used for 120 seconds (15.2 cm). SEM images of the cross-sections of the three pins are presented in Figure 47. In Figure 47.a, threads are intact before any FSP. There was severe fracture on the threads within one minute of FSP, as clearly visible in Figure 47.b. Consequently, there was a rapid reduction in diameter, as described at Figure 45. After sixty seconds of FSP, threads were fractured but were not completely eliminated. Therefore, the predominant wear mechanism at Phase I is found to be the fracture of threads. From 60 to 120 seconds of FSP, the size and profile of the threads remained essentially the same, Figure 47.c. It is clear in Figure 47.b and c that aluminum got deposited around the pin, especially between the threads. During FSP, temperature of the material immediately around the FSP tool
47
may approach 500oC [11, 74]. At such high temperatures, the aluminum matrix is quite soft, adheres and gets fused to the steel surface. The deposited material acts similarly to build-up edge (BUE) in machining operations. The formation of a built-up layer during FSP of an aluminum alloy was also observed Sandeep et al. [104].
In machining, the BUE acts as a
protective layer during processing [105]. Consequently, the tool diameter shows a very gradual decrease during Phase II in Figure 45.
(a)
48
(b)
(c)
Figure 47. SEM micrographs of cross sectioned and polished tool threads profile for: (a) noFSP (unused tool mounted in epoxy) (b) after 60 seconds of FSP, and (c) after 120 seconds of FSP.
49
During the experiments, a FSP tool was broken inside a specimen after approximately 70 seconds of processing, i.e., while in the transition from Phase I to Phase II in Figure 45. To characterize the effect of the stirring action on the microstructure, i.e. material flow, and possible reasons for the tool fracture, the cross-section of the embedded tool was evaluated via SEM. Figure 48 shows the broken tool inside the Al matrix. Note that the tool was fractured in the area between the pin and the shoulder. Moreover, significant wear has taken place by fracture of the threads.
Fracture region of FSP tool
Microhardness test progression
Figure 48. SEM micrograph of a cross section of FSP tool broken inside the Al matrix.
Figure 49 is presented in higher magnification, showing in the area between threads, where there is a distinct detachment from the matrix. This area was interpreted as a built-up layer, similar to the BUE formation in machining, as the Al material is fractured from the matrix and attached in the space between the threads. A part of the tool fractured and embedded into the stir zone around the tool is shown in Figure 50. 50
Figure 49. SEM micrograph of the same specimen shown in Figure 48, at higher magnification depeciting the deposition of aluminum between the threads
Part of the tool fracture
Figure 50. Back-scattered SEM micrograph showing the presence of diferent microstructures and part of the tool that was fractured during the FSP process. 51
6.2 Characterization of microstructural zones To evaluate the hardness profile in the material around the tool, Vickers microhardness tests were conducted in the demarked region, shown in Figure 48. The type of indentation of this microhardness test is represented at Figure 51. The 20 indents on the microhardness test progression zone is shown at Figure 52, where the first 10 indents are represented in Figure 52 (a) and the last 10 at Figure 52(b).
Figure 51. A Vickers microhardness test indentation. The change in Vickers microhardness with increasing distance from the FSP tool is represented in Figure 53, which shows the presence of four distinct zones. In the DXZ zone, the turbulent flow can stir the material with more intensity than the other zones, and also resulting in more heat generation and lower hardness. The softening process for the material around the tool is caused by the coarsening and/or dissolution of strengthening precipitates in the Al matrix. In TMAZ, the reduction in material flow intensity and heat generation resulted in higher hardness profile. HAZ was found to be the less affected zone by the stir action. The results shows the same microstructural zones as the previous study [87]. However, the hardness profile is slighty different from previous study [87]. Instead of a decrease in the hardness from DXZ to the 52
TMAZ, followed by a increase from TMAZ until BM, in this study, the hardness profile always increased as it goes from DXZ to BM, in contrast of what was reported at Figure 26 [87].
First 10 indentations
(a)
Last 10 indentations
(b)
Figure 52. (a) first 10 microhardness indentations, and (b) the last 10 indentations. 53
Figure 53. Microhardness profile of 6061-T6 extrusion as a function of distance from the tool end.
Microstructure immediately behind the tool in Figure 48 was analyzed via SEM. To determine the chemical composition of the constituent phases, X-ray maps were taken, as presented in Figure 44. Figure 54 shows the DXZ zone with refined intermetallic particles and a part of FSP tool that was broken during the FSP process, whereas Figure 55 shows bands of constituent particles for the BM. To further evaluate the effect of FSP in microstructural refinement, digital image processing was conducted with ImageJ software to determine the sizes of the Fe-bearing constituent particles. Subsequently, the Fe particle size distribution for every condition was determined by hypothesizing size follows the lognormal distribution, which is consistent with results reported in the literature [97]. Equivalent diameter, deq, was calculated as 4A deq = √ π
(10)
54
It was noticed that in BM region, there were two Fe-bearing particle size distributions: large particles along grain boundaries, and small particles within the matrix. The probability density function (f) for the mixture of two lognormal distributions is written as [106]: f = f1 ∙ p + f2 ∙ (1 − p)
(11)
The estimated parameters of lognormal parameters are given in Table 4.
Figure 54. DXZ zone showing refine intermetallics particle with the presence of part of the FSP that was fractured during the process
The probability density functions presented at Figure 56 shows that the microstructure (BM) of 6061-T6 is composed of large and small particles of Fe. However, after FSP, the processed microstructure (DXZ) is composed mostly of small particles, a strong evidence of a refined and homogeous microstructure. The upper distribution for large particles is completely eliminated, and all Fe-containing particles follow the same distribution. This result is in agreement with the results of a previous study [97].
55
Table 4. Estimated parameters of the lognormal distributions and the fraction of each distribution in the mixture.
BM (small) BM (large) DXZ
τ (μm) 0.333 0.695 0.345
μ -2.247 -0.291 -2.034
σ p 0.804 0.858 0.772 1.133
Figure 55. Microstructure of Al6061-T6 presented in higher magnification, showing the Fe particle and distribution.
Figure 56. Fe particle size and dsitribution for the base material (No-FSP) and DXZ zone (FSP). 56
7. Results and Discussion of Phase II: FSP of Cast A356-F In this section, a study of the microstructural evolution and tensile properties after friction stir processing was conducted in high and low quality ingots of cast A356 aluminum alloy. Microstructural evolution of the high quality ingot was further evaluated. Tensile properties for both ingots were analyzed by tensile test. The results from tensile test were evaluated for work hardening rate to determine the deformation characteristics of each sample.
7.1. Microstructural Evolution of High quality ingot The microstructure of the as-cast material is presented in Figure 57 and Figure 58 and which shows a well-refined Si eutectic structure. Microstructure consists of -aluminum dendrites with a spacing of 10 microns. Only a few pores were reported in the microscructre and a presence of a rare pore is shown at Figure 59.
Figure 57. The as-cast microstructure of the high quality ingot specimen showing the distribution of Si eutectic phase and aluminum dendrites.
57
(a)
(b)
Figure 58. (a) Microstructure of cast A356 presented in higher magnification showing the distribution of Si particles in the dendrite arms and (b) The x-ray map obtained for Si in the ascast specimen.
58
Figure 59. A rare, large pore in the microstructure. The microstructural evolution of Si eutectic particles with number of FSP passes is presented in Figure 60. It is noteworthy that no pores were observed in the FSP specimens, which is consistent with results reported in the literature [17, 96]. The x-ray maps for Si in Figure 60 show increasing level of homogeneity of Si particles with number of passes. After 1 pass (Figure 60.a), the eutectic region is scattered but Si particles are still clustered. Si particles become less clustered and slightly larger in size after two passes, Figure 60.b. After the third pass, as shown in Figure 60.c, Si particles are more homogeneously distributed and visibly larger. To quantify the change in microstructure with each pass, Si particle sizes were measured via digital image processing. The size distribution of all Si particles was analyzed first by calculating the equivalent diameter, deq. Subsequently, the Si particle size distribution for every condition was determined by hypothesizing that deq follows the lognormal distribution, which is consistent with results reported in the literature [50, 89, 90]. The Anderson-Darling goodness-of-fit tests [107] were conducted to test the hypothesis. That Si particle size distribution is lognormal could not be rejected. 59
(a)
(b)
60
(c)
Figure 60. X-ray maps for Si in the FSP stir zone for (a) 1 pass, (b) 2 passes, and (c) 3 passes.
Parameters of the lognormal distribution were estimated by using the maximum likelihood method. The estimated parameters of the lognormal distributions are presented in Table 5. The probability density functions of deq for the three FSP microstructures in Figure 60 are presented in Figure 61.a. Note that the size distribution shifts right to larger sizes with each pass. The average sizes were 0.38, 0.78 and 1.27 μm for 1 pass, 2 passes and 3 passes, respectively. Hence Si particles coarsened with each FSP pass. This result is in contrast with the results of Baruch et al. [2], who found that Si particles became finer with each pass. To compare the results of the two studies, the probability density functions are presented in Figure 61.b. Note that there is minimal difference between the distributions for 2- and 3-passes. The distinct differences in the results of the two studies can be attributed to the different initial microstructures; the as-cast microstructure in the current study had very fine Si particles, whereas those in the study of Baruch et al. were considerably larger. Alternatively, the contradicting results can be a result of the difference in transverse speeds; Baruch et al. processed their specimens at a transverse speed of 12mm/min, which is much lower than the 61
one used in the present study, 50 mm/min. More research is needed to determine the effect of process parameters and initial microstructure on the final microstructure after FSP. Table 5. Estimated parameters of the lognormal distributions for deq for the three FSP conditions in this study and the one by Baruch et al. [2]. This Study FSP passes 1 2 3
τ
0
0.741 0.775 0.695
Baruch et al
τ
-0.117 -0.451 -0.464
0
0.407 0.436 0.289
-1.052 -0.342 0.195
In all studies on cast Al-Si alloys, it was reported that the microstructure got progressively more homogeneous after each FSP pass. In a recent study on the A356 aluminum alloy, Woertz [83] reported that Si particles moved to “previously unoccupied regions” after FSP and Si particle clusters were dispersed so that their spacing became more uniform. To characterize the level of homogeneity of Si particles, nearest neighbor distances (Lnn) were measured. Similar to Si particle sizes, Lnn for the three microstructures in Figure 60 were found to follow the lognormal distribution. The estimated parameters of the lognormal distributions are presented in Table 6. The probability density functions are presented in Figure 62. The increasing nearest neighboring distance with each pass, evident in Figure 62, is a clear indication that microstructure became more homogeneous with each pass in FSP. This result is in agreement with the findings of Santella et al. [96]. Table 6. Estimated parameter of the lognormal distributions for Lnn for the three FSP conditions in this study. τ FSP passes 1 2 3
0
0.540
-0.166
0.324
0.198
0.433
0.675
62
(a)
(b) Figure 61. Probability density functions of Si particle equivalent diameters after 1, 2 and 3 passes: (a) in this study, and (b) Baruch et al presented again for comparison.
63
Figure 62. Probability density functions of nearest neighbor distance for Si particles in the three FSP microstructures.
7.2. The combined effect of initial metal quality and FSP on tensile deformation characteristics The tensile tests results are listed in Table 7 and the stress strain curves for each condition are presented at Figure 63 for the high quality ingot and Figure 64 for the low quality ingot . The tensile properties, such as yield and tensile strength, and ductility of the As-cast and FSPed materials, were evaluated. For the high quality ingot, the as-cast specimen exhibted 10.9% elongation. After the first pass, the yield and tensile strenght decreased due to the refined and equiaxied grains.The elongation increased significantly from 10.9% to 21%. The reason in the improvement on the ductily can be attributed to: (1) elimination of the casting defects, such as porosity and oxide filmes); (2) breaking of acicular-shaped Al–Si eutectic network in the dendrite arms (3) homogeneous and refined microstructure .
64
After 2 and 3 passes, the samples observed similar yield strength and elongation. It can be concluded that after the first pass, most of the microstrctural defects were eliminated and no further improvement were observed in the sitirring action. Furthermore, the effect of the Si redistribution, presented in section 7.1.2, had no effect on the mechanical properties, where the real improvemente was obteined by defect elimination. For the low quality ingot, the as-cast material exibithed 1% elongatin due to the large amount of defects . After the 1 pass, the elonagtion was further improved and the yield strength decrease, the same result from the high quality ingot. However, the second and third pass further increased the elongation, in contrast of what was observed from the high quality ingot. It can be concluded that the first pass could not eliminate all the structural defect and it took 3 passes to reach similar quality from the high quality ingot.
Figure 63. Engineering stress-strain curves for as-cast and FSPed specimens for A356 Aluminum Alloy from the high quality ingot.
65
Figure 64. Engineering stress-strain plots for tensile tests done on no-FSPed and multiple passes specimens from the low quality ingot. Table 7. Experimental Tensile data for as-cast and FSPed specimens for the two types of ingots.
Quality High Quality Ingot Low Quality Ingot
FSP Passes No FSP 1 pass 2 passes 3 passes No FSP 1 pass 2 passes 3 passes
σy (MPa)
ST (MPa)
eF (%)
RA (%)
QT
121.0 79.5 75.5 77.9 153.7 91.1 78.2 81.9
221.0 153.7 157.0 155.2 175.3 141.4 152.8 154.4
10.9 21.1 24.0 20.9 1.0 5.8 13.0 18.8
24.7 39.5 43.3 39.3 1.0 13.2 31.4 37.7
0.39 0.68 0.78 0.65 0.04 0.19 0.42 0.61
To further evaluate the structural quality of the FSPed specimen, the results from tensile test were evalueted for work hardening rate for both cast alloys in all condition (No-FSP and multiple passes). The results of Kocks-mecking analylsis is presented at Table 8.
66
The Kocks-mecking analylsis for high quality cast ingot is represented at Figure 65, and the FSPed specimens for 1, 2 , and 3 passes are presented at Figure 66, Figure 67 and Figure 68, respectively. Note that in all high quality specimens (as-cast and FSPed), there is a distinct Stage III work hardening region in which Θ decreased linearly with increasing stress, following the Kocks Mecking model. After the FSP, the value of K decreased and elongation increased, providing evidence for the improvement in the structural quality. After additional passes, the however, the values of K remained essentially the same. Hence multiple passes did not provide further improvement in the structural quality when high quality metal was used initially. Also, a clear Stage IV was observed in all FSPed specimens, which is an indication of high structural quality. For the low quality ingot, the no-FSPed specimen was broken in Stage II due to the presence of major structural defects, presented in Figure 69 . After the first pass, the value of K decreased significantly and the specimen work-hardened into first Stage III and then IV. With each pass, the value of K was reduced, indicating the improving of structural quality with number of passes. Table 8. Results of Kock-Mecking analysis for all specimens. Quality High Quality Ingot
Low Quality Ingot
FSP Passes k No FSP 48.5 1 pass 39.9 2 passes 38.8 3 passes 39.9 No FSP 250.0* 1 pass 73.0 2 passes 54.8 3 passes 44.2
*: fracture occurred in Stage II work hardening
θ0 (MPa) 11588 6199 6237 6275 47413* 10298 7819 6805
67
Figure 65. Kocks-Mecking plot for the high quality ingot, no-FSP specimen showing the presence of Stage 3 work hardening.
Figure 66. Kocks-Mecking plot for high quality ingot after 1 pass showing the presence of Stage 4 work hardening.
68
Figure 67. Kocks-Mecking plot for high quality ingot after 2 passes showing the presence of Stage 4 work hardening.
Figure 68. Kocks-Mecking plot for high quality ingot after 3 passes showing the presence of Stage 4 work hardening.
69
Figure 69. Kocks-Mecking plot of low quality ingot for no-FSP specimen.
Figure 70. Kocks-Mecking plot for low quality ingot after 1 pass showing the presence of Stage 4 work hardening.
70
Figure 71. Kocks-Mecking plot for low quality ingot after 2 passes showing the presence of Stage 4 work hardening.
Figure 72. Kocks-Mecking plot for low quality ingot after 3 passes showing the presence of Stage 4 work hardening.
71
The correlation between the KM parameter K and elongation is presented in Figure 73. The equation for the best fitted line is is written as: eF = 102.89ⅇ −0.039𝐾
(12)
This relationship is similar to the one presented in Figure 11. Furthermore, Figure 74 shows that was found to increase with K, consistent with previous findings. The equation for the best fitted line is is written as: 𝜃0 = 119.4𝐾 + 1488
(13)
Figure 73. The change in elongation with KM parameter K.
72
Figure 74. The relationship between the two KM parameters for the FSPed specimens.
7.3. The effect of Si particle size on structural quality As discussed previously, many researchers attributed changes in elongation (or QT) to Si particle size. It was shown in Figure 14 that there were trends between Si particle size and QT in two studies that were opposite of each other. Tensile properties of Baruch et al. were converted to the structural quality index, QT, and are presented versus average Si particle diameter in Figure 76 along with the results from this study. Note that the trend and the best fit curve to the data by Baruch et al. are similar to the relationship reported by Alexopoulos et al. in Figure 13. In contrast, the results of the present study indicate that there is no relationship between the Si particle size and QT in FSPed Al-7%Si alloys. To the author’s knowledge, this is the first time that the absence of a correlation between Si particle size and ductility has been found.
73
Figure 75. The relationship between Si particle size and QT in this study and by Baruch et al.
The contrast with the results of Baruch et al. can be explained as follows; when the initial metal quality is high (such as continuously cast ingot), best structural quality is reached after the first FSP pass, after which additional passes change the microstructure but not the deformation characteristics. When the initial metal quality is low (such as traditional ingot), however, a single pass of FSP is sufficient to close all the pores but not heal or chop all the bifilms in the metal to a size that is negligible. Additional passes provide more healing (chopping) and therefore structural quality improves with every pass. The change in structural quality is not due to the refinement of the microstructure but the elimination of bifilms. Because the QT = 0.05 for the casting that Baruch et al. used, it can be stated that they indeed started with a low quality cast aluminum in their study.
74
7.4. Fractography Fracture surfaces of the tensile tests were evaluated to determine the difference in the fracture behavior of as-cast and FSPed samples. For as-cast samples, crack initiation was usually associated with casting defects. Figure 76 shows the overall fracture surface for the as-cast specimen without reduction area (no necking). Due to the premium quality, no pores could be observed in the fracture surface. Figure 77 shows a brittle fracture for the as-cast specimen in a higher magnification. The crack propagated primarily along the Si rich phase, where the acicular-shaped Al–Si eutectic network provides favorable crack path during deformation, as shown at Figure 78. Moreover, the eutectic pockets are where oxide bifilms are expected to reside [19], as observed by Yousefian [8] who investigated the same ingots in reduced pressure tests. The overall fracture surface after the first pass of FSP is presented in Figure 76, showing a reduction in area due to necking. Figure 80 shows in higher magnification the presence of dimples in the ductile fracture in 1 pass specimen. This fundamental change in the fracture mode, as compared to the as-cast specimen, is due to the elimination of defects (pores and oxide films) and a homogeneous and refined microstructure without a acicular-shaped Al–Si eutectic network inbetween the dendrite arms. It was also noticed a transition zone in the specimen, as presented in Figure 81.
75
Figure 76. Overall fractograph of no-FSP A356 specimen from the high quality ingot with an elongation of 10.9%.
Figure 77. Fracture surface of no-FSP A356 specimen from the high quality ingot.
76
Figure 78. Fracture surface of No-FSP specimen from the high quality ingot showing the fracture along the Si-eutectic phase.
77
Figure 79. Overall fractograph after 1 pass of FSP on A356 sample with elongation of 21.1%
Figure 80. Fracture surface of 1 pass of FSP on high quality A356 sample.
78
Figure 81. Transition zone in 1 pass of FSP in high quality ingot.
Figure 82 and Figure 84 shows the overall fracture for 2 and 3 passes, respectively. The specimens exhibited reduction area due to necking formation. Figure 83 and Figure 85 shows the fracture surface in higher magnification for 2 and 3 passes, respectively. Both specimens exhibited ductile fracture with the presence of dimples, where no further difference in the fracture mode was observed.
79
Figure 82. Overall fractograph after 2 pass of FSP on high quality A356 sample with elongation of 24%.
Figure 83. Fracture surface of 2 passes of FSP on high quality A356 sample.
80
Figure 84. Overall fractograph after 3 pass of FSP on high quality A356 sample with elongation of 20.9%
Figure 85. Fracture surface of 3 passes of FSP on high quality A356 sample.
81
For the low quality ingot of cast A356, the defect density in material was much higher than in the continuously cast ingot. The fracture surface of the as-cast tensile specimen of low quality A356 alloy is presented in Figure 86. Several structural defects are visible across the specimen. A closer view of the fracture surface is presented in Figure 87, where the acicularshaped Al–Si eutectic network with pores provides favorable crack path during deformation. Figure 88 shows an exposed pore with dendrite arms, with a tortuous shape, similar to the pore presented in Figure 2. Figure 89 shows the overall fracture after 1 pass of FSP. It was noticed that the specimen necked during the tensile test. Figure 90 shows the fracture surface in a higher magnification, where ductile fracture shows the presence of dimples. The change in fracture type from faceted to ductile is mainly caused be defect elimination, i.e, pores and oxide films. Figure 91 and Figure 93 shows the overall fracture after 2 and 3 passes of FSP, respectively. Both specimens exhibited reduction in area due to necking. Figure 92 and Figure 94 shows the ductile fracture in higher magnification, showing the presence of dimples. Moreover, the overall size of the dimples seems to decrease with increasing number of passes seems to decrease with increasing number of passes, which should be examined further, and will be discussed in more detail in future work. A preliminary analysis of the fracture surfaces with limited sampling was conducted to determine whether there are correlations between average dimple sizes and ductility. The details and the results of this preliminary analysis are presented in Appendix B. Much larger sampling is needed to verify the strong correlations observed.
82
Figure 86. Overall fractograph of no-FSP A356 sample with elongation of 1%.
Figure 87. Fracture surface of no-FSP low quality A356 specimen showing a faceted fracture.
83
Figure 88. Presence of large pores on the fracture surface for low quality no-FSP specimen.
84
Figure 89. Overall fractograph after 1 pass of FSP on low quality A356 sample with an elongation of 5.8%.
Figure 90. Fracture surface of 1 pass of FSP on low quality A356 sample.
85
Figure 91. Overall fractograph after 2 passes of FSP on low quality A356 sample with an elongation of 13%.
Figure 92. Fracture surface of 2 passes of FSP on low quality A356 sample.
86
Figure 93. Overall fractograph after 3 passes of FSP on low quality A356 sample with an elongation of 18.8%.
Figure 94. Fracture surface of 3 passes of FSP on low quality A356 sample.
87
8. Conclusions Research question 1: What are the effects of process parameters on the microstructural evolution in cast Al-Si-Mg alloys? •
Analysis of the data collected from the literature on various cast Al-Si-Mg alloys showed that FSP reduced the size of Si eutectic particles. However, the degree of refinement was based on the combination of process parameters, specifically rotational speed and transverse speed.
Research question 2: What are the tool wear characteristics during FSP of aluminum alloys?What is the hardness profile after FSP? •
Tool wear in FSP of 6061-T6 extrusions was found to have two distinct phases. In Phase I, tool wear is rapid due to fracture of threads of the pin followed a more gradual wear rate in Phase II, in which built-up layers are found in between threads. No steady-state or self-optimization point was observed.
•
In the microhardness profile away from the tool, four distinct zones, namely DXZ, TMAZ, HAZ and BM, were visible. Microhardness was lowest in the DXZ and increased continuously until it reached its highest point in BM. This hardness profile was different from those reported in the literature for FSPed 6061-T6.
•
Despite the tool wear by fracture of threads as observed in metallographs, the hardness profile was similar to that reported for of FSW of 6061+Al2O3 for no tool wear.
88
Research question 3: How does FSP affect the size distribution of Fe-containing constituent particles in Al alloys? •
In the microstructure of 6061-T6 extrusions, there are two distinct size distributions for Fe-containing constituent particles; large particles on grain boundaries, and much finer particles within the matrix. FSP was found to break up the large particles and refine them to the size of the initial smaller particles within the matrix.
Research question 4: What is the effect of multiple FSP passes on Si particle size distribution and homogeneity of the microstructure? •
Results in the literature showed that Si particles got progressively more refined with increasing number of passes during FSP.
•
In the present study, however, Si particles coarsened with each pass during FSP in high quality cast A356. This finding was in contrast with the results reported previously in the literature.
•
The nearest neighboring distance measurements of Si particles showed that multiple passes in FSP increased the homogeneity of the microstructures.
Research question 5: What is the effect of initial structure quality on the effectiveness of FSP? •
The effectiveness of FSP in eliminating defects was found to depend on the initial quality of the metal. Tensile results showed that in the high quality ingot, a single FSP pass was sufficient to eliminate the structural defects. In contrast, multiple passes were necessary on the low quality ingot to eliminate structural defects.
89
Research question 6: What is the relationship between Si particle size and ductility after FSP has eliminated all casting defects? •
In this study, it was determined that Si particles size had no effect on the ductility of FSPed high quality A356 casting. This is in contrast with previous studies which showed a correlation between Si particle size and ductility obtained after FSP. This difference was attributed to the low quality metal used in previous studies.
•
To the author’s knowledge, this is the first time that the absence of a correlation between Si particle size and ductility has been found.
90
9. Future work •
In the present study, the highest structural quality QT was found to be approximately 0.70. In the analysis of data from the literature, QT was found to exceed 1.0 in some studies. In order to reach the same level of quality index, the process to be improved and optimized, including the type and geometry of the FSP tool.
•
Once the optimum parameters that yield QT values at or above 1.0 are reached, FSP can be used as a cleansing process to rid the metal from pores and bifilms. After the FSP, samples can be remelted and/or heat treated to obtain various microstructures so that the real microstructure-property relationships can be finally determined for cast aluminum alloys.
•
There is potentially a correlation between void (dimple) sizes on fracture surfaces and ductility, as demonstrated in a preliminary study with limited sampling in Appendix B. Larger samples of fracture surfaces will help verify this correlation.
91
References [1] [2]
[3] [4] [5] [6] [7] [8] [9] [10] [11] [12] [13] [14] [15] [16]
J. R. Davis, Alloying: Understanding the Basics: A S M International, 2001. L. John Baruch, R. Raju, V. Balasubramanian, A. G. Rao, and I. Dinaharan, "Influence of Multi-pass Friction Stir Processing on Microstructure and Mechanical Properties of Die Cast Al–7Si–3Cu Aluminum Alloy," Acta Metallurgica Sinica (English Letters), vol. 29, pp. 431-440, 2016. S. A. Alidokht, A. Abdollah-zadeh, S. Soleymani, T. Saeid, and H. Assadi, "Evaluation of microstructure and wear behavior of friction stir processed cast aluminum alloy," Materials Characterization, vol. 63, pp. 90-97, 2012. J. T. Staley Jr, M. Tiryakioğlu, and J. Campbell, "The effect of hot isostatic pressing (HIP) on the fatigue life of A206-T71 aluminum castings," Materials Science and Engineering: A, vol. 465, pp. 136-145, 9/15/ 2007. J. T. Staley Jr, M. Tiryakioğlu, and J. Campbell, "The effect of increased HIP temperatures on bifilms and tensile properties of A206-T71 aluminum castings," Materials Science and Engineering: A, vol. 460–461, pp. 324-334, 7/15/ 2007. D. G. E. L. Katgerman, "In Search of Prediction of Hot Cracking in Aluminium Alloys," in Hot Cracking Phenomena in Welds II, H. H. Thomas Bollinghaus, Carl E. Cross, John C. Lippold, Ed., ed Berlin: Springer, 2008, pp. 3-18. A. Nazarboland and R. Elliott, "The effect of intrinsic casting defects on the mechanical properties of austempered, alloyed ductile iron," International Journal of Cast Metals Research, vol. 10, pp. 87-97, 1997/09/01 1997. P. Yousefian, "Pore Formation in Aluminum Castings: Theoretical Calculations and the Extrinsic Effect of Entrained Surface Oxide Films," M.Sc. Thesis, Mechanical Engineering, University of North Florida, 2017. J. Staley, "Microstructure and toughness of high-strength aluminum alloys," in Properties related to fracture toughness, ed: ASTM International, 1976. M. Tiryakioglu and J. T. Staley, "Physical metallurgy and the effect of alloying additions in aluminum alloys," Handbook of Aluminum: Physical Metallurgy and Processes, vol. 1, pp. 81-209, 2003. R. S. Mishra and Z. Y. Ma, "Friction stir welding and processing," Materials Science and Engineering: R: Reports, vol. 50, pp. 1-78, 2005/08/31/ 2005. S. Jana, R. S. Mishra, and G. Grant, Friction Stir Casting Modification for Enhanced Structural Efficiency: A Volume in the Friction Stir Welding and Processing Book Series: Butterworth-Heinemann, 2015. R. S. Mishra, M. Mahoney, S. McFadden, N. Mara, and A. Mukherjee, "High strain rate superplasticity in a friction stir processed 7075 Al alloy," Scripta Materialia, vol. 42, pp. 163-168, 1999. R. S. Mishra and M. W. Mahoney, "Friction stir processing: a new grain refinement technique to achieve high strain rate superplasticity in commercial alloys," in Materials Science Forum, 2001, pp. 507-514. Z. Y. Ma, S. R. Sharma, and R. S. Mishra, "Effect of friction stir processing on the microstructure of cast A356 aluminum," Materials Science and Engineering: A, vol. 433, pp. 269-278, 2006. Z. Y. Ma, S. R. Sharma, and R. S. Mishra, "Microstructural modification of as-cast Al-Si-Mg alloy by friction stir processing," Metallurgical and Materials Transactions A, vol. 37, pp. 3323-3336, 2006.
92
[17] [18] [19] [20] [21] [22] [23] [24] [25] [26] [27] [28] [29] [30] [31]
[32] [33]
N. Sun and D. Apelian, "Defect Elimination in Cast Al Components via Friction Stir Processing," in TMS 2012 141st Annual Meeting and Exhibition, Materials Properties, Characterization, and Modeling, 2012, p. 411. S. R. Sharma, Z. Y. Ma, and R. S. Mishra, "Effect of friction stir processing on fatigue behavior of A356 alloy," Scripta Materialia, vol. 51, pp. 237-241, 2004/08/01/ 2004. J. Campbell, "Entrainment defects," Materials Science and Technology, vol. 22, pp. 127-145, 2006. M. Tiryakioğlu, J. Campbell, and J. T. Staley, "Evaluating structural integrity of cast Al–7% Si–Mg alloys via work hardening characteristics," Materials Science and Engineering: A, vol. 368, pp. 205-211, 2004. M. Tiryakioğlu, "On estimating the fracture stress and elongation of Al–7%Si– 0.3%Mg alloy castings with single pores," Materials Science and Engineering A, vol. 527, pp. 4546-4549, 7/15/ 2010. Q. G. Wang, D. Apelian, and D. A. Lados, "Fatigue behavior of A356-T6 aluminum cast alloys. Part I. Effect of casting defects," Journal of Light Metals, vol. 1, pp. 7384, 2// 2001. C. Nyahumwa, N. Green, and J. Campbell, "Effect of Mold-Filling Turbulence on Fatigue Properties of Cast Aluminum Alloys (98-58)," Transactions of the American Foundrymen's Society, vol. 106, pp. 215-223, 1998. M. Tiryakioğlu, J. Campbell, and C. Nyahumwa, "Fracture surface facets and fatigue life potential of castings," Metallurgical and Materials Transactions B, vol. 42, pp. 1098-1103, 2011. C. Nyahumwa, N. R. Green, and J. Campbell, "Influence of casting technique and hot isostatic pressing on the fatigue of an Al-7Si-Mg alloy," Metallurgical and Materials Transactions A, vol. 32, pp. 349-358, 2001. J. Campbell, Complete Casting Handbook: Metal Casting Processes, Metallurgy, Techniques and Design: Elsevier Butterworth-Heinemann, 2011. N. R. Green and J. Campbell, "Statistical distributions of fracture strengths of cast Al7Si-Mg alloy," Materials Science and Engineering: A, vol. 173, pp. 261-266, 1993/12/20 1993. M. Divandari, "Mechanism of Bubble Damage in Castings," PhD, School of Metallurgy and Materials, University of Birmingham, Birmingham, UK, 1999. X. Cao and J. Campbell, "The nucleation of Fe-rich phases on oxide films in Al-11.5 Si-0.4 Mg cast alloys," Metallurgical and Materials Transactions A, vol. 34, pp. 1409-1420, 2003. X. Cao and J. Campbell, "The solidification characteristics of Fe-rich intermetallics in Al-11.5Si-0.4Mg cast alloys," Metallurgical and Materials Transactions A, vol. 35, pp. 1425-1435, 2004. X. Cao, N. Saunders, and J. Campbell, "Effect of iron and manganese contents on convection-free precipitation and sedimentation of primary α-Al(FeMn)Si phase in liquid Al-11.5Si-0.4Mg alloy," Journal of Materials Science, vol. 39, pp. 2303-2314, 2004. D. N. Miller, L. Lu, and A. K. Dahle, "The role of oxides in the formation of primary iron intermetallics in an Al-11.6Si-0.37Mg alloy," Metallurgical and Materials Transactions B, vol. 37, pp. 873-878, 2006. L. Liu, A. Samuel, F. Samuel, H. Doty, and S. Valtierra, "Influence of oxides on porosity formation in Sr-treated Al-Si casting alloys," Journal of materials science, vol. 38, pp. 1255-1267, 2003. 93
[34] [35] [36] [37] [38] [39] [40] [41] [42] [43] [44] [45] [46] [47] [48] [49] [50]
[51]
E. DeBartolo and B. Hillberry, "A model of initial flaw sizes in aluminum alloys," International Journal of Fatigue, vol. 23, pp. 79-86, 2001. A. D. Rollett and U. Kocks, "A review of the stages of work hardening," in Solid State Phenomena, 1993, pp. 1-18. M. Tiryakioğlu and N. D. Alexopoulos, "The Effect of Artificial Aging on Tensile Work Hardening Characteristics of a Cast Al-7 Pct Si-0.55 Pct Mg (A357) Alloy," Metallurgical and Materials Transactions A, vol. 39, pp. 2772-2780, 2008. U. Kocks, "Laws for work-hardening and low-temperature creep," Journal of engineering materials and technology, vol. 98, pp. 76-85, 1976. H. Mecking and U. Kocks, "Kinetics of flow and strain-hardening," Acta Metallurgica, vol. 29, pp. 1865-1875, 1981. U. Kocks and H. Mecking, "Physics and phenomenology of strain hardening: the FCC case," Progress in materials science, vol. 48, pp. 171-273, 2003. M. Tiryakioğlu, J. T. Staley, and J. Campbell, "Evaluating structural integrity of cast Al–7% Si–Mg alloys via work hardening characteristics: II. A new quality index," Materials Science and Engineering: A, vol. 368, pp. 231-238, 2004. M. Tiryakioǧlu, J. Campbell, and J. T. Staley, "The influence of structural integrity on the tensile deformation of cast Al–7wt.%Si–0.6wt.%Mg alloys," Scripta Materialia, vol. 49, pp. 873-878, 2003. M. Tiryakioğlu, J. T. Staley, and J. Campbell, "The effect of structural integrity on the tensile deformation characteristics of A206-T71 alloy castings," Materials Science and Engineering: A, vol. 487, pp. 383-387, 2008. G. Eisaabadi B, M. Tiryakioğlu, P. Davami, S.-K. Kim, Y. O. Yoon, G.-Y. Yeom, et al., "The effect of remelting on the melt and casting quality in Al–7%Si–Mg castings," Materials Science and Engineering: A, vol. 605, pp. 203-209, 2014. A. Gangulee and J. Gurland, "ON THE FRACTURE OF SILICON PARTICLES IN ALUMINUM- SILICON ALLOYS," AIME MET SOC TRANS, vol. 239, pp. 269-272, 1967. Q. G. Wang, "Microstructural effects on the tensile and fracture behavior of aluminum casting alloys A356/357," Metallurgical and Materials Transactions A, vol. 34, pp. 2887-2899, 2003/12/01 2003. M. Kiser, F. Zok, and D. Wilkinson, "Plastic flow and fracture of a particulate metal matrix composite," Acta materialia, vol. 44, pp. 3465-3476, 1996. G. Guiglionda and W. J. Poole, "The role of damage on the deformation and fracture of Al–Si eutectic alloys," Materials Science and Engineering: A, vol. 336, pp. 159169, 2002/10/25/ 2002. C. Caceres and J. Griffiths, "Damage by the cracking of silicon particles in an Al-7Si0.4 Mg casting alloy," Acta materialia, vol. 44, pp. 25-33, 1996. D. L. Zhang, L. H. Zheng, and D. H. StJohn, "Effect of solution treatment temperature on tensile properties of AI-7Si-O.3Mg (wt-%) alloy," Materials Science and Technology, vol. 14, pp. 619-625, 2013. N. D. Alexopoulos, M. Tiryakioğlu, A. N. Vasilakos, and S. K. Kourkoulis, "The effect of Cu, Ag, Sm and Sr additions on the statistical distributions of Si particles and tensile properties in A357–T6 alloy castings," Materials Science and Engineering: A, vol. 604, pp. 40-45, 2014. G. Eisaabadi B, G. Y. Yeom, M. Tiryakioğlu, N. Netto, R. Beygi, M. Z. Mehrizi, et al., "The effect of solution treatment time on the microstructure and ductility of naturally-aged A383 alloy die castings," Materials Science and Engineering: A, vol. 722, pp. 1-7, 2018/04/11/ 2018. 94
[52] [53] [54] [55] [56] [57] [58] [59] [60] [61] [62] [63] [64] [65] [66]
[67] [68] [69] [70] [71]
J. R. Rice and D. M. Tracey, "On the ductile enlargement of voids in triaxial stress fields," Journal of the Mechanics and Physics of Solids, vol. 17, pp. 201-217, 1969/06/01/ 1969. D. Broek, "The role of inclusions in ductile fracture and fracture toughness," Engineering Fracture Mechanics, vol. 5, pp. 55-66, 1973/02/01/ 1973. A. Argon, J. Im, and R. Safoglu, "Cavity formation from inclusions in ductile fracture," Metallurgical Transactions A, vol. 6, p. 825, 1975. G. Le Roy, J. D. Embury, G. Edwards, and M. F. Ashby, "A model of ductile fracture based on the nucleation and growth of voids," Acta Metallurgica, vol. 29, pp. 15091522, 1981/08/01/ 1981. A. A. Benzerga, J. Besson, and A. Pineau, "Anisotropic ductile fracture: Part I: experiments," Acta Materialia, vol. 52, pp. 4623-4638, 2004/09/06/ 2004. A. Das, S. Sivaprasad, P. C. Chakraborti, and S. Tarafder, "Correspondence of fracture surface features with mechanical properties in 304LN stainless steel," Materials Science and Engineering: A, vol. 496, pp. 98-105, 2008/11/25/ 2008. M. Tiryakioglu, "Personal communication," ed, 2017. J. Campbell, Castings: Butterworth-Heinemann, 1993. M. Tiryakioğlu, J. Campbell, and J. T. Staley, "Evaluating structural integrity of cast Al–7% Si–Mg alloys via work hardening characteristics: 1. Concept of target properties," Materials Science and Engineering: A, vol. 368, pp. 205-211, 3/15/ 2004. M. Tiryakioğlu, J. Campbell, and N. D. Alexopoulos, "Quality indices for aluminum alloy castings: A critical review," Metallurgical and Materials Transactions B, vol. 40, pp. 802-811, 2009. G. Eisaabadi B, P. Davami, S. K. Kim, and M. Tiryakioğlu, "The effect of melt quality and filtering on the Weibull distributions of tensile properties in Al–7%Si–Mg alloy castings," Materials Science and Engineering: A, vol. 579, pp. 64-70, 2013. J. A. Francis and G. M. D. Cantin, "The role of defects in the fracture of an Al–Si–Mg cast alloy," Materials Science and Engineering: A, vol. 407, pp. 322-329, 2005/10/25/ 2005. D. McLellan, "Tensile Properties of A357-T6 Aluminum Castings," Journal of Testing and Evaluation, vol. 8, pp. 170-176, 1980. T. H. Courtney, Mechanical behavior of materials: Waveland Press, 2005. N. D. Alexopoulos and M. Tiryakioglu, "Relationship between Fracture Toughness and Tensile Properties of A357 Cast Aluminum Alloy," Metallurgical and Materials Transactions a-Physical Metallurgy and Materials Science, vol. 40a, pp. 702-716, Mar 2009. M. Tiryakioğlu and J. Campbell, "Quality index for aluminum alloy castings," International Journal of Metalcasting, vol. 8, pp. 39-42, 2014. M. Tiryakioğlu, J. Campbell, and N. D. Alexopoulos, "On the ductility of cast Al-7 pct Si-Mg alloys," Metallurgical and Materials Transactions A, vol. 40, pp. 10001007, 2009. M. Tiryakioglu and J. Campbell, "Ductility, structural quality, and fracture toughness of Al–Cu–Mg–Ag (A201) alloy castings," Materials Science and Technology, vol. 25, pp. 784-789, 2009. M. Tiryakioğlu, J. Campbell, and N. D. Alexopoulos, "On the ductility potential of cast Al–Cu–Mg (206) alloys," Materials Science and Engineering: A, vol. 506, pp. 23-26, 2009. M. Tiryakioglu, J. Campbell, and N. D. Alexopoulos, "Quality Indices for Aluminum Alloy Castings: A Critical Review," Metallurgical and Materials Transactions B, vol. 40, pp. 802-811, 2009. 95
[72] [73] [74] [75] [76] [77] [78] [79] [80] [81] [82] [83] [84] [85]
[86] [87]
[88]
[89] [90]
A. Simar, "Friction stir processing for arquitectured materials," ed: Not published, 2017. M. S. WĘGLOWSKI, P. SĘDEK, and C. HAMILTON, "The effect of process parameters on residual stress in a friction stir processed cast aluminium alloy AlSi9Mg," Engineering Transactions, vol. 64, pp. 301-309, 2016. M. Mahoney, C. Rhodes, J. Flintoff, W. Bingel, and R. Spurling, "Properties of friction-stir-welded 7075 T651 aluminum," Metallurgical and materials transactions A, vol. 29, pp. 1955-1964, 1998. Z. Y. Ma, "Friction Stir Processing Technology: A Review," Metallurgical and Materials Transactions A, vol. 39, pp. 642-658, 2008. M. T. N. Netto, in course of publication, 2017. E. Rincon, H. F. Lopez, M. M. Cisneros, and H. Mancha, "Temperature effects on the tensile properties of cast and heat treated aluminum alloy A319," Materials Science and Engineering: A, vol. 519, pp. 128-140, 2009. N. Netto, M. Tiryakioğlu, and P. D. Eason, "On Si Redistribution During Friction Stir Processing of Cast Al-7%Si–0.4%Mg Alloys," Cham, 2018, pp. 417-422. N. Sun and D. Apelian, "Friction stir processing of aluminum cast alloys for high performance applications," JOM, vol. 63, pp. 44-50, November 01 2011. O. S. Salih, H. Ou, W. Sun, and D. G. McCartney, "A review of friction stir welding of aluminium matrix composites," Materials & Design, vol. 86, pp. 61-71, 2015. S. Sharma and R. Mishra, "Fatigue crack growth behavior of friction stir processed aluminum alloy," Scripta Materialia, vol. 59, pp. 395-398, 2008. M. T. N. Netto, P. D. Eason, "Title," unpublished|. J. C. Woertz, "Redistribution mechanisms and quantification of homogeneity in friction stir welding and processing of an aluminum silicon alloy," NAVAL POSTGRADUATE SCHOOL MONTEREY CA2012. Z. Y. Ma, S. R. Sharma, and R. S. Mishra, "Effect of multiple-pass friction stir processing on microstructure and tensile properties of a cast aluminum–silicon alloy," Scripta Materialia, vol. 54, pp. 1623-1626, 2006. T. S. Mahmoud, A. M. Gaafer, and T. A. Khalifa, "Effect of tool rotational and welding speeds on microstructural and mechanical characteristics of friction stir welded A319 cast Al alloy," Materials Science and Technology, vol. 24, pp. 553-559, 2013. T. S. Mahmoud, O. M. Shaban, H. M. Zakaria, and T. A. Khalifa, "On effect of FSP on microstructural and mechanical characteristics of A390 hypereutectic Al–Si alloy," Materials Science and Technology, vol. 26, pp. 1120-1124, 2013. W. Woo, H. Choo, D. W. Brown, and Z. Feng, "Influence of the Tool Pin and Shoulder on Microstructure and Natural Aging Kinetics in a Friction-Stir-Processed 6061–T6 Aluminum Alloy," Metallurgical and Materials Transactions A, vol. 38, pp. 69-76, 2007. S. Malopheyev, I. Vysotskiy, V. Kulitskiy, S. Mironov, and R. Kaibyshev, "Optimization of processing-microstructure-properties relationship in friction-stir welded 6061-T6 aluminum alloy," Materials Science and Engineering: A, vol. 662, pp. 136-143, 2016/04/26/ 2016. F. Rhines and M. Aballe, "Growth of silicon particles in an aluminum matrix," Metallurgical and Materials Transactions A, vol. 17, pp. 2139-2152, 1986. M. Tiryakioğlu, "Si particle size and aspect ratio distributions in an Al–7%Si– 0.6%Mg alloy during solution treatment," Materials Science and Engineering: A, vol. 473, pp. 1-6, 2008. 96
[91] [92]
[93] [94] [95] [96] [97] [98] [99] [100] [101] [102]
[103] [104]
[105] [106] [107]
R. A. Prado, L. E. Murr, D. J. Shindo, and K. F. Soto, "Tool wear in the friction-stir welding of aluminum alloy 6061+20% Al2O3: a preliminary study," Scripta Materialia, vol. 45, pp. 75-80, 2001. W. M. Zeng, H. L. Wu, and J. Zhang, "EFFECT OF TOOL WEAR ON MICROSTRUCTURE, MECHANICAL PROPERTIES AND ACOUSTIC EMISSION OF FRICTION STIR WELDED 6061 Al ALLOY," Acta Metallurgica Sinica (English Letters), vol. 19, pp. 9-19, 2006. R. A. Prado, L. E. Murr, K. F. Soto, and J. C. McClure, "Self-optimization in tool wear for friction-stir welding of Al 6061+20% Al2O3 MMC," Materials Science and Engineering: A, vol. 349, pp. 156-165, 2003. M. Tiryakioğlu, "On the relationship between statistical distributions of defect size and fatigue life in 7050-T7451 thick plate and A356-T6 castings," Materials Science and Engineering: A, vol. 520, pp. 114-120, 2009. M. Tiryakioğlu, "Relationship between Defect Size and Fatigue Life Distributions in Al-7 Pct Si-Mg Alloy Castings," Metallurgical and Materials Transactions A, vol. 40, pp. 1623-1630, 2009. M. L. Santella, T. Engstrom, D. Storjohann, and T. Y. Pan, "Effects of friction stir processing on mechanical properties of the cast aluminum alloys A319 and A356," Scripta Materialia, vol. 53, pp. 201-206, 2005. R. Kapoor, V. S. H. Rao, R. S. Mishra, J. A. Baumann, and G. Grant, "Probabilistic fatigue life prediction model for alloys with defects: Applied to A206," Acta Materialia, vol. 59, pp. 3447-3462, 2011. Z. Ma, S. Sharma, and R. Mishra, "Microstructural modification of as-cast Al-Si-Mg alloy by friction stir processing," Metallurgical and Materials Transactions A, vol. 37, pp. 3323-3336, 2006. Z. Y. Ma, S. R. Sharma, and R. S. Mishra, "Effect of friction stir processing on the microstructure of cast A356 aluminum," Materials Science and Engineering: A, vol. 433, pp. 269-278, 2006/10/15/ 2006. F. Rhines and B. Patterson, "Effect of the degree of prior cold work on the grain volume distribution and the rate of grain growth of recrystallized aluminum," Metallurgical and Materials Transactions A, vol. 13, pp. 985-993, 1982. L. Karthikeyan, V. Senthilkumar, and K. Padmanabhan, "On the role of process variables in the friction stir processing of cast aluminum A319 alloy," Materials & Design, vol. 31, pp. 761-771, 2010. S. Jana, R. S. Mishra, J. A. Baumann, and G. J. Grant, "Effect of Friction Stir Processing on Microstructure and Tensile Properties of an Investment Cast Al-7Si0.6Mg Alloy," Metallurgical and Materials Transactions A, vol. 41, pp. 2507-2521, 2010. F. W. Taylor, On the Art of Cutting Metals: American society of mechanical engineers, 1907. S. K. Singh, R. J. Immanuel, S. Babu, S. K. Panigrahi, and G. D. Janaki Ram, "Influence of multi-pass friction stir processing on wear behaviour and machinability of an Al-Si hypoeutectic A356 alloy," Journal of Materials Processing Technology, vol. 236, pp. 252-262, 2016. M. C. Shaw, Metal Cutting Principles: Clarendon Press, 1996. M. Tiryakioğlu, "Weibull Analysis of Mechanical Data for Castings II: Weibull Mixtures and Their Interpretation," Metallurgical and Materials Transactions A, vol. 46, pp. 270-280, 2015. T. W. Anderson and D. A. Darling, "A Test of Goodness of Fit," Journal of the American Statistical Association, vol. 49, pp. 765-769, 1954/12/01 1954. 97
[108] G. Padmanaban and V. Balasubramanian, "Selection of FSW tool pin profile, shoulder diameter and material for joining AZ31B magnesium alloy – An experimental approach," Materials & Design, vol. 30, pp. 2647-2656, 2009. [109] Y. Uematsu, K. Tokaji, Y. Tozaki, H. Shibata, K. Fujiwara, and T. Murayama, "Effect of friction stir processing on the fatigue behaviour of cast aluminium alloy," in ICF12, Ottawa 2009, 2013. [110] H. Dvorak and E. Schwegtier, "Statistical distribution of flaw sizes," International Journal of Fracture Mechanics, vol. 8, pp. 110-111, 1972. [111] M. Tiryakioğlu, "Pore size distributions in AM50 Mg alloy die castings," Materials Science and Engineering: A, vol. 465, pp. 287-289, 2007. [112] M. Tiryakioğlu, "On fatigue life variability in cast Al–10% Si–Mg alloys," Materials Science and Engineering: A, vol. 527, pp. 1560-1564, 2010. [113] M. Uludağ, R. Çetin, D. Dişpinar, and M. Tiryakioğlu, "On the Interpretation of Melt Quality Assessment of A356 Aluminum Alloy by the Reduced Pressure Test: The Bifilm Index and Its Physical Meaning," International Journal of Metalcasting, March 01 2018. [114] M. Uludağ, R. Çetin, D. Dispinar, and M. Tiryakioğlu, "Characterization of the Effect of Melt Treatments on Melt Quality in Al-7wt %Si-Mg Alloys," Metals, vol. 7, p. 157, 2017.
98
Appendix A: Preliminary Investigation FSP tool is a very important and critical parameter of the process. As described on the item 2.1, the tool geometry is composed of a pin and shoulder. The literature [108] reported the optimum geometry of the FSP tool, that generates adequate heat to avoid the structural defects defects. A tool geometry with shoulder of 18 mm, pin of 6 mm and 5 mm length was found to be the optimum parameter, with defect free in the processed zone [108]. In order to compare this study with the literature, the same geometry was used inthis work. Furthermore, the tool was made of H-13 tool steel, M6x1 threaded to increase the flow of materials around the tool during the process and tilted in 3 deg to increase the forging action [109]. Due to machine limitations, the maximum rotational and transverse speed that the milling machine could run the FSP process was 1000 rpm and 100mm/min, respectively. FSP was conducted twice on this combination of process parameter and a -ct scan was conducted on a Shimadzu inspeXio SMX-225CT Microfocus X-Ray CT System, to evaluate the internal defects. This combination of process parameters generated a common defect on FSP called tunnel defect, caused by improper material flow and lack of heat and consolidation of metal in the FSP region [75].
Figure 95. μ-CT scan on the specimen showing the tunnel defect due to process parameters with ω=1000 rpm and vt=100mm/min
99
After a several trials adjusting the rotational and transversal speeds, the optimum process parameters were set in =700 rpm and vt =50mm/min. A -ct scan shows the reduction in the defects on the processed zone.
Figure 96. μ-CT scan on the specimen showing the reduction in the defects density due to the process parameters of ω=700 rpm and vt=50mm/min
100
Appendix B: Preliminary quantitative analysis of fracture surfaces In a recent study on the deformation characteristics of 304LN stainless steel, Das et al. [57] investigated the effect of strain rate on the tensile properties as well as void formation. They analyzed the dimples on fracture surfaces to determine how the void size distribution changes with strain rate. Their results are shown in Figure 97, which shows that void size distribution is affected by the strain rate. To the author’s knowledge, the statistical distribution for void sizes on fracture surfaces has not been reported before. Pore size distributions in castings should theoretically be lognormal [110] as supported by observations in Mg [111] and Al [112-114] alloy castings. Because the void size distributions in Figure 98 are positively skewed, it can be hypothesized that void size distribution is also lognormal. Das et al. [57] also investigated any possible relationship between void size and ductility, including elongation and reduction in area, Figure 98. Note that there is an apparent correlation between void size on fracture surface and ductility; with decreasing void size, ductility is increased, .
Figure 97. Distribution of void size on the fracture surface of 304LN stainless steel [57].
101
Figure 98. The correlation between average void size and ductility [57].
Fractographs were analyzed by digital image processing software ImageJ to determine the sizes of dimples also refereed as void in the literature. Since the fracture of no-FSP specimens did not showed dimples, they were excluded from the analysis. Based on the results presented earlier in section 7.1.4, it was hypothesized that the void size distribution followed lognormal distribution. The results of the digital image processing were analyzed statically by using Minitab software. A sample histogram and the fitted 3 parameter lognormal distribution are presented in Figure 99. Note that the lognormal distribution provided excellent fit to the data. The same observation was made for all fracture surfaces analysis. The estimated parameters of the lognormal distributions for the six fracture surfaces are given in Table 9.
102
Histogram of 3 Pass LQ 3-Parameter Lognormal 700
Loc 0.4123 Scale 0.7983 Thresh 0.6400 N 2581
600
Frequency
500 400 300 200 100 0
0
3
6
9
12
15
3 Pass LQ
Figure 99. Histogram of the data for the 3 passes of FSP in a high quality ingot, showing also the fitted 3 parameter lognormal distribution.
103
Table 9. Estimated parameters of the lognormal distributions of the voids on six fracture surfaces as well as sample size (n) and estimated population average, d̅V . High quality ingot Low Quality ingot
FSP passes 1 pass 2 passes 3 passes 1 pass 2 passes 3 passes
τ (μm) 0.610 0.452 0.441 0.771 0.795 0.640
μ -0.207 -0.221 -0.253 0.184 -0.045 0.412
σ 1.179 1.180 1.073 1.406 1.257 0.798
n 4125 4505 5964 1147 2300 2582
̅ V (μm) d
2.24 2.06 1.82 4.00 2.90 2.72
As observed in 304 stainless steel, there is a correlation between average void diameter and ductility. Increasing the number of passes for the low quality material, the size of the dimples decreased as the ductility increased.
(a)
104
(b)
(c) Figure 100. The relationships between average void diameter and ductility of the specimens: (a) elongation,(b) reduction in area, and (c) quality index.
105
The best fit lines in Figure 100.a, b and c are: ⅇ𝐹 = 38.5 − 8.1𝑑̅𝑉
(14)
𝑅𝐴 = 68.5 − 13.1𝑑̅𝑉
(15)
𝑄𝑇 = 1.22 − 0.25𝑑̅𝑉
(16)
respectively. To the author’s knowledge, this is the first time that correlations between ductility and void sizes on fracture surfaces of cast aluminum alloys were reported. As indicated previously, the Si particles coarsened and became more homogenelously dispersed with increased number of FSP passes in the current study. If there were a relationship between Si particle size and average void size, vois would be expected to become larger with coarser Si particles, which is the opposite of what was observed in the current study. Therefore, Si particle size can be ruled out as a determining factor of void sizes on fracture surfaces. The average nearest-neighbor distance-average void size correlation is presented in Figure 109, along with the best fit line. The increased homogeneity of the microstructure with each FSP pass has potentially an effect on the reduced void size. However, an increase nearestneighbor distance would mean increased void size, if all voids were initiated at Si particles. This is opposite of the correlation shown in Figure 109. Therefore, another variable seems to be affecting the size of the voids. It is the author’s opinion that void size is determined by the size and distribution of remainders of few oxide bifilms in the structure, that become finer with each pass. More reserach is needed to prove this point.
106
Figure 101. The correlation between average void size and average nearest-neighbor distance.
107
108
Vita I was born in Brazil and I earned my Bachelor’s degree in Naval Mechanical Engineering at the Federal University of Rio Grande, Brazil in 2016. I first came to the University of North Florida on my exchange program, Science Without Borders, when I was an undergraduate student from August 2014 to December 2015. In 2017, I started the graduate program in Mechanical Engineering at the University of North Florida. During this program, I have worked as a teaching and laboratory assistant, and as a physics tutor. My accomplishments from my present work include four papers (listed below) and an oral presentation at TMS Annual Meeting 2018. 1. N. Netto, M.Tiryakioglu, P. D. Eason, “On the Si redistribution during Friction Stir Processing”, TMS Light Metals, Springer, Ed.: X. Wen, 2018 (In print) 2. N. Netto, M.Tiryakioglu “The Effect of Friction Stir Processing (FSP) on the Microstructure and Mechanical Properties of Cast Aluminum Alloys”, Encyclopedia of Aluminum and Its Alloys, Taylor & Francis, Eds.: G.E. Totten, M. Tiryakioglu, O. Kessler,2017 (In print) 3. Gil-Yong Yeom, G. Eisaabadi B, Hyun-Kyu Lim, N. Netto, M.Tiryakioglu “On the Microstructural Evolution during the Solution Treatment of AlDC12 (A383) Alloy Die Castings”, Encyclopedia of Aluminum and Its Alloys, Taylor & Francis, Eds.: G.E. Totten, M. Tiryakioglu, O. Kessler,2017 (In print) 4. G. Eisaabadi B., Gil-Yong Yeom, N. Netto, M.Tiryakioglu “The effect of solution treatment time on the microstructure and ductility of naturally-aged A383 alloy die castings”, Materials Science and Engineering: A, vol. 722, pp. 1-7, 2018.
109