Effect of intrauterine infusion of Escherichia coli on hormonal patterns in gilts during the oestrous cycle Barbara Jana, Jan Kucharski, Adam Ziecik
To cite this version: Barbara Jana, Jan Kucharski, Adam Ziecik. Effect of intrauterine infusion of Escherichia coli on hormonal patterns in gilts during the oestrous cycle. Reproduction Nutrition Development, EDP Sciences, 2004, 44 (1), pp.37-48. .
HAL Id: hal-00900474 https://hal.archives-ouvertes.fr/hal-00900474 Submitted on 1 Jan 2004
HAL is a multi-disciplinary open access archive for the deposit and dissemination of scientific research documents, whether they are published or not. The documents may come from teaching and research institutions in France or abroad, or from public or private research centers.
L’archive ouverte pluridisciplinaire HAL, est destin´ee au d´epˆot et `a la diffusion de documents scientifiques de niveau recherche, publi´es ou non, ´emanant des ´etablissements d’enseignement et de recherche fran¸cais ou ´etrangers, des laboratoires publics ou priv´es.
Reprod. Nutr. Dev. 44 (2004) 37–48 © INRA, EDP Sciences, 2004 DOI: 10.1051/rnd:2004013
37
Original article
Effect of intrauterine infusion of Escherichia coli on hormonal patterns in gilts during the oestrous cycle Barbara JANA*, Jan KUCHARSKI, Adam J. ZIECIK Division of Reproductive Endocrinology and Pathophysiology, Institute of Animal Reproduction and Food Research of Polish Academy of Sciences, 10-747 Olsztyn, Tuwima 10, Poland (Received 28 January 2003; accepted 14 November 2003)
Abstract – The aim of this study was to determine the effect of intrauterine Escherichia coli infusion on the patterns of plasma LH, prolactin, progesterone, androstenedione, testosterone, oestrone, oestradiol-17β, cortisol and 13,14-dihydro-15-keto-prostaglandin F2α (PGFM) in gilts during the oestrous cycle. On day 4 of the oestrous cycle (day 0), 25 mL of saline or 25 mL of Escherichia coli suspension, containing 107 colony forming units·mL–1, was infused once into the each uterine horn in group I or II, respectively. The control gilts developed a new oestrous cycle at the expected time but not bacteria-treated. Endometritis and vaginal discharge developed in all gilts after Escherichia coli infusion. The administration of Escherichia coli resulted in a reduction of plasma levels of LH, prolactin, oestrone and oestradiol-17β (P < 0.05–0.001), mainly on days 15– 18 after treatment (expected perioestrous period). During this time, the plasma androstenedione level was elevated (P < 0.05–0.001) after bacteria infusion. In the gilts receiving bacteria, progesterone concentration decreased from day 8 after treatment and was low until the end of the study (P < 0.05–0.001). On days 8–12 after bacteria administration, the level of PGFM was higher (P < 0.001) than that found in the control group. These results suggest that the developing inflammatory process of the endometrium in gilts following Escherichia coli infusion significantly affects the pituitary-ovarian axis function as well as prostaglandin production leading to anoestrus. uterus / inflammation / LH / progesterone / gilt
1. INTRODUCTION Endometritis is a common reproductive disorder in female domestic animals with consequences ranging from no effect on reproductive performance to permanent sterility. This pathological state can occur in pigs after parturition as well as in animals which have not yet given birth [1]. However, it more often exists in the postpartum period due to the heavy parturition, retention of fetal membranes and insufficient involution of the uterus or its inertia. The * Corresponding author:
[email protected]
onset of endometritis and vaginal discharge may be influenced by several factors, such as the hygiene and procedures of artificial insemination, and it may be caused by ascending infections with facultatively pathogenic bacteria [1]. It is generally assumed that these bacteria may evoke endometritis under certain conditions, such as an increase in their number or a decrease in the uterine defence [2]. Both aerobic and facultatively anaerobic bacterial species have been cultured from the uteri of sows with and without endometritis. It has been reported that
38
B. Jana et al.
a wide range of bacteria, mainly Escherichia coli (E. coli), Staphylococcus spp., Streptococcus spp., and in some cases Actinomyces pyogenes, Pasteurella multocida and Klebsiella pneumoniae have been also isolated from the uteri of sows with endometritis [2, 3]. However, it is worth mentioning that sometimes vaginal discharge may also point to vaginitis. The hormonal changes arising following intrauterine infusions of inflammation provoking factors has been partly documented in experiments conducted mainly in cows. It has been reported that intrauterine infusion of bacteria in cows after first postpartum ovulation is associated with a decrease in the plasma progesterone (P4) concentration and an increase in plasma of prostaglandin F2α (PGF2α) metabolite, 13,14-dihydro-15-keto-prostaglandin F2α (PGFM) concentration [4]. Moreover, an increased plasma level of PGFM was also observed in cows after infusion of bacteria or endotoxin (lipopolysaccharide, LPS) into the uterus [5, 6]. Several reports [7, 8] suggest that the elevated plasma cortisol level in heifers after intrauterine infusion of LPS may have contributed to the inhibition of luteinising hormone (LH) surge by blocking ovarian production of oestradiol-17β (E2). It is important to add that in sows with mastitismetritis-agalactia syndrome the level of prolactin (PRL) is decreased [9]. All these findings show that the origin and course of the inflammatory process of the uterus in gilts during the oestrous cycle may also be accompanied by the changes of the hypothalamic-pituitary-ovarian and – adrenal axis function and prostaglandin production. According to our knowledge, there is no information available on the hormonal changes occurring in the inflammatory process of the uterus in gilts. Therefore, the purpose of this study was to determine the effect of intrauterine infusion of E. coli on the patterns of plasma LH, PRL, P4, androstendione (A4), testosterone (T), oestrone (E1), E2 and cortisol in gilts during the oestrous cycle. The plasma level of
PGFM was also determined, as an indicator of PGF2α secretion. 2. MATERIALS AND METHODS 2.1. Animals and groups The study was carried out on 12 crossbred gilts (Large White × Landrace) aged 7–8 months and weighing 90–110 kg. The animals originated from a herd having no problems with abnormal discharge from the genital tract or fertility disorders. The animals were individually housed in stalls under conditions of natural light and temperature. They were fed a commercial grain mixture and tap water ad libitum. We followed the principles of animal care (NIH publication No 86–23, revised in 1985) as well as the specific national law on animal protection. In this experiment, only gilts which exhibited two consecutive oestrus were used. Oestrous behavior was detected using the boar-tester. Cannulas were inserted into the jugular vein to collect blood samples on day 2 of the oestrous cycle (two days before the beginning of the study). Additionally, on this day the animals were laparotomised, the small incision of the uterine wall near the utero-tubal junction was made and polyvinyl cannula (outer diameter 1.2 mm, and inner diameter 0.8 mm; Tomel, Tomaszów Maz., Poland) with the numerous holes (1.0 mm in diameter) was inserted into each uterine horn lengthways, and then fixed on the back to infuse saline or bacterial suspension. The gilts were not treated with antibiotics before, during or after surgery. The animals were randomly assigned to one of two groups: I, control gilts receiving saline (n = 6), and II, treated with E. coli (n = 6). 2.2. Experimental procedure Gilts of group I, received one infusion of 25 mL of saline into each uterine horn on
Hormones and inflammation of the uterus
day 4 of the oestrous cycle (day 0). Group II, received similarly 25 mL of E. coli suspension (strain O25:K23/α/:H1; National Veterinary Research Institute, Department of Microbiology, Puławy, Poland), containing 107 colony forming units·mL–1 at the same time. Blood samples for determination of hormone concentrations were collected from the jugular vein on day 0 and for 31 consecutive days after treatment (AT), according to the following schedule: days 0 and 1–14 AT: 0800 hour (h); day 15 AT: 0600, 1200, 1800 and 2400 h; day 16 AT: 0600, 1000, 1400, 1800 and 2200 h; day 17 AT: 0200, 0600, 1000, 1400, 1800 and 2200 h; day 18 AT: 0200, 0600, 1000, 1400, 1800 and 2200 h; day 19 AT: 0200, 0600, 1200, 1800 and 2400 h, days 20–31 AT: 0800 h. Additionally, blood samples were collected every hour for 10 h (0800–1800 h) on days 8–12 AT to estimate P4 and PGFM profiles. Immediately after collection, the blood samples were placed into an ice bath where they were kept until centrifugation (1 500 g, at 4 °C, 10 min). The plasma was decanted and stored at –20 °C until the hormone assays were performed. During the entire study, the gilts were observed for clinical symptoms, and rectal temperature was measured twice a day (0800, 1800 h). Additionally, twice a day, the gilts were observed for oestrus on days 15–19 AT, the signs of which were rated according to the method of Karalus et al. [10]: 3 – vulva red and swollen, standing oestrus, sometime including vaginal discharge; 2 – vulva red and swollen but not accompanied by standing oestrus; 1 – some redness and slight swelling of the vulva and 0 – no outward physical or behavioral signs. The gilts were slaughtered on day 31 AT, after the last blood sample collection. The ovaries were dissected and their volume and weight were measured as well as the number of follicles, corpora lutea and albicans was counted. The uterine horns were cut and their macroscopic examination was performed.
39
3. HORMONE ANALYSES In blood plasma, LH concentrations were determined by a double-antibody RIA method as described by Ziecik et al. [11]. The primary antibodies (Sz/Z/89/396) obtained from rabbit immunised against a conjugate of porcine LH with ovalbumin were used at a titer of 1:700 000. Purified porcine LH (USDA-pLH-1) was used for the preparation of radioiodinated antigen and USDApLH-B-1 as a standard. The sensitivity of the assay was 0.08 ng.mL–1. Intra- and interassay coefficients of variation (C.V.) were 6.7 and 12.5%, respectively. Plasma concentrations of PRL were determined by a double antibody RIA procedure as described by Dusza and Krzymowska [12], using porcine prolactin preparation KK-3 (purified by K. Kochman, Jablonna, Poland) for the standard and for iodination. Primary antibodies from goats immunised against porcine PRL (Research Products Int. Corp., Mt. Prospect, IL, USA) were applied at a titer of 1: 30 000. The sensitivity of the assay was 0.19 ng·mL–1. Intra- and interassay C.V. were 9.7 and 12.8%, respectively. The concentration of sex steroids in blood plasma was estimated by the RIA procedures described for P4 and E2 by Hotchkiss et al. [13], A4 and E1 by Dziadkowiec et al. [14] and for T by Kotwica and Williams [15]. Characteristics of the antibodies (obtained from the Institute of Animal Physiology, University of Warmia and Mazury in Olsztyn, Poland) were published for P4 by Dziadkowiec et al. [16], for A4, T, E1 and E2 by Szafranska et al. [17]. The sensitivity of the assay for P4, A4, T, E1 and E2 were 15 pg, 5 pg, 2.5 pg, 2.5 pg and 5 pg (per tube), respectively. Intra- and interassay C.V. for P4, A4, T, E1 and E2 were 4.2 and 11.6%, 5.7 and 12.4%, 7.6 and 12.5%, 6.5 and 11% and, 6.9 and 11.8%, respectively. The plasma level of total cortisol was estimated according to the procedure described by Stupnicki [18], using aF1/R75 antibodies produced at the Institute of
40
B. Jana et al.
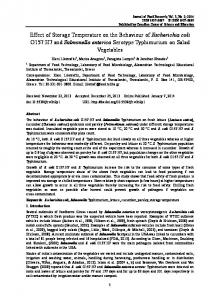
Figure 1. Mean (± S.E.M.) values of rectal temperature in the control (open circle) and bacteriatreated gilts (solid circle). An arrow indicates the time (day 0) of saline or bacteria infusion. * Indicates differences (P < 0.05) between the control and bacteria-treated group on the same days.
Animal Physiology and Nutrition, Polish Academy of Sciences, Jablonna, Poland. The sensitivity of the assay was 0.03 ng·mL–1. Intra- and interassay C.V. were 10.0 and 13.8%, respectively. Concentrations of PGFM were determined as described by Homanics and Silvia [19], and the antiserum (WS4468BD 6/23– 7/21) was characterised by the same authors. The sensitivity of the assay was 12 pg/tube. Intra- and interassay C.V. were 7.8 and 14%, respectively. 3.1. Statistical analysis Mean (± S.E.M.) values of the hormones were calculated for all samples taken every day for all control and all E. coli-treated animals. The collected data was statistically assessed by analysis of variance for twofactorial, orthogonal repeated measures. The Bonferroni test was applied for calculation of the statistical significance of mean differences. Mean (± S.E.M.) number of various ovarian structures as well as volume and weight of the ovaries were calculated for the control and E. coli-treated gilts. These data were compared by one-way analysis of variance (ANOVA, InStat Graph Pad, San Diego, CA). The mean rectal tempera-
ture was calculated for each day of the study for all control and all E. coli-treated gilts. The equality of mean values was examined with the Student t-test. 4. RESULTS 4.1. Oestrous behavior All control gilts (saline infusion) exhibited red, swollen vulvas accompanied by the standing oestrus behavior (rating 3) on days 16–18 AT. In the bacteria-treated group, four gilts showed some redness and a slight swolling of the vulva (rating 1) in the same period. The remaining two showed no outward physical or behavioral signs. 4.2. Clinical symptoms In the control group, the rectal temperature measured during the entire experiment reached up to 39.4 °C. The highest value of the temperature (40.1 °C) was found on day 15 and 18 after bacteria treatment. In the gilts receiving bacteria, an increase of temperature was significant (P < 0.05) on days 14, 15, 18 and 25–29 AT as compared with the control group (Fig. 1).
Hormones and inflammation of the uterus
41
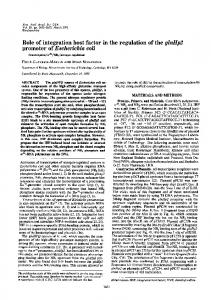
Figure 2. Mean (± S.E.M.) plasma concentration of LH (a) and PRL (b) in the control (hatched bars) and bacteria-treated gilts (solid bars). An arrow indicates the time (day 0) of saline or bacteria infusion. A horizontal bar marks the period when signs of oestrus were observed in 6/6 control gilts and 4/6 in E. coli-treated gilts. * Indicates differences (P < 0.05–0.001) between the control and bacteria-treated group on the same days.
In the control gilts, no vaginal discharge was developed. The gilts receiving E. coli showed a large vaginal discharge. In these animals, the first outflows of the mucopurulenta exudate from the vagina were observed on days 10–14 after bacteria infusion. The outflows of the inflammatory exudate lasted to the end of the study with a different intensity. The amount of the exudate, as well as its nature and duration was diverse in the individual gilts. 4.3. Uterine macroscopic observations Macroscopically, in the endometrium of the gilts treated with saline at slaughter no inflammatory changes were observed. The infusion of E. coli into the uterine induced an inflammatory process involving the entire organ. The uterine horns were greatly
enlarged. The great amount of the greywhite mucosal exudate with the considerable additive of the pus was observed in the uterine horns. The uterine wall was thickened. The endometrium was red in color, swollen with distinctly visible blood vessels. 4.4. Concentrations of hormones in the blood plasma The mean values of all hormones were calculated for each experimental day. Figures 2–4 present mean values of LH, PRL, P4, A4 and oestrogens during the whole period studied, whereas Table I shows values of P4 and PGFM on days 8– 12 after treatment when the plasma samples were more frequently collected.
42
B. Jana et al.
Figure 3. Mean (± S.E.M.) plasma concentrations of P4 (a) and A4 (b) in the control (hatched bars) and bacteria-treated gilts (solid bars). An arrow indicates the time (day 0) of saline or bacteria infusion. A horizontal bar marks the period when signs of oestrus were observed in 6/6 control gilts and 4/6 in E. coli-treated gilts. * Indicates differences (P < 0.05–0.001) between the control and bacteria-treated group on the same days.
4.4.1. Concentrations of hormones in blood plasma throughout the entire experiment In the control group, LH level was unchanged on days 8–14 AT. The concentration of LH in the controls was the highest from day 15 to day 18 AT resembling a typical preovulatory LH surge. On days 15– 17 AT, the plasma LH level was higher (P < 0.05, P < 0.01) as compared to that observed on days 0, 1–3, 25 and 29 AT. In the gilts receiving E. coli, the plasma LH level did not change significantly throughout the entire experimental period. In the gilts treated with E. coli, the level of LH decreased (P < 0.05–0.001) as compared to
that observed in the control group on days 5, 9, 12 and 15–18 AT (Fig. 2a). In the control group, plasma concentration of PRL in the period from day 13 to day 19 AT was higher (P < 0.05–0.001) than that found on days 20–31 AT. In the E. coli-treated gilts, PRL concentration was unchanged throughout the entire study. Following the bacteria treatment, plasma PRL concentration was lower (P < 0.05–0.001) on days 13–19, 24, 29 and 30 AT as compared to that in the control animals (Fig. 2b). In the control gilts, the concentration of P4 in the period from days 8–11 AT was higher (P < 0.05–0.001) than that found in
Hormones and inflammation of the uterus
43
Figure 4. Mean (± S.E.M.) plasma concentrations of E1 (a) and E2 (b) in the control (hatched bars) and bacteria-treated gilts (solid bars). An arrow indicates the time (day 0) of saline or bacteria infusion. A horizontal bar marks the period when signs of oestrus were observed in 6/6 control gilts and 4/6 in E. coli-treated gilts. * Indicates differences (P < 0.05–0.001) between the control and bacteria-treated group on the same days.
the samples collected during the first six days of the study and from day 13 to day 24 AT. In this group, on days 28–31 after infusion, blood P4 concentration was higher (P < 0.05–0.001) as compared to that observed on days 0, 1–5 and 13–24 AT. The plasma level of P4 gradually increased from day 1 to day 8 after E. coli administration and then it decreased. From day 9 AT until the end of the study, P4 concentrations did not change significantly and varied between 0.35 and 2.51 ng.mL–1. However, they were lower (P < 0.05–0.001) as compared to the values found in the blood samples collected on days 5–8 AT. In the
control group, the P4 plasma level on days 8–12 and 25–31 AT was higher (P < 0.01, P < 0.001) than that determined in the E. coli-treated gilts (Fig. 3a). In both the control and bacteria-treated groups, A4 plasma levels did not change significantly during the whole experimental period. The concentration of this steroid was higher (P < 0.05–0.001) from day 14 to day 18 after E. coli infusion than that found in the control gilts (Fig. 3b). In the gilts receiving saline and E. coli, plasma T levels were similar throughout the entire study. The concentrations of T
44
B. Jana et al.
Table I. Mean (± S.E.M.) daily plasma concentrations of P4 and PGFM on days 8–12 after saline (C) and bacteria (B) treatment in gilts. Day after treatment Hormone P4 ng·mL–1
PGFM pg·mL–1
Group 8
9
10
11
12
C
16.2a,∗ ± 0.5
15.8a,∗ ± 0.5
14.6a,∗ ± 0.6
11.5b,∗ ± 0.4
9.9b,∗ ± 0.6
B
8.5a ± 0.5
2.8b ± 0.1
3.0b ± 0.3
2.6b ± 0.2
2.0b ± 0.2
C
170.5∗ ± 25.2
165.7∗ ± 21.7
234.1∗ ± 32.0
240.5∗ ± 18.9
223.3a,∗ ±15.3
B
389.3a ± 31.1
407.8a ± 42.2
597.2a,b ± 69.1
670.3b ± 71.5
665.4b ± 67.4
* Indicates differences (P < 0.05–0.001) between the control and bacteria-treated group on the same days; the different superscripts a,b indicate differences (P < 0.05–0.001) between days within the control and bacteria-treated group.
did not differ between both groups on consecutive days of the experiment (data not presented). In the saline and bacteria-treated animals, E1 plasma levels showed no significant change in the whole experimental period. After administration of E. coli, a reduction (P < 0.05–0.001) of E1 plasma concentration from day 12 AT until the end of the study was noted (Fig. 4a). In the control group, the E2 concentration in the period from day 14 to day 19 AT was higher (P < 0.05–0.001) as compared with values found on days 0, 1, 2 and 29– 31 AT. From day 20 to day 31 AT, the concentration of this steroid did not differ statistically. In the gilts receiving bacteria, the concentration of E2 was unchanged in the particular days of the experiment. In the control group, E2 concentration increased (P < 0.05–0.001) in the period from day 14 to day 19 AT as compared with that detected in the E. coli-treated group (Fig. 4b). During the entire experimental period, concentrations of cortisol were unchanged in both groups of animals. On the particu-
lar days of the study, the levels of cortisol varied insignificantly between the control and bacteria-treated groups, but tended to be higher (P = 0.28) in the gilts receiving bacteria in the period from day 6 AT until the end of the study, except day 21 AT (data not presented). 4.4.2. Concentrations of P4 and PGFM in blood plasma on days 8–12 after treatment In the control group, P4 plasma concentration was higher (P < 0.01, P < 0.001) from days 8–10 AT than that found on day 11 and 12 AT. The concentration of this steroid was lower (P < 0.001) on days 9–12 after bacteria treatment as compared to the value found on day 8 AT. On days 8– 12 AT, the level of P4 in the gilts receiving bacteria was lower (P < 0.001) than that observed in the control animals (Tab. I). In the saline-infused gilts, PGFM concentration changed insignificantly during the period analyzed, however, the highest level of this metabolite was observed on day 11 AT. PGFM concentration in blood
Hormones and inflammation of the uterus
samples collected on day 11 and 12 after bacteria infusion was higher (P < 0.05, P < 0.01) as compared to that found on days 8 and 9 AT. The concentration of PGFM of bacteria-infused gilts was higher (P < 0.001) than that determined in the control group on days 8–12 AT (Tab. I). 4.5. Structural elements of the ovaries and their volume and weight In the control gilts, the mean number of corpora lutea (ranging from 9 to 11 mm in diameter), follicles (1–4 mm in diameter) and corpora albicans, calculated per ovary, was 5.2 ± 0.8, 21.6 ± 2.5 and 5.2 ± 2.2, respectively. In the ovaries of the gilts treated with bacteria, the corpora lutea were not found. There were follicles (1–4 mm in diameter) and 18.4 ± 3.2 and 4.5 ± 1.2 corpora albicans per ovary, respectively. The volume and weight of the ovaries thirty days after intrauterine infusion of E. coli were lower (P < 0.05) as compared with those found in the control group (volume: 3.2 ± 0.5 mL vs. 5.9 ± 0.6 mL; weight: 3.5 ± 0.7 g vs. 6.2 ± 0.4 g; respectively).
5. DISCUSSION The present study showed that intrauterine infusion of E. coli in the gilts during the oestrous cycle induces endometritis and vaginal discharge. This study demonstrated a significant decrease in the level of P4 on days 8–12 after intrauterine infusion of E. coli (expected perilutolysis period) in gilts which was accompanied by an increase in PGF2α concentration. However, on the ground of the employed blood sampling schedule for estimation of PGFM it cannot be concluded that the drop in P4 concentration is caused by elevated PGF2α during the studied period. Our study also showed for the first time that the developing inflammatory process of the uterus in gilts inhibits ovulation and oestrus behavior (at least
45
through 31 days) and is connected with a decrease in plasma concentrations of LH, PRL, P4 and oestrogens, and with an increase in A4. We found that intrauterine infusion of E. coli during the early luteal phase of the oestrous cycled led to earlier luteolysis. The luteal regression was characterised by a rapid decrease of the P4 level as early as day 9 AT (day 13 of the oestrous cycle) whereas in the control group the P4 level started to be significantly lower 4 days later (day 17 of the cycle). Our observation was in agreement with earlier studies in which experimental bacteria-induced endometritis in goats and heifers also caused shortening of the luteal phase [20–22]. Connor et al. [23] and Hallford et al. [24] presented that earlier luteolysis in gilts, beginning on day 12, can be caused by very high doses of PGF2α. In the gilts treated with bacteria, we found an increased plasma PGFM level during the expected periluteolysis period (days 8– 12 AT). It can be assumed that in the inflamed uterus PGF2α production was increased, as found previously in cows with puerperal endometritis or after intrauterine infusion of bacteria and LPS [6, 8, 25]. It is interesting that in gilts receiving E. coli, despite the diminution of P4 secretion (and suppression of the inhibitory influence on the hypothalamic-pituitary unit) already on day 9 AT (day 13 of the oestrous cycle), an increase of LH secretion did not occur on both days 9 and 15–19 AT (expected perioestrous period), when compared with the control group. Our results were also in agreement with data by Peter et al. [7, 8] who found the abolished or delayed preovulatory LH surge after intrauterine infusions of LPS in heifers. LPS administered i.m. in prepubertal gilts [26] and i.v. in adult ewes [27] also reduces plasma LH concentrations. A lack of the preovulatory LH surge in the gilts treated with E. coli in our study was probably caused by a decrease in oestrogen concentration on days 14–19 AT (expected perioestrous period), leading in consequence to
46
B. Jana et al.
a disturbance in positive and negative feedback of LH secretion. It has been shown that a decrease in E2 plasma level after intrauterine infusions of LPS is responsible for the lack of the preovulatory LH surge in heifers [7, 8]. A decreased LH secretion on day 9 AT can be explained by the inhibitory influence of the increased level of PGF2α as hypothesised by Kindahl et al. [28] and Peter and Bosu [29]. In the ovariectomised sheep, for example, the prostaglandin synthesis inhibitor reverses the inhibitory effects of LPS on pulsatile GnRH and LH secretion [30]. However, a decreased LH level may be attributable to the inhibition of follicle development [31]. It has been reported that uterine bacterial contamination after parturition in cows also undesirably affects the follicle selection and its subsequent growth and function [32]. Additionally, a decrease in LH plasma level in the treated gilts could be eventually the consequence of the inhibitory effect of the proinflammatory cytokines released from an inflamed uterus on the hypothalamicpituitary unit, as was suggested earlier [33]. The reduction of PRL secretion observed in E. coli-treated animals can be caused by the decreased oestrogen secretion [34, 35] and/ or cytokine effect [9, 36]. In our study, in the gilts treated with E. coli, the secretion of both the oestrogens was decreased (as mentioned above) on days 14–19 of infusion (expected perioestrous period) whereas A4 increased. The possible reason for the observed changes could be related to an increased conversion of P4 and dehydroepiandrosterone to A4 and/or a decreased aromatisation of oestrogens. Taking under consideration the hormonal changes found in E. coli-treated gilts, it is obvious that the development of preovulatory follicles, ovulation and luteinisation did not occur. These animals became anoestrous, similar to cows after intrauterine infusion of bacteria [5, 37, 38]. Prolonged anoestrus was also observed in cows with heavy puerperal endometritis
[25]. The development of anoestrus in the present study was also confirmed by morphological assessment of the ovaries conducted on day 31 after bacteria treatment. In the ovaries, the absence of the corpora lutea and the presence of only the corpora albicans and small follicles was observed, which led to a decrease in the volume and weight of the ovaries. It should also be stressed that intrauterine infusion of E. coli in the gilts on day 4 of the oestrous cycle did not affect the formation of the corpora lutea in the first cycle studied. In the treated animals, the level of P4 gradually increased up to day 8 AT (day 12 of the oestrous cycle) as in the control gilts. A lack of bacterial infection influence on the formation of the corpora lutea before this day can be explained by their resistance to luteolytic stimuli. It has been indicated that the number of high affinity receptors for PGF2α in the porcine luteal cells increases gradually up to day 12 of the oestrous cycle [39]. In conclusion, the data obtained in this study show that the origin and course of the inflammatory process of the uterus in the gilts following infusion of E. coli during the early luteal phase of the oestrous cycle is connected with the considerable hormonal pattern disturbances. These changes are associated with the function of the pituitary-ovarian axis and prostaglandin production. Our findings suggest that the inflammatory state of the uterus may further affect fertility leading to anoestrus. However, the question about the mechanism of influence of the inflamed uterus on the pituitary and ovarian hormones secreting cells remains open.
ACKNOWLEDGMENTS The authors are grateful to Prof. J. Przał a and Dr. B. Szafranska (Institute of Animal Physiology, University of Warmia and Mazury in Olsztyn, Poland) and Dr. W.J. Silvia (University of Kentucky, Lexington, USA) for the kind donation of sex steroid and PGFM antibodies,
Hormones and inflammation of the uterus
respectively. We are indebted to J. Kalinowska, D. Karpowicz and W. Krzywiec for assistance in care and handling of the animals and help in the laboratory. Part of these results was presented during the ESDAR Conference (Anger, France, 26–27 November 1999).
[11]
[12]
REFERENCES [1] Muirhead MJ. Epidemiology and control of vaginal discharges in the sow after service. Vet Rec 1986, 199: 233–235. [2] De Winter PJJ, Verdonck M, de Kruif A, Devriese LA, Haesebrouck F. Bacterial endometritis and vaginal discharge in the sow: prevalence of different bacterial species and experimental reproduction of the syndrome. Anim Reprod Sci 1995, 37: 325–335. [3] Aas AHG, Sunde M, Karlberg K, Hofmo PO. Bacteriological and histological examination of urogenital organs from sows culled after weaning. Keszthely: Proc. 2nd ESDAR Conference, 1998, p 46.
[13]
[14]
[15]
[4] Peter AT, Bosu WTK. Effect of intrauterine infection on the formation of the corpora lutea formed after first postpartum ovulations in dairy cows. Theriogenology 1987, 27: 593–609.
[16]
[5] Del Vecchio RP, Matsas DJ, Inzana TJ, Sponenberg DP, Lewis GS. Effect of intrauterine bacterial infusions and subsequent endometritis on prostaglandin F2α metabolite concentrations in postpartum beef cows. J Anim Sci 1992, 70: 3158–3162.
[17]
[18]
[6] Peter AT, Bosu WTK, Gilbert RO. Absorption of Escherichia coli endotoxin (lipopolysaccharide) from the uteri of postpartum dairy cows. Theriogenology 1990, 33: 1011– 1014. [7] Peter AT, Bosu WTK, DeDecker RJ. Suppression of preovulatory luteinizing hormone surges in heifers after intrauterine infusions of Escherichia coli endotoxin. Am J Vet Res 1989, 50: 368–373. [8] Peter AT, Simon JE, Luker CW, Bosu WTK. Site of action for endotoxin-induced cortisol release in the suppression of preovulatory luteinizing hormone surges. Theriogenology 1990, 33: 637–643. [9] Smith BB, Wagner WC. Effect of Escherichia coli endotoxin and thyrotropin-releasing hormone on prolactin in lactating sows. Am J Vet Res 1985, 46: 167–174. [10] Karalus U, Downey BR, Ainsworth L. Maintenance of ovulatory cycles and pregnancy in
[19]
[20]
[21]
47
prepubertal gilts treated with PMSG and hCG. Anim Reprod Sci 1990, 22: 235–241. Ziecik A, Goralska M, Krzymowski T, Pogorzelski K. Isolation and purification of porcine LH for radioimmunoassay and radioreceptor assay. Bull Acad Pol Sci CII Ser Sci Biol 1978, 26: 739–744. Dusza L, Krzymowska H. Plasma concentrations during the estrous cycle of swine. J Reprod Fertil 1979, 57: 511–514. Hotchkiss J, Atkinson LE, Knobil E. Time course of serum estrogen and luteinizing hormone (LH) concentrations during the menstrual cycle of the rhesus monkey. Endocrinology 1971, 89: 177–183. Dziadkowiec I, Warchol A, Rembiesa R. Biosynteza estrogenów w ciąż y u szczura. (Biosynthesis of estrogens in pregnant rats). Endokrynologia Pol 1982, 33: 4–6. Kotwica J, Williams GL. Relationship of plasma testosterone concentrations to pituitary-ovarian hormone secretions during bovine estrus cycle and the effects of testosterone propionate administered during luteal regression. Biol Reprod 1982, 27: 790–801. Dziadkowiec I, Danilczuk H, Rembiesa R. Biosynteza progesteronu w ł oz·ysku szczura. (Biosynthesis of progesterone in rat placenta). Endokrynologia Pol 1982, 33: 201– 207. Szafranska B, Ziecik AJ, Okrasa S. Primary antisera against selected steroids or proteins and secondary antisera against γ-globulins – an available tool for studies of reproductive processes. Reprod Biol 2002, 5: 187–203. Stupnicki R. Hormony kory nadnerczy. w: Kokot F, Stupnicki R (Wyd), Metody radioimmunologiczne i radiokompetycyjne stosowane w klinice, PZWL, Warszawa, 1985, s. 235–245. The hormones of adrenal cortex in: Kokot F, Stupnicki R (Eds), The radioimmunologic and radiocompetitive methods applied in clinics, PZWL, Warsaw, 1985, p 235–245. Homanics GE, Silvia WJ. Effects of progesterone and estradiol-17β on uterine secretion of prostaglandin F2α in response to oxytocin in ovariectomized ewes. Biol Reprod 1988, 38: 804–811. Gilbert RO, Bosu WTK, Peter AT. The effect of Escherichia coli endotoxin on luteal function in Holstein heifers. Theriogenology 1990, 33: 645–651. Peter AT, Bosu WTK, Luker CW. Plasma endotoxin and concentrations of stable metabolites of prostacyclin, thromboxane A2, and prostaglandin E2 in postpartum dairy cows. Prostaglandins 1987, 34: 15–28.
48
B. Jana et al.
[22] Schallali AA, Homeida AM, Dafalla EA. Effect of intrauterine infection by Staphylococcus aureus and Mycoplasma capricolum on the fertility of Nubian goats. Reprod Nutr Dev 1987, 27: 999–1003. [23] Connor L, Phillips GD, Palmer WM. Effects of prostaglandin F2α on the estrous cycle and hormone levels in gilt. Can J Anim Sci 1976, 56: 661–669. [24] Hallford DM, Wetteman RP, Turman EF, Omtvedt IT. Luteal function in gilts after prostaglandin F2α. J Anim Sci 1975, 41: 1706–1710. [25] Mateus L, Lopes da Costa L, Diniz P, Ziecik AJ. Relationship between endotoxin and prostaglandin (PGE2 and PGFM) concentrations and ovarian function in dairy cows with puerperal endometritis. Anim Reprod Sci 2003, 76: 143–154. [26] Jana B. Selected hormonal parameters in prepubertal gilts treated with Escherichia coli endotoxin. Polish J Vet. Sci 1999, 2: 19–25. [27] Battaglia DF, Bowen JM, Krasa HB, Thurin LA, Viguie FJ. Endotoxin inhibits the reproductive neuroendocrine axis while stimulating adrenal steroids: a simultaneous view from hypophysel portal and peripheral blood. Endocrinology 1997, 138: 4273–4281. [28] Kindahl H, Endquist LE, Larsson K, Malmquist A. Influence of prostaglandins on ovarian functions post partum. In: Karg H, Schallenberger E (Ed), Factors influencing fertility in the post-partum cow. Martinus Nijhoff, The Hague, 1992, p 173–196. [29] Peter AT, Bosu WTK. Influence of intrauterine infections and follicular development on the response to GnRH administration in postpartum dairy cows. Theriogenology 1988, 29: 1163–1175. [30] Harris TG, Battaglia DF, Brown ME, Brown MB, Carlson NE, Viguie C, Williams CY, Kirsch FJ. Prostaglandins mediate the endotoxin-induced suppression of pulsatile gonadotropin-releasing hormone and luteinizing hormone secretion in the ewe. Endocrinology 2000, 141: 1050–1058.
[31] Foxcroft GR, Hunter MG. Basic physiology of follicular maturation in the pig. J Reprod Fertil Suppl 1985, 33: 1–19. [32] Sheldon IM, Noakes DE, Rycroft AN, Pfeiffer DU, Dobson H. Influence of bacterial contamination after parturition on ovarian dominant follicle selection and follicle growth and function in cattle. Reproduction 2002, 6: 837–845. [33] Peter AT, Malven PV, Shaftoe S, Bosu WTK. Quantification of circulating beta-endorphin and white blood cells in heifers after intrauterine administration of Escherichia coli endotoxin. Theriogenology 1991, 36: 1009– 1014. [34] Kirkwood RN, Lapwood KR, Smith WC, Moller K, Garrick DJ. Effects of oestradiol benzoate treatment on the reproductive performance and endocrine status of sows after lactations of 10 or 35 days. J Reprod Fertil 1984, 72: 329–337. [35] Ziecik A, Doboszynska T, Dusza L. Concentrations of LH, prolactin and progesterone in early-pregnant and oestradiol-treated pigs. Anim Reprod Sci 1986, 10: 215–224. [36] Schettini G, Florio T, Meucci O, Landofli F, Grimaldi M, Lombardi G. Interleukin-1β modulation of prolactin secretion from the rat anterior pituitary cells: Involvement of adenylate cyclase activity and calcium mobilization. Endocrinology 1990, 126: 1435–1441. [37] Farin PW, Ball L, Olson JD, Mortimer RG, Jones RL, Adney WS, Mc Chesney AE. Effect of Actinomyces pyogenes and gramnegative anaerobic bacteria on the development of bovine pyometra. Theriogenology 1989, 31: 979–985. [38] Vighio GH, Liptrap RM, Etherington WG. Oxytocin-prostaglandin interrelationships in the cow with pyometra. Theriogenology 1991, 35: 1121–1126. [39] Gadsby JE, Balapure AK, Britt JH, Fitz TA. Prostaglandin F2α receptors on enzyme-dissociated pig luteal cells throughout the estrous cycle. Endocrinology 1990, 126: 787–795.