Shobhit University-Meerut. Meerut, UP, INDIA. B. K. Kaushik and Brijesh Kumar. Dept. of Electronics and Computer Engineering. Indian Institute of Technology, ...
Evolution in Networks and Computer Communications A Special Issue from IJCA - www.ijcaonline.org
Effect of Line Parasitic Variations on Propagation Delay in Global VLSI Interconnects K. G. Verma and Raghuvir Singh
B. K. Kaushik and Brijesh Kumar
School of Electronics Shobhit University-Meerut Meerut, UP, INDIA
Dept. of Electronics and Computer Engineering Indian Institute of Technology, Roorkee Roorkee, INDIA
ABSTRACT Process variation is considered to be a major concern in the design of circuits including interconnect pipelines in current deep submicron regime. Process variation results in uncertainties of circuit performances such as propagation delay. The performance of VLSI/ULSI chip is becoming less predictable as device dimensions shrinks below the sub-100-nm scale. The reduced predictability can be attributed to poor control of the physical features of devices and interconnects during the manufacturing process. Variations in these quantities maps to variations in the electrical behavior of circuits. The interconnect line resistance and capacitance varies due to changes in interconnect width and thickness, substrate, implant impurity level, and surface charge. This paper provides an analysis of the effect of interconnect parasitic variation on the propagation delay through driver-interconnect-load (DIL) system. The impact of process induced variations on propagation delay of the circuit is discussed for three different fabrication technologies i.e. 130nm, 70nm and 45nm. The comparison between three technologies interestingly shows that the effect of line resistive and capacitive parasitic variation on propagation delay has almost uniform trend as feature size shrinks. However, resistive parasitic variation in global interconnects has very nominal effect on the propagation delay as compared to capacitive parasitic. Propagation delay variation is from 0.01% to 0.04% and -4.32% to 18.1 % due to resistive and capacitive deviation of -6.1% to 25% respectively.
General Terms Interconnects, delay, signal, VLSI.
Keywords Process variation, parasitic, propagation delay, driver, load, technology node.
1. INTRODUCTION The semiconductor industry has been fueled by enhancements in integrated circuit (IC) density and performance, resulting in information revolution for over four decades and is expected to continue in future. The periodic improvement in density (as per Moore‟s Law) and performance has been mainly achieved through aggressive device scaling and/or increase in chip size. As far as MOS transistor scaling is concerned, device performance improves as gate length, gate dielectric thickness, and junction depth are scaled [1-3]. Deep sub-micron (DSM) technology allows packing billions of Metal Oxide Semiconductor Field Effect Transistors (MOSFETs) within a
single chip. However, it is very difficult to fabricate extremely small transistors with same characteristics. As the feature size continues to decrease in advanced CSM nodes, the capability to forecast various characteristics of manufactured transistor is worsening. This is because of the increased complexity of the semiconductor manufacturing process and the atomic scale control required for fabricating transistors. Although, process variability used to be a major concern for analog designers, but now it is also a foremost design issue for a digital designers too and therefore its prediction is among highest priority. The impact of process variation on digital integrated circuit design and manufacture has become more critical while the complementary MOS (CMOS) circuits are continuing to shrink to the nanometer scale. In sharp contrast to this, scaled chip wiring (interconnect) suffers from increased resistance due to decrease in conductor cross-sectional area and may also suffer from increased capacitance if metal height is not reduced with conductor spacing. The feature size of integrated circuits has been aggressively reduced in the pursuit of improved speed, power, silicon area and cost characteristics. Semiconductor technologies with feature sizes of several tens of nanometers are currently in development. As per, International Technology Roadmap for Semiconductors (ITRS) [4], the future nanometer scale circuits will contain more than a billion transistors and operate at clock speeds well over 10GHz. Distributing robust and reliable power and ground lines; clock; data and address; and other control signals through interconnects in such a high-speed, highcomplexity environment, is a challenging task. The performance of a high-speed chip is highly dependent on the interconnects, which connect different macro cells within a Very Large Scale Integration (VLSI)/ Ultra Large Scale Integration (ULSI) chip [5-8]. Today, VLSI chips require millions of closely spaced interconnect lines that integrate the components of a chip. With the advancements of VLSI technology, multilayer interconnections are useful to achieve higher packing densities, shorter transit delays and smaller chips [9]. In most cases, Aluminium (Al) has been used to form metal interconnects because of its low resistivity and silicon compatibility. With the demand of decreasing device dimensions and increasing current densities can cause electro migration and hillock formation between successive levels of Al. Some multilayer structures such as Al/Ti/Cu, Al/Ta/Al, Al/Ni, Al/Cr, Al/Mg and Al/Ti/Si can reduce this electro migration problem [10]. For reducing the hillocks on silicon-based circuits, one solution can make by depositing a film of WSi or MoSi between Al and Si substrate
1
Evolution in Networks and Computer Communications A Special Issue from IJCA - www.ijcaonline.org [10]. Complete elimination of hillocks is done with fabrication of interconnects by layering alternatively Al and a refractory metal (Ti or W). In this case, aluminium-copper alloys may be used because they have shown better reliability than pure Al. One of the most remarkable facts is that copper interconnects offer 40% less resistance to electrical conduction than corresponding Al interconnects resulting 15% increased speed of circuit [10]. Another advantage of copper interconnects is that they can be fabricated with widths in the range of 0.2 μm whereas the fabrication widths for Al is not less than 0.35 μm [10]. This reduction in interconnection dimensions allows higher packing densities in the order of 200 million transistors per chip, which implies 10-15% saving of cost for the full wafer [9, 10]. But there are some discrepancies associated with copper interconnects which include poisonous behavior of copper on Si based circuits, expensive large amount of ultrapure water for fabrication of copper interconnects and poisonous waste discharge may be dangerous for the environment. Apart from these effects, some modern interconnect issues like requirement of higher clock frequency, lower resistance and higher bandwidth may not be fulfilled by copper interconnects. The resistivity of copper interconnects is increasing rapidly under the effects of enhanced grain, surface scattering, large interconnect length and higher frequency operation which may cause electro migration induced hillocks and voids in VLSI circuits. At high frequencies, certain problems like crosstalk, skin effect, signal degradation and crosstalk induced propagation delay may exist in case of copper interconnect [11]. For these reasons, VLSI designers gear up with certain methods and materials in upcoming days. The function of interconnects or wiring systems is to distribute clock and other signals and to provide power/ground to and among the various circuits/systems functions on the chip. The performance such as time delay and power dissipation of a highspeed chip is highly dependent on the interconnects, which connect different macro cells within a VLSI chip. To escape prohibitively large delays, designers scale down global wire dimensions more sluggishly than the transistor dimensions [6, 7]. As technology advances, interconnects have turned out to be more and more important than the transistor resource, and it is essential to use global interconnects optimally. For high-density high-speed submicron-geometry chips, it is mostly the interconnection rather than the device performance that determines the chip performance. As operating frequencies continue to spiral upward, parasitic inductive effects must also be considered. Thus, interconnect parasitic play an increasing role in overall chip performance as feature size scales. Distribution of the clock and signal functions is accomplished on three types of wiring (local, intermediate, and global). An interconnect depending on its length, can be classified as local, semi-global and global [8]. Local wiring, consisting of very thin lines, connects gates and transistors within an execution unit or a functional block (such as embedded logic, cache memory, or address adder) on the chip. Local wires usually span a few gates and occupy first and sometimes second metal layers in a multilevel system. The length of a local interconnect wire approximately scales with scaling of technology, as the increased packing density of the devices make it possible to similarly reduce the wire lengths. Intermediate wiring provides clock and signal distribution within a functional block with
typical lengths up to 3–4 mm. Intermediate wires are wider and taller than local wires to provide lower resistance signal/clock paths. Global wiring provides clock and signal distribution between the functional blocks, and it delivers power/ground to all functions on a chip. Global wires, which occupy the top one or two layers, are longer than 4mm and can be as long as half of the chip perimeter. The length of global interconnect wires grow proportionally to the die size. The length of semi-global interconnect behaves intermediately. The global interconnects are much wider than local and semi-global interconnects. Thus resistance of global interconnects is small and therefore their behavior resembles that of lossless transmission lines. Due to increasing integration density and soaring clock, uncertainties associated with parameter variations become a first-tier concern for VLSI chip design, especially in nanometer regime. Aggressive scaling of CMOS technology in sub-130-nm nodes has created huge challenges. Typically, the source of variations includes process-induced and environmental variations. Variations due to fundamental physical limits, such as random dopant fluctuation (RDF) and line edge roughness (LER), are increasing significantly with technology scaling [1214]. Moreover, manufacturing tolerances in process technology are not scaling at the same pace as the transistor‟s channel length, due to process control limitations (e.g., sub wavelength lithography) [12-14]. Therefore, within-die statistical process variations worsen with successive technology generations. This paper considers the effect of process-induced line parasitic variations on propagation delay. Today, semiconductor industry is facing a major challenge of variability [12]. In addition, digital circuits show an increased sensitivity to process variations due to low-power and low voltage operation requirements, which can result in failing to meet timing constraints. The on-going reduction of feature size goes together with an increase of variability. Obviously, there are more technological opportunities for aggressive scaling when more variability can be tolerated. This will lead to better and cheaper products (provided the quantities are large enough). Therefore, while the challenge of the technologists is to realize scaling while controlling the variability and the challenge of designers is to make the resulting variability sufficiently harmless by using suitable architectures and topologies, the challenge of Electronic Design Automation (EDA) is to provide accurate and efficient procedures to enable designers to understand the effect of the pertinent process variability on their design. Increasing process variations can affect electrical parameters of interconnects (e.g. capacitances) and further influence circuit performance and functionality. Due to the process variation, interconnect technology parameters (ITP) are varying substantially. For simplicity, the researchers consider variations in metal width (W), metal thickness (T), and interlayer dielectric (ILD) thickness (H). The typical distribution of interconnect technology parameters can be observed for permittivity, inter level dielectric thickness, metal height and metal width [10]. The variation is especially large in the ILD (Inter Level Dielectric) thickness and metal line width. Their variations have a definite impact to the total line capacitance and interline coupling capacitance and result in variation of the signal delay. The organization of this paper is as follows. This paper highlights about on chip interconnect variations in section 2.
2
Evolution in Networks and Computer Communications A Special Issue from IJCA - www.ijcaonline.org Interconnect models are explained in section 3. Thereafter, section 4 describes Monte Carlo analysis of DIL system. Simulation results for different parameter variations of VLSI interconnect are described in section 5. Finally, conclusion is drawn in section 6.
2. VARIATIONS OF INTERCONNECT The source for on chip variations (OCV) is related to variation in interconnects height and width, resulting in variation in both resistance and capacitance. Since the delays attributed to interconnect are becoming more dominant as geometries shrink, particular attention should be paid to accurate analysis of interconnect variations. In advanced interconnect processes, which could involve use of multiple dielectrics, use of different metallization on different layers could result in significant variations. Erosion is the other mechanism and is a function of line space and density. Two additional sources of variation are the Chemical Mechanical Polishing (CMP) process and proximity effects in the photolithography and etch processes. Variation in the CMP process results from the difference of hardness of the interconnect material and that of the dielectric. Ideally, the CMP process will remove the unwanted Copper, leaving only lines and vias. The photolithography and etch proximity effects are shown in micro loading effects as the etch process step tends to over-etch isolated lines. Diffraction effects and local scattering in photolithography may tend to over expose densely spaced lines and under expose isolated lines. Tiling and metal slotting have been added as design rule requirements to mitigate these effects by minimizing the density gradient. Different tiling algorithms will give varying results, but the smaller the density gradient, the smaller the variations that will be seen on the die [15].
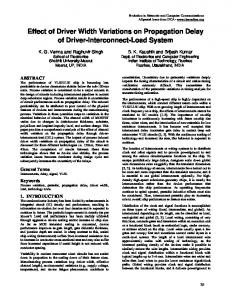
3. INTERCONNECT MODELS An interconnect can be modeled as either lumped or distributed form of RC (resistance-capacitance) or RLC (resistancecapacitance-inductance). In deep submicron technology, lumped models are no longer capable of satisfying the accuracy requirements. It is well accepted that simulations of a distributed RC model of an interconnect matches more accurately the actual behavior in comparison to lumped RC model [5-8]. In similar fashion, a distributed RLC model outperforms the lumped RLC model in terms of modeling accurately the behavior of a line. A distributed RLC model of an interconnect, known as the transmission line model, becomes the most accurate approximation of the actual behavior [5]. The transmission line analogy for an interconnect considers the signal propagation to be a wave propagation over the interconnect medium. This is in contrast to the distributed RC model, where the signal diffuses from source to the destination governed by the diffusion equation. In the wave mode, a signal propagates by alternatively transferring energy from the electric to magnetic fields, or equivalently from capacitive to the inductive nodes. Interconnect models must incorporate distributed self and mutual inductance to accurately estimate interconnect time delay, power dissipation, crosstalk and other parameters of significance.
Rtot = rℓ and Ctot=cℓ
ℓ
rΔ z
rΔz
rΔz
cΔz
cΔz
cΔ z
z
(a) RC model Rtot = rℓ, Ltot=lℓ and Ctot=cℓ
ℓ rΔz
lΔz
cΔz
rΔz
lΔz
rΔz
cΔz
lΔz
cΔz
z
(b) RLC model Fig 1: Development of interconnect models The evolution of various models with time is shown in Fig. 1. It is assumed that leakage conductance „g‟ equals 0, which is true for most insulating materials such as SiO2, Sapphire etc. Dealing with inductance requires efficient extraction methods. Presence of inductance also increases the processing time of the computer-aided design tools. Usually the interconnect circuits extracted from layouts contain a large number of nodes that make the simulation highly CPU intensive [20, 21]. Distributed coupled RLC models become necessary even for the early design stages.
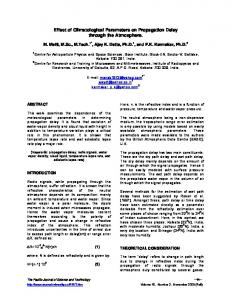
4. MONTE CARLO ANALYSIS OF DIL SYSTEM In this paper, the analysis carried out in this work takes into account a Driver-Interconnect-Load (DIL) system as shown in Fig. 2. The driver is an inverter gate driving interconnect. The propagation delay of a DIL system is dependent on various physical parameters which are prone to process variation. In this analysis, the driver is subjected to process variations for three different technologies of 130nm, 70nm and 45nm. To obtain statistical information on how much the characteristics of a circuit can be expected to scatter over the process, Monte Carlo analysis is applied. Monte Carlo analysis performs numerous simulations with different boundary conditions. It chooses randomly different process parameters within the worst case deviations from the nominal conditions for each run and allows statistical interpretation of the results. In addition to the process parameter variations, mismatch can be taken into account as well, providing a more sophisticated estimation of the overall stability of the performance with respect to variations in the processing steps. In most cases the parameters on which the assumptions for the mismatch are based are worst case parameters. A proper layout and choice of devices can significantly improve scatter due to mismatch. In
3
Evolution in Networks and Computer Communications A Special Issue from IJCA - www.ijcaonline.org order to obtain reasonable statistical results, a large number of simulations are needed, leading to quite long simulation times. Using Monte Carlo simulations, this work analyzes the effect of resistive and capacitive line parasitic variation of interconnect due to process variation on the propagation delay of DIL system. The propagation delay variations through DIL system are observed for process variations in three different technologies.
m1 1
τ Vin
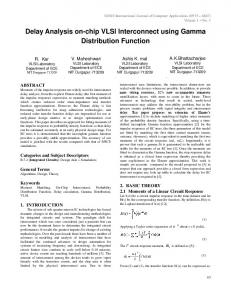
The comparison between different technologies showed that as feature size shrinks the process variation becomes a dominant factor and subsequently raises the variation in delays. Contradictorily, as per the results observed in this work it is observed that although the deviation in delay is more pronounced with increase in line capacitance variation, but these variations have almost same magnitude as the process technology changes from 130nm to 45nm. The delay variations are from -4.32% to 18.1 % due to capacitive deviation of -6.1% to 25% [19].
z=ℓ
RLC m1 Interconnect
CL
2 Fig 2: Driver Interconnect Load (DIL) System [22].
5. RESULT AND DISCUSSION Monte Carlo simulation results were observed for deviation in propagation delay with change in line parasitic. Table-1 shows variation in propagation delay due to deviations in capacitance for 130nm, 70nm and 45nm fabrication technologies. It is clearly observed that the variation in propagation delay is almost same for all process technologies of 130nm, 70nm and 45nm. These results which can also be noticed in Fig. 3 are in sharp contrast to observations made in previous research works related to process variations in oxide thickness [16], driver width [17], and threshold variations [18]. Previously, it was observed that in presence of significant variations of device model parameters the variations in performance parameter such as delay is severely affected. Table 1. Variation in propagation delay due to deviation in capacitance for 130nm, 70nm and 45nm fabrication technology [22] % Variation in capacitance
Propagation Delay Variation (130nm)
Propagation Delay Variation (70nm)
Propagation Delay Variation (45nm)
-6.08
-4.64
-4.65
-4.32
-2.43
-1.87
-1.88
-1.77
-2.33
-1.79
-1.8
-1.69
-0.29
-0.2
-0.22
-0.21
1.19
0.83
0.9
0.86
2.6
1.82
1.94
1.93
5.28
3.71
3.93
3.92
5.53
3.87
4.12
4.1
7.63
5.3
5.63
5.62
24.92
17.93
18.53
18.1
Fig 3: Plot showing percentage deviation in propagation delay with respect to process induced capacitance variation [22].
Table 2. Variation in Propagation Delay due to Deviation in Resistance for 130nm, 70nm and 45nm Fabrication Technology [22]
% Variation in Resistance
Propagation Delay Variation (130nm)
Propagation Delay Variation (70nm)
Propagation Delay Variation (45nm)
-6.09
-0.01
-0.01
-0.01
-2.44
0
0
0
-2.33
0
0
0
-0.29
0
0
0
1.19
0
0
0
2.6
0
0.01
0.01
5.29
0.01
0.01
0.01
5.53
0.01
0.01
0.01
7.63
0.01
0.01
0.01
24.92
0.04
0.04
0.04
4
Evolution in Networks and Computer Communications A Special Issue from IJCA - www.ijcaonline.org Now, Table-2 shows variation in propagation delay due to deviations in resistance for different fabrication technologies. It is demonstrated that the variation in propagation delay is almost same for all process technologies. These results as also shown in Fig. 4, are again in sharp contrast to observations made by previous research works where the variations in performance parameter such as delay is severely affected with reduction in feature size for higher technologies.
7. REFERENCES [1]
Mizuno, T., Okumtura, J. and Toriumi, A. 1994. Experimental study of threshold voltage fluctuation due to statistical variation of channel dopant number in MOSFET‟s. IEEE Trans. Electron Devices, vol. 41, no. 11 (Nov. 1994) 2216–2221.
[2] Frank, D., Dennard, R., Nowak, E., Solomon, P., Taur, Y. and Wong, H. S. 2001. Device scaling limits of Si MOSFETs and their application dependencies. Proc. IEEE, vol. 89, no. 3 (Mar. 2001) 259–288. [3] Croon, J., Decoutere, S., Sansen, W. and Maes, H. 2004 Physical modeling and prediction of the matching properties of MOSFETs. Proc. 34th European Solid-State Device Research Conference (ESSDERC), 193–196. [4] “The International Technology Roadmap for Semiconductors,” ITRS Website. [Online]. Available: http://public.itrs.net. [5] Kaushik, Brajesh Kumar, Sarkar, Sankar and Agarwal, R. P. 2007. Waveform Analysis and Delay Prediction for a CMOS Gate Driving RLC Interconnect Load. Integration, the VLSI Journal, Elsevier Pub. Netherlands, vol. 40, no. 4 (July 2007) 394-405.
Fig 4: Plot showing percentage deviation in propagation delay with respect to process induced resistance variation [22, 23]. Previous researches illustrated that with shrinking feature sizes process variation turned out to be dominant and subsequently raised the variation in delays. Contradictorily, our results observes that the deviation in delay is extremely small for variation of line resistance even upto 25% in global VLSI interconnects domain. Moreover, these variations are in same magnitude as the process technology changes from 130nm to 45nm. The delay variations were from -0.01% to 0.04 % due to resistive deviation of -6.1% to 25% [16].
6. CONCLUSIONS This research work evaluated the effect of process induced interconnect resistive and capacitive parasitic deviation on propagation delay. These effects were observed for process corners of 130nm, 70nm and 45nm technologies. Monte Carlo simulations were run using distributed driver-interconnect-load model. The comparison between three technologies interestingly demonstrated that the effect of line resistive and capacitive parasitic variation on propagation delay has almost uniform trend as device size shrinks. However, resistive parasitic variation in global interconnects has very nominal effect on the propagation delay as compared to capacitive parasitic. Propagation delay variation is from 0.01% to 0.04% for a variation of line resistance from -6.1% to 25%. Similarly the delay variations were from -4.32% to 18.1 % due to capacitive deviation of -6.1% to 25%.
[6] Kaushik, Brajesh Kumar, Sarkar, Sankar and Agarwal, R. P. 2008. Crosstalk Analysis for a CMOS-Gate-Driven Coupled Interconnects. IEEE Trans. on Computer Aided Design of Integrated Circuits and Systems. vol. 27, no. 6 (June 2008) 1150-1154. [7] Kaushik, Brajesh Kumar, Sarkar, Sankar and Agarwal, R. P. and Joshi, Ramesh C. 2009. Crosstalk Analysis of Simultaneously Switching Interconnects. International Journal of Electronics, Taylor and Francis (UK), vol. 96, no.10 (October 2009) 1095-1114. [8] Kaushik, Brajesh Kumar, Sarkar, Sankar and Agarwal, R. P. and Joshi, Ramesh C. 2007. Effect of Line Resistance and Driver Width on Crosstalk in Coupled VLSI Interconnects. Microelectronics International, Emerald Pub. U.K., Vol. 24, no. 3 (August 2007) 42-45. [9] F. Kreupl, A. P. Graham, G. S. Deusberg, W. Steinhogl, M. Liebau, E. Unger, and W. Honlein, “Carbon Nanotubes in Interconnect Applications,” Proc. Microelectronics Engineering, vol. 64, no. 1-4, pp. 399-408, Oct. 2002. [10] A. K. Goel, High-speed VLSI Interconnections, WileyIEEE Press, Sep. 2007. [11] A. K. Geol, “Nanotube and other interconnects for nanotechnology circuits,” Proc. Electrical and Computer Engineering, 2008, pp. 000189-000192, May 2008. [12] Masuda, H., Ohkawa, S., Kurokawa, A. and Aoki, M. 2005 Challenge: Variability characterization and modeling for 65 to 90 nm processes. Proc. CICC 593–599. [13] Boning, D. and Nassif, S. 2001. Models of process variations in device and interconnect. Design of High Performance Microprocessor Circuits, Chandrakasan, A., Bowhill, W. J. and Fox, F. Eds. New York: Wiley, 2001.
5
Evolution in Networks and Computer Communications A Special Issue from IJCA - www.ijcaonline.org [14] Verma, K. G., Kaushik, B. K. and Singh, R. 2009. Effects of Process Variation in VLSI Interconnects: a Technical Review. Microelectronics International, Emerald Pub. U. K., Vol. 26, no. 3, (2009) 49-55. [15] Jarrar, A. and Taylor, K. 2006 On-Chip Variation and Timing Closure. Electronics Design, Strategy, News (EDN), June, 2006. [16] Verma, K. G. and Kaushik, B. K. 2010. Effect of Process Based Oxide Thickness Variation on the Delay of DIL System Using Monte Carlo Analysis. International Journal of Recent Trends in Engineering. Academy Publishers, Finland, Vol. 3, no. 4 (2010.) 27--31 [17] Verma, K. G., Kaushik, B. K. and Singh, R. 2010. Propagation Delay Variations under Process Deviation in Driver Interconnect Load System," International Conference on Advances in Recent Technologies in Communication and Computing (ARTCom), (Oct 2010) 408-410. [18] Verma, K. G., Kaushik, B. K. and Singh, Raghuvir. 2010. Propagation Delay Variation due to Process Induced Threshold Voltage Variation. Communications in Computer and Information Science, 1, Information and Communication Technologies, Springer, vol. 101, Part 3, (2010) 520-524.
[19] Verma, K. G., Kaushik, B. K. and Singh, Raghuvir. 2011. Monte Carlo Analysis of Propagation Delay Deviation due to Process Induced Line Parasitic Variations in Global VLSI Interconnects. International Journal of Computer Applications. April 2011. [20] Mehrotra, V., Nassif, S., Boning, D., and Chung, J. 1998. Modeling the Effect of Manufacturing Variation on HighSpeed Microprocessor Interconnect Performance. IEEE International Electron Devices Meeting (IEDM), (June, 1998) 767-770. [21] Harper, C. A. 2002. Electronic Assembly Fabrication: Chips Circuits Boards, Packages, and Components, McGraw- Hill (Maryland). [22] Verma, K. G., and Singh, Raghuvir, Kaushik, B. K. and Kumar, Brijesh. 2011. Monte Carlo Analysis of Propagation Delay due to Process Induced Line Parasitic Variations in VLSI Interconnects. Proc. IEEE Int. Conf. on International Conference on Networks and Computer Communications (ETNCC2011), (April 2011) 6-10. [23] Verma, K. G., Kaushik, B. K. and Singh, Raghuvir, 2011. Monte Carlo Analysis of Propagation Delay Deviation due to Process Induced Line Parasitic Variations in Global VLSI Interconnects. International Journal of Computer Applications Vol.20, no.1, (April 2011) 0975 – 8887.
6