Effect of Climatological Parameters on Propagation Delay through the Atmosphere. M. Maiti, M.Sc., M.Tech.1*, Ajay K. Datta, Ph.D.1, and P.K. Karmakar, Ph.D.2 1
Centre for Astroparticle Physics and Space Sciences, Bose Institute, Block-EN, Sector-V, Saltlake, Kolkata- 700 091, India. 2 Centre for Research and Training in Microwaves and Millimeterwaves, Institute of Radiopysics and Electronics, University of Calcutta, 92, A.P.C. Road, Kolkata- 700 009, India. E-mail:
[email protected]*
[email protected] [email protected]
Here, n, is the refractive index and is a function of pressure, temperature and water vapor pressure.
ABSTRACT This work examines the dependence of the meteorological parameters in determining propagation delay. It is found that variation of water vapor density and cloud liquid with height in addition to temperature variation plays a critical role in this phenomenon. It is shown that temperature lapse rate and wet adiabatic lapse rate play a major role. (Keywords: propagation delay, radio signals, water vapor density, cloud liquid, temperature lapse rate, wet adiabatic lapse rate)
INTRODUCTION Radio signals, while propagating through the atmosphere, suffer refraction. It is known that the refractive characteristics of the neutral atmosphere depends on its composition; mainly on ambient temperature and water vapor. Since water vapor is a polar molecule, the dipole moment is induced when microwaves propagate. Hence the water vapor molecules reorient themselves according to the polarity of propagation and cause a change in refractive index of the atmosphere. This refraction introduces uncertainties in the time of arrival due to excess path length or delay(cm) or range error ∆R, defined as: -6 h ∆R=10 0∫ N(h)dh
(1)
where, N is defined as refractivity and is given by: N=(n-1) 106
The Pacific Journal of Science and Technology http://www.akamaiuniversity.us/PJST.htm
(2)
The neutral atmosphere being a non-dispersive medium, the tropospheric range error estimation is only possible by using models based on easily available atmospheric parameters. These parameters were made available to the authors by the British Atmospheric Data Centre (BADC), U.K. The propagation delay has two main constituents. These are the dry path delay and wet path delay. The dry delay mainly depends on the amount of air through which the signal propagates. Hence it can be easily modeled with surface pressure measurements. The wet path delay depends on the precipitable water vapor in the column of air through which the signal propagates. Several methods for the estimation of wet path delay have been suggested by Roken et al. (1991). Amongst these, path delay or time delay have been estimated directly as a parameter derivable from the refractivity estimation over 0 0 some places of choice ranging from 22 N to 34 N of Indian subcontinent. Here, in this context, we have chosen three places: Kolkata (220N), India, with moderate humidity; Jodhpur (260N), India, a very dry location; and Srinagar (340N), India, with very less humidity.
THEORETICAL CONSIDERATION The term “delay” refers to change in path length due to change in refractive index during the propagation of radio signals through the atmosphere duly constituted by several gases.
–14– Volume 10. Number 2. November 2009 (Fall)
Their combined refractive index is slightly greater than unity gives rise to a decrease in signal velocity. This eventually increases the time taken for the signal to reach the receiving antenna (Adegoke and Onasanya, 2008). Besides this, bending of ray path also increases the delay (Collines and Langley, 1998). The refractivity as discussed in Equation (2) is divided into two parts. The term Nh is the refractivity due to gases of air except water vapor and called the hydrostatic refractivity. The term Nw is the refractivity due to water vapor and is called wet refractivity. Hence from Equation (1), we rewrite: ∆R=10-6 ∫Nhdh + 10-6 ∫Nwdh
(3)
The hydrostatic refractivity Nh and the wet refractivity Nw due to water vapor are respectively equal to: Nh =k1 [Pd/T]
(4)
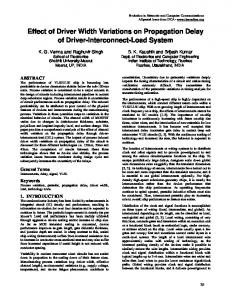
dry component of atmospheric refractivity comes from an altitude extending from surface to lower stratosphere. The prediction of its variability although spatial and temporal is found to be easier in comparison to wet components of atmospheric refractivity which shows significant temporal and spatial variability depending on variation of atmospheric water vapor. The first term in Equation (6) shows that partial pressure due to dry gases and the corresponding temperature play a major role in determining dry refractivity. In this respect. we have chosen three major cities for which variation of pressure and temperature with height is shown in Figure 1 and Figure 2 respectively on a particular day of th monsoon months (ie., 6 June 2005). It would be noted interestingly that during monsoon months, the radiometric measurements at Kolkata reveals a value of 60 Kg/m2 water vapor content (Karmakar et al.,1999). This happens also during the first week of June. This is the reason of selecting the last day of the first week of June for furthering our study.
and Nw =k2 [Pw/T]+k3 [Pw/T2]
(5)
The best average rather than best available coefficients provides a certain robustness against un-modeled systematic errors and increase the reliability of K values, particularly if data from different laboratories can be averaged. However, the best available co-efficient according to Riieger (2002) are given by: K1=77.674 ± 0.013 k/hpa K2=71.97 ± 10.5 k/hpa K3=375406 ± 3000 k/hpa where, Pd is the partial pressure due to gases; Pw is the water vapor pressure and T is the ambient atmospheric temperature(Kelvin). Hence, the total refractivity Nr (ppm) is given by: Nr=77.67Pd/T+71.97Pw/T+375406Pw/T2
(6)
AMBIENT ATMOSPHERIC TEMPERATURE AND PRESSURE India being a tropical country with variety of climatic conditions, ranging between 80 N to 360 N, the study of hydrostatic delay using the radiosonde data would be an addition to the studies on navigational aids. The contribution to The Pacific Journal of Science and Technology http://www.akamaiuniversity.us/PJST.htm
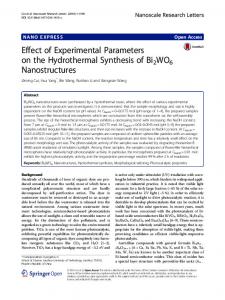
From Figure 2, it is revealed that over Srinagar where the ground temperature is substantially low and the temperature linearly decreases with height up to 3.1 km and again it rises linearly up to a height 5.8 km and again decreases with height. So over Srinagar, temperature inversion occurs twice: once at around 3 km and the the second time around 6 km. But over Jodhpur, the inversion occurs at around 0.7 km and 1.4 km. Over Kolkata it happens only at around 0.7 km. From Figure 2 it appears that the thickness of inversion layer is large over Srinagar and it is about 3 km. This large thickness in Srinagar in comparison to the other two places is due to the fact that hills in Srinagar during mid-night favors the situation of forming large thickness of radiative cooling of the surface drains from the slopes and uplands into adjacent areas. Because of air drainage, freezing temperature occurs more frequently on bottomlands than on nearby hillsides (Trewartha and Horn, 1980). Besides this, it may be mentioned that Srinagar during the month of June, is mostly covered with snow. This snow covered surface gets heated very little due to reflection of solar energy. Moreover, it retards the upward flow of heat from the ground at night. On the other hand, Jodhpur being a desert area it contains a porous sandy soil with low heat conductivity which lowers the temperature of the air layer next to the ground.
–15– Volume 10. Number 2. November 2009 (Fall)
A
Figure 1: Variation of Pressure with Height at Three Locations.
B
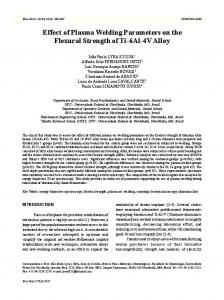
Figure 2: Variation of Temperature with Height at Three Locations. We know that lapse rate is defined as the rate of decrease in temperature with height. A temperature inversion means a negative lapse rate which are pictorially presented in Figures 3(a), (b), and (c) at thee locations respectively. It is seen from all the three cases that there occurs a negative lapse rate over Srinagar at around 5.5 K/Km and those over Jodhpur and Kolkata are 43 K/Km and 1100 K/Km.
The Pacific Journal of Science and Technology http://www.akamaiuniversity.us/PJST.htm
C
Figure 3 (a), (b), (c) : Variation of Temperature Lapse Rate with Height at Three Locations.
–16– Volume 10. Number 2. November 2009 (Fall)
So it may be concluded that Kolkata being mostly covered with lands and buildings, the ground behaves as a better radiator of heat than air above it. Hence the land cools first and then through conduction and radiative exchanges between the lower layers of air and land, the air nearest the ground becomes coldest. This rate of decrease of temperature with increasing height is generally called dry adiabatic lapse rate. But as the air parcel of unsaturated air rises beyond 3.1 Km over Srinagar and cools adiabatically, it will become saturated (ie., the relative humidity becomes 100 percent). If the air rises further, condensation begins and cloud forms. This is again verified by exploring the rate of water vapor density variation with height (Figure 4).
Jodhpur, being a desert area takes a zero value at about 5.8 Km. According to the same argument favoring the formation of cloud, it may be cited as that the formation of cloud over Jodhpur starts at about 5.8 Km and that over Kolkata it starts at about 3.1 Km. Beyond these height some of water vapor condenses into liquid water droplets in the cloud and corresponding latent heat is released to air. Nevertheless, the cooling due to expansion of rising air is greater than the latent heating so that the temperature of air continues to decrease but at a slower rate which we call as adiabatic wet lapse rate. This is because, the saturated warm air contains much more water vapor than saturated cold water.
ESTIMATION OF REFRACTIVITY Following Equation (6), it is found that dry refractivity follows the combination of partial pressure and temperature. As dry pressure is mainly due to the molecules other than water vapor, it is highly stable and subsequently the dry refractivity shows also a highly stable configuration. To exemplify the situation we have analyzed the whole set of data of 2005, over Kolkata and it is revealed there that the dry refractivity varies between 100 to 250 ppm from the respective height of 11 Km up to ground (Figure 5), depending upon pressure and temperature profiles.
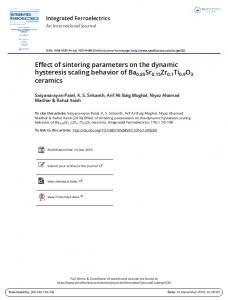
Figure 4: Variation of Water Vapor Density with Height at Three Locations. But the conditions of variations of water vapor density (ρ) variation with height over Jodhpur and Calcutta were entirely different. The analytical formulation of water vapor density were found to be: ρ =29.43 exp(-h/2.05), over Kolkata ρ =18.90 exp(-h/1.77), over Jodhpur ρ =15.33 exp(-h/4.08), over Srinagar The value of dρ/dH becomes faster over Calcutta than that over Jodhpur. This value of dρ/dH over The Pacific Journal of Science and Technology http://www.akamaiuniversity.us/PJST.htm
Figure 5: Variation of Refractivity with Height at Kolkata.
–17– Volume 10. Number 2. November 2009 (Fall)
On the other hand, the wet refractivity over Kolkata shows a change of slope at around 3.1 km (Figure 5) which is in conformity with the change in dT/dH versus height (H) and effect has also been observed in the change of dρ/dH around 3.1 km. So, it may be concluded that the wet refractivity change with height is predominantly determined by temperature and water vapor profile also. Otherwise, if it is due to temperature only there would have been a change in slope in variation of dry refractivity with height. But no such thing happens in this case (Figure 5). While summing up the dry and wet refractivity we have observed the same type of slope change as those observed in change of wet refractivity as indicated in Figure 5. This idea is again supported by observing the variation of dry, wet and total refractivity with latitude. It is also observed (Figure 6) that dry refractivity dose not vary much with latitude which is considered to be temperature and pressure dependent. But as the water vapor content over 0 Kolkata(22 N) is pretty large i,e., about 60-70 2 kg/m (Karmakar et al.,1999) in comparison to Jodhpur (260 N) and Srinagar(340 N), the wet refractivity also always assumes a large value (≈177 ppm) over Kolkata than those at high latitudes, where wet refractivity over Srinagar is least.
Figure 6: Variation of Refractivity with Latitude at Three Locations.
The Pacific Journal of Science and Technology http://www.akamaiuniversity.us/PJST.htm
ESTIMATION OF DELAY (CM) It has already been discussed in the previous sections that the dry refractivity depends upon pressure and temperature but the wet refractivity depends predominantly on water vapor concentration also besides the ambient temperature and pressure. Now, to find out the variation of delay(cm) over all the three places of choice, we have used Equation (1) and integrated up to a height 0-10 Km. Hence these delay variations with temperature and water vapor density, were presented in Figures 7, 8, and 9 for the respective places. If we compare Figure 3 and Figure 7(a) and (b), we find that at around 305 K at Kolkata, the inversion occurs around 0.7 Km. It is interesting to note that although the water vapor density profile is almost a smooth exponential, the dry and wet delay variation with temperature and water vapor density show a prominent inversion at around 0.7 Km at Kolkata. Hence, we may conclude that at Kolkata the delays are mostly affected by temperature although water vapor may play a major role in determining the integrated value of delay. But on the other hand, if we compare Figure 3 and Figure 8 for Jodhpur, no inversion occurs there due to change in water vapor density and hence the delay term is predominantly independent on variation of water vapor density.
Figure 7: Variation of Delay with Temperature and Water Vapor Density at Kolkata.
–18– Volume 10. Number 2. November 2009 (Fall)
be humid such as Kolkata, the water vapor plays a major role in determining the delay term. In other words, we may say that it is better to look at the variation of water vapor density with height (ie., dρ/dH) in addition to dT/dH (ie., the temperature lapse rate). It is interesting to note that over humid location (Kolkata) and hilly areas (Srinagar), the cloud formation starts at a lower height where the delay is predominantly determined by temperature and water vapor density and cloud liquid. But at a location where the cloud resides at relatively higher height [i.e., at dry location (Jodhpur)] the delay term is mostly dependent on temperature).
CONCLUSION Figure 8: Variation of Delay with Temperature and Water Vapor Density at Jodhpur.
The expressions representing the refractivity and hence the delay term are seen to be sufficiently good for the places where the humidity level is less but for humid location and hilly areas it is suggested that the inclusion of water vapor and cloud liquid are quite necessary. The approximate dependence of this water vapor and cloud liquid will be taken up by the present authors and be communicated in near future. However, the phase delay induced by cloud droplets can also be approximated using the calculations based on permittivity. Besides these, the presence of water vapor also produces some absorption of microwave signal propagating through the atmosphere (Adegoke et al., 2008). But this type of absorption is insignificant in low frequencies except over long path.
REFERENCES
Figure 9: Variation of Delay with Temperature and Water Vapor Density at Srinagar. Similarly, over Srinagar (Figure 9) where the wet refractivity is minimum, we find the inversion of delay occurs when the water vapor density becomes 6 gm/ m3 . This happens eventually at low altitude of about 3 km or less where cloud liquid may play a major role in determining the delay over Srinagar. Hence it is concluded that we are to take care of inclusion of water vapor density and cloud liquid also while calculating the delay over the places of choice. Had the location The Pacific Journal of Science and Technology http://www.akamaiuniversity.us/PJST.htm
1.
Adegoke, A.S. and M.A. Onasanya. 2008. “Effect of Propagation Delay on Signal Transmission”. Pacific Journal of Science and Technology. 9(1):13-19.
2.
Collins, P. and R.B. Langley. 1998. “Tropospheric Propagation Delay. How bad it be?”. Presented at the ION GPS-98. 11th International Tech. Meeting of Satellite Division of ION. Nashville, TN, 15-18 Sept. 1998.
3.
Karmakar, P.K., S.Chattopadhyaya, and A.K. Sen. 1999. ”Estimates of Water Vapour Absorption over Calcutta at 22.235 GHz.”. Int. J. Remote Sensing. 20(13):2637-2651.
4.
Rocken, C., J.M. Johnson, R.E. Neilan, M. Cerezo, J.R. Jordon, M.J. Falls, L.D. Nelson, R.H. Ware, and M. Hayes. 1991. “The Measurement of
–19– Volume 10. Number 2. November 2009 (Fall)
Atmospheric Water Vapor Radiometer Comparison and Spatial Variations”. IEEE Trans. Geoscience and Remote Sensing: 29(1): 3-9. 5.
Rueger, M.J. 2002, “Refractive Index formulae for Radio waves”. FIG XXII International Congress, Washington D.C. April 19-26.
6.
Sen, A.K., P.K. Karmakar, A.K. Dasgupta, M.K. Dasgupta, O.P.N. Calla, and S.S. Rana. 1990. “Radiometric Studies of Clear Air Attenuation and Atmospheric Water Vapour at 22.235 GHz Over Calcutta”. Atmospheric Environment (Great Britain). 1909-1913.
7.
Trewartha, G.T. and L.H. Horn. 1980. An Introduction to Climate. McGraw-Hill: New York, NY.
P.K. Karmakar obtained his Ph.D. (Tech) degree from Calcutta University in 1990. He is working in the Department of Radiophysics and Electronics, Calcutta University since 1988. He has more than 40 publications in national and international journal along with 30 conferences articles. He has been awarded the Young Scientist Award of URSI in the tear 1990. He had also served at the Remote Sensing Laboratory, University of Kansas, USA as a visiting scientist. He has also been awarded the South-South Fellowship of TWAS to act as a visiting scientist at the Center for Space Sciences, China in the year 1997. He also acted as visiting scientist at INPE, Brazil during February- March, 2009. His current area of research includes microwave/millimeterwave propagation and remote sensing, modeling of atmosphere and microwave communication, etc.
ABOUT THE AUTHORS M. Maiti obtained his M.Sc. in Electronics Science from Calcutta University in the 1996 and M.Tech. in Microwaves from Burdwan University in 1999. He has been engaged in research in various subjects like communication, radar cross section instrumentation at various bands, radiometric studies of the atmosphere, studies of atmospheric phenomenon by 94 GHz radiolink and radiometers at 22. 235, 31.4, 53.5, 94 GHz since 1999. He has two publications in national and international journals. Presently he is engaged in research work as a research scientist in Bose Institute, Kolkata.
SUGGESTED CITATION Maiti, M., A.K. Datta, and P.K. Karmakar. 2009. “Effect of Climatological Parameters on Propagation Delay through the Atmosphere”. Pacific Journal of Science and Technology. 10(2):14-20. Pacific Journal of Science and Technology
Ajay Kumar Datta was born in Kolkata, India in 1959. He received his Integrated Master degree in Applied Physics (Electrical Eng.) and Ph.D. degree in Radiophysics and Electronics, both from Calcutta University, India in 1986 and 2001, respectively. He has been engaged in research since 1988, in various subjects like radar cross section (RCS), imaging methodology, and instrumentation at various bands, radiometric studies of the atmosphere in the emission and absorption modes, scanning radiometry for the studies of atmosphere, studies of atmospheric phenomenon by 94 GHz radiolink, and radiometers at 22. 235, 31.4, 53.5, 94 GHz. He has published 16 papers in national, international journals, and symposiums. Presently he is engaged in research work as a research scientist in Bose Institute, Kolkata.
The Pacific Journal of Science and Technology http://www.akamaiuniversity.us/PJST.htm
–20– Volume 10. Number 2. November 2009 (Fall)