Aug 26, 2003 - Symposium on Diaporlicr for Electric Machines, Power Electronics and Driver. Atlanta ... Machine vibration analysis and motor current spectral.
SDEMPED 2003 Symposium on Diaporlicr for Electric Machines, Power Electronics and Driver Atlanta, C& USA 24-26 August 2003
Effect of Load on Detecting Mechanical Faults in Small Induction Motors Ramzy R.Obaid and Thomas G. Habetler School o f Electrical and Computer Engineering Georgia Institute o f Technology Atlanta, GA 30332-0250 USA Phone : (404) 894 9829 Fax : (404) 894 4641 Email : thahetlerfZ?ee.natech.edu Abstract- Mechanical conditions, such as load unbalance and shaft misalignment in induction motors can be detected by monitoring specific eamponmts in t h e stator current frequency spectrum. Previous work tested these mechanical conditions for the cases o f no-load and full-load Conditions in small induction motors, assuming that the eliect of load on the detection scheme between these W Oconditions is linear. This paper examines the effect of changing the load of the motor on detecting these mechanical conditions in both the current and vibration spectra. The paper shows that the spectral components associated with meehanical conditions do not always linearly change as the load varies. I t shows that other factors, such as mechanical resonance in the coupled system^, affect these spectral components. Experimental results for testing different types of mechanical faults, with the load changing from no-load to MIload, are shown.
1. 1NTRODUCnON Machine vibration analysis and motor current spectral analysis (MCSA) have recently been widely used for the pulpose o f condition monitoring and detection o f mechanical faults in induction machines. When applying these methods, usually certain load conditions are considered, mainly, noload and full-load conditions. Loading the induction motor causes the motor to become stiffer, which dampens the This might cause some o f the mechanical vibrations. harmonics of interest in the vibration spectrum to be undetectable with load. On the other hand, loading the motor reduces the noise i n the current signal, which makes it more feasible to detect the components o f interest in the current spectrum with load. Previous work [ I ] tested some mechanical conditions for the cases o f no-load and full-load conditions in small induction motors, assuming that the effect of load on the detection scheme between these two conditions i s linear. This paper examines the effect o f changing the load of the motor on detecting these mechanical conditions. Loading an induction machine typically affects the stator current in two ways. The first i s that it makes the motor runs
0-7803-7818-5/03/$17.00 0 2 0 0 3 IEEE
stiffer. This dampens the overall motor vibration and the lower components of the stator current frequency spectrum. The second effect i s that changing the load level i s directly related to changing the slip. T h i s causes the stator current frequency components associated with mechanical fault conditions to he shifted because these components are slip dependent. These two effects may influence the accuracy of indicating fault severity o r the ability to detect the frequency harmonics associated with mechanical fault conditions. Moreover, mechanical resonance may occur when changing the load level i f the resulting rotor speed resonates with the machine or the machine mechanical system. Mechanical resonance may cause the frequency components io increase drastically, and therefore, may he incorrectly diagnosed as a fault condition. In this paper, the effects of changing the load level on detecting mechanical fault conditions are examined. In many industrial applications, the load in the normal course of operation can typically vary between 25% and 100%. Therefore, it i s important to validate that mechanical unbalances at these load levels are detectable. This paper shows the results o f testing different mechanical conditions with the load swept from no-load to full-load. I t i s also important to note that in this paper, only constant speed applications, such as fans and pumps are considered when examining load variation effects on mechanical fault detection. Applications that operate under varying load conditions as well as variable speeds, such as an elevator are not considered.
307
II.
MECHANICAL FAULTSIGNATURES IN THE VIBRATION ANDCURRENT SPECTRA
In the vibration signal of the induction motor frame, mechanical fault conditions, which are associated with the mounting and operation of the machine, are reflected in the 56, where is the rotating low frequency range (0 frequency) [2]. For example, rotor unbalances and shaft
-
misalignment or bending can significantly increase the components at n-f, where n is the harmonic number. In addition to these components, a loosening in a mounting bolt would also generate sub-harmonics at 0.56 and 0.336. By monitoring- these components using signature analvsis of the machine vibration, the presence of the mechanical fault conditions associated with these components can be detected. Mechanical fault conditions can also be detected by monitoring the appropriate frequency components of a single phase of the stator current [3- 51. The basic concept is that a rotating fault modulates the air-gap of the motor, creating variations in the air-gap flux density, which in turn, affects the inductances ofthe machine. This produces stator currents at predictable frequencies, f-. As a result, harmonics at rotating frequency sidebands of the line frequencyf, become evident with the presence of that fault. In general, the location of these frequency sidebands can he predicted by
_ _
where5 is the rotating frequency, and h and m are integers. For k = m = 1, the frequency sidebands in (1)reduceto f#fF It has been shown previously [ I , 61 that the presence of a mechanical condition such as load unbalance and shaft misalignment in induction motors can he detected by monitoring the components f#-f in the stator current frequency spectrum. This was shown to give as good indication as monitoring the components n-fin the vibration, where n is an integer. It was shown that when monitoring the vibration, load unbalance mainly affects 6, while misalignments mainly affect 35. By examining (I), it can be seen that the frequency sidebands in the current are in fact overlapped by many components resulting from the same mechanical condition. For example, for a four-pole motor, where5 is 30 Hz at no load, the frequency sidebands 60% in the current will yield 30 and 90 Hz. This is for k = m = 1 in ( I ) . However, other values for m and k also yield the same components. The lower sideband k$ - m-f ,withf, = 60 Hz andf,=30 Hz will have the following values:
kl and m=3
=>he< = 160-901
X-3 and m=5 =>&
= 30 Hz,
(2)
Hz,
(3)
Hz,
(4)
= 1180-1501 = 30
k=3 and m=3 =>& = 1180-901
= 90
k=l and m=5 =>Le= 160-1501
= 90 Hz.
spectral components in the current are in fact a resultant of many components in the vibration, and thus, the plot of the vibration components may differ fmm that of the corresponding current components. Ill.
EXPERIMENTS WITH VARYING LOADCONDITIONS
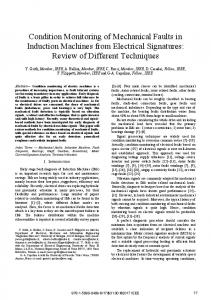
To examine how the load affects the detection of mechanical conditions, a four-pole, 5 H P induction motor was tested in the lab for rotating load unbalance and angular and radial shaft misalignments. The line frequency,f, was 60 Hz, and since the motor is a four-pole, -f is 30 Hz at no-load. Each fault condition was induced mechanically to different degrees of intensity and the stator current and frame vibration were measured while the load level was varied from no-load to full-load. For each mechanical fault condition, the rms values of the frequency sidebandsf#% in the current, and the components n-f in the vibration were computed and recorded. The computed rms values were then plotted against the percentage of load for each severity level in each fault condition. Load Unbalance Load unbalances were implemented by placing a steel bolt and nut on a balanced metal disk at different radial distances from the motor shaft. The disk has six holes drilled consecutively in radial distances from the motor shaft, with a separation of one inch between each two consecutive holes. Five levels of unbalances at different radial distances from the rotor shaft were tested. Figs. I and 2 show plots of the rms values of the componentf, in the vibration and 60% in the current, respectively. Each set of r m s values is plotted against the percentage of load for this mechanical condition.
(5)
The sidebands 60% in the current are usually thought of as the resultant of only the vibration component 1; modulated around 60 Hz. Nevenheless, the computations in (2) through ( 5 ) show that the same sidebands result from the modulation of the components 31; and 55 as well. This means that the
308
Percentage of Load
Fig. I : Vibration component,/, (rrns) versus percentage of load at different Icvels ofload unbalance
the current for unbalances is not present in the case of angular misalignment. In Fig. 4, the amplitudes of the components 35 in the vibration increase with the increase ofthe level of angular misalignment. They also decrease with the increase ofload from 0% to 100%. However, the components 35 drastically increase at 25% load because of mechanical resonance. It is interesting that this mechanical resonance is not reflected on the components 6&5 in the current. However, this resonance is evident in the plot shown in Fig. 5 of the component 60+3J in the current, which is a reflection of 3 5 in the vibration.
"0
25
50
75
too
Percentage of Load
Fig. 2 Current components, & (rms) I+ v e/ r, m percentage of load at different levels of load unbalance.
In both plots, it is clear that the amplitudes of these components increase with the increme of the level of load unbalance. In the vibration, the amplitude o f 5 decreases monotonically with the increase ofload from no-load to fullload. However, in the current, the amplitudes of the components 60% decrease with the increase of load from 50% load to full-load, but draslically increase from no-load to 50% load. The change in the trend in the current is mainly caused by the metal disk that is used for creating the unbalance. It is shown later that this change does not occur when the disk is removed while testing for misalignments. The metal disk, which is installed on the shaft of the motor, seems to be causing a drastic change in the air-gap of the motor at these load conditions and, consequently, is reflected as a large increase in the current. However, this relative movement in the air-gap is not detected by the vibration sensor Angular Misalignment Angular misalignments were created by rotating the machine at specific angles from the original position aligned with respect to the shaft of its coupled load. Four levels of angular misalignment with the machine rotated at IO, 20, 30, and 40 seconds were tested. Fig. 3 shows plots of the rms values of the components 60% in the current, and Figs. 4 and 5 show plots of the rms values of the components 35,which are the components of interest in detecting misalignments in the vibration, and 60+35 in the current, respectively. Each set of rms values is plotted against the percentage of load for this mechanical condition. It is clear, from Fig. 3 that the amplitudes of the components 60% in the current increase with the increase of the level of angular misalignment. The components 6OhJ also monotonically decrease with the increase of load level from 0% to 100%. It is important to note that since the metal disk used for unbalances is not installed in this experiment, the unusual increase at 25% and 50% load that was shown in
Radial Misalignment Radial misalignments were created by installing additional shims of specific thickness under the base of the machine to lift it upward with respect to the shaft of its coupled load. Four levels of radial misalignment with the machine lifted by 0.02, 0.025, 0.03,and 0.035 inch were tested. The results of testing this type of mechanical fault were similar to the results of testing angular misalignments. I
I
Percentage 01 Load Fig. 3. Current components, 60% (rms) versus percentage of load a1 different levels of angular misalignmenl.
P e r c e n t a g e 01 Load
Fig. 4: Vibration component, 3/, (rms) versus percentage o f load a1 diNeren1 levcli ofangular misalignment
I
I
I
I
500
;o
Io
io
io
bo $0 Percentage of Load
o;
do
o;
100
Fig. 5: Current component, 60+3$ (rms) Venus percentage of load at different levels ofangular misalignment.
Fig. 7: Vibralion component, 3$ (rms) versus percentage of load at different levels ofradial misalignrnenl.
Figs. 6, 7, and 8 show plots o f the tms values o f the components 60% in the current, 35 in the vibration, and 60+3f, in the current, respectively. Each set of rms values is plotted against the percentage o f load for this mechanical condition. In Fig. 7, the amplitudes of the components 35 in the vibration increase with the increase of fhe level o f radial misalignment. They also decrease with the increase of load from 0% to 100%. However, the components 3 5 drasficdy increase at 10% load because o f mechanical resonance. Again, this mechanical resonance is not reflected on the components 60% in the current. However, this resonance is evident in the plot shown in Fig. 8 o f the component 60+35 in the current, which i s a reflection of 35 in the vibration.
20-
zE 15 g 3 to5-
\
00
*
;o
lo
lo
do
Qo
60
o;
Percentage O f Load
do
do
too
Fig. 8. Current component, 613t3J(rmr) versus percentage of load at different level^ of radial miwlignment.
IV. CONCLUSION
'
;o
Miralignmen
Miralignmenl *vel \I __L
00
I t i s impoliant to note that the results presented in this paper are repeatable. The same experiments were repeated on another motor, and similar results to those presented in this paper were obtained.
1
"""