Effect of normalization method on image uniformity and binding potential estimates on microPET® Marie-Laure Camborde, Arman Rhamim, Danny F. Newport, Stefan Siegel, Ken R. Buckley, Eric Vandervoort, Thomas J. Ruth and Vesna Sossi, Member, IEEE
Abstract--This study investigates different detector normalization procedures for a small animal scanner, specifically the Concorde microPET® R4. The procedures were compared in terms of: (i) image uniformity, (ii) performance as a function of count rate, and (iii) impact on the estimate of the binding potential (BP) in brain rat studies. Image uniformity studies were performed on two cylindrical phantoms of 11 different size filled with an aqueous concentration of C (38 kBq/mL and 615 kBq/mL). BP was estimated with the Logan 11 11 graphical approach on 12 C-Methylphenidate and 9 CDihydrotetrabenazine rat studies processed with all the normalization procedures. Results/Conclusion: We found that: 1) the combination, the geometry normalized combination, the component-point, and the geometry normalized component procedures significantly improve radial image uniformity compared to the direct-point and direct-cylinder procedures, 2) the geometry normalized combination procedure seems to provide the best radial and axial uniformity, 3) a mismatch between the count rates at which the normalization and the emission scans are acquired degrades the axial uniformity by 47% to 98% whereas this effect was not observed for radial uniformity, and 4) the difference in BP values obtained from data corrected with different normalization procedures is as high as 15% for normal striatum and 75% for lesion striatum. I.
INTRODUCTION
Detector normalization factors in PET are required to correct for non-uniform detector efficiency response. The first normalization method developed for 2D PET scanners was the direct inversion method. In direct inversion the elements of the normalization correction factors are obtained by scanning a uniform source (typically rod sources or a uniform cylinder) centrally placed in the Manuscript received October 4, 2004. This work was supported in part by NSERC, MSFHR and the Triumf Life science grant. M.-L. Camborde, V. Sossi, A. Rhamim and E. Vandervoort are with the University of British Columbia, Vancouver, BC V6T 1Z1, Canada (email:
[email protected];
[email protected];
[email protected];
[email protected]) D. F. Newport and S. Siegel are with CTI Concorde Microsystems LLC, Knoxville, TN 37932, USA (email:
[email protected] ;
[email protected]) K. R. Buckley and T. Ruth are with TRIUMF, Vancouver, BC V6T 2A3, Canada (email:
[email protected],
[email protected])
0-7803-8700-7/04/$20.00 (C) 2004 IEEE
scanner field of view (FOV) and normalizing the number of events in each line of response (LOR) to a global average value. With the development of 3D PET scanners, the requirement to include oblique LORs increased the number of LORs by an order of magnitude and in order to achieve data of the statistical quality necessary to obtain accurate normalization factors very long acquisition times were required [1]. The next normalization methods to be introduced were indirect or component-based methods. These methods entail expressing the normalization correction factors as a product of a geometric and an intrinsic efficiency component. These basic components were first proposed by Hoffman et al. [2]. The efficiency factors account for the non-uniformity of individual detector response (which may vary over time) while the set of fixed correction factors is related to the geometry of the scanner. These factors are then combined to form the overall normalization factors that are applied to the data typically prior to reconstruction [3]. The performance of the normalization methods used in our study has been thoroughly studied on human scanners [4]. In general, approaches adopted for 3D human PET scanners are either (i) direct inversion methods with a 3D scan of a uniform cylinder or a rotating line source [4-5] or (ii) componentbased methods using a 2D [6] or a 3D rotating rod sources scan to calculate the geometrical factors and a 3D scan of a uniform cylinder, a rotating uniform plane, or moving line source to calculate the efficiency factors [4,7-9]. Furthermore 3D PET suffers high frequency image artifacts when there is a count rate mismatch between the normalization and the emission acquisitions. This effect is due to event mispositioning when using detector blocks as a consequence of pulse pile up as shown by Germano et al. [10]. Possible solutions to this problem have been addressed by Badawi and Marsden [11,12]. The goal of the present study is to evaluate normalization procedures for an animal scanner, specifically the Concorde microPET® R4. Characteristics and performance evaluations of this scanner have been previously described [8,13], but no optimal normalization procedures have yet been investigated. Briefly, the system consists of 24 detector modules arranged
0-7803-8701-5/04/$20.00 3467 (C) 2004 IEEE
in a ring with each module containing four position sensitive photomultipliers coupled to an 8x8 LSO crystal matrix. The useful radial FOV of the scanner is 100 mm with a 78 mm axial extent. Transmission scans are acquired 68 using a Ge point source moving spirally through the FOV. In this study we investigate four different normalization correction schemes in terms of image uniformity and robustness as a function of count rate. Furthermore we evaluate their effect on a particular biological parameter, the binding potential (BP), which is often the final outcome of a PET study. In doing this we assess the impact of the different normalization procedures on a biologically relevant outcome of PET imaging. Although these studies have been performed on a specific animal scanner the general conclusions and methods can be extended to many small imaging cameras.
procedure was acquired using a short-lived isotope (11C) to provide a range of count rates in order to minimize the count rate influence. Procedure
(ii) Direct-point (iii) Component point (v) Geometry normalized component
Acquisition Source type duration and activity
10 hr
Average Total count number of rate counts
7.5MBq 68Ge 1.6x10⁵ 5.7 billion ct/s point source
11.25MBq 11C 5x10⁴ 0.3 billion 7cm diameter ct/s cylinder 6.3 MBq 68Ge (iv) Combination 2hr point point source + 6.6x10⁴ (vi) Geometry source + 1 0.4 billion ct/s 87.6MBq 11C normalized combination hr cylinder cylinder (i) Direct-cylinder
2 hr
Table 1 Acquisition details for all normalization procedures II. MATERIAL AND METHODS Three normalization methods using two types of sources yielding six normalization schemes were investigated for both phantom and rat data: (i) a direct inversion method with a uniform cylindrical source (direct-cylinder), (ii) a direct inversion with a rotating point source (direct-point), (iii) a component based method using the same point source (component-point), (iv) a component based method using the point source to calculate the geometric factors and a uniform cylinder acquisition to estimate the intrinsic detector efficiency factors (combination), (v) a geometry normalized component using the same point-source, and (vi) a geometry normalized combination using identical sources to the combination procedure. The two direct inversion normalization data sets were acquired by normalizing the number of counts in each LOR to the number of counts averaged over all possible LORs after correcting for geometry and attenuation [1,5]. The two component based normalization methods factor the LOR measurements into geometric and efficiency components as proposed by Casey et al. [14]. The component-point method derives all of the factors from a single rotating point source acquisition. It should however be noted that, in principle, for the combination and the geometry normalized combination procedure, the rotating point source acquisition is only required when detectors are replaced or a system setup occurs. Finally, the geometry normalized component and geometry normalized combination methods are identical to the component-point and combination procedures except that the efficiency is normalized in the transaxial and axial direction. The data acquisition scans used to calculate the normalization correction factors are described in Table 1. The normalization factors calculated using the component based method were obtained from the same point source scan that was used for the calculation of the direct-point correction factors. The combination normalization factors were calculated from a 1-hour cylinder scan (efficiency factors) and a 2-hour point source scan (geometric factors) (see Table 1). The cylinder scan for the combination
0-7803-8700-7/04/$20.00 (C) 2004 IEEE
A. Phantom studies Two studies were performed using cylindrical phantoms of 5 and 6 cm diameter to evaluate if the relative performance of the methods depends on the size of the object being imaged. All studies were corrected for randoms, dead time, attenuation, and scatter before reconstruction. All studies were reconstructed with Fourier re-binning followed by filtered back projection. Study 1. We first investigated the influence of the mismatch between the count rate of the emission scan and the normalization scan on the accuracy of the normalization procedure. Emission data were obtained from a 4-hour long scan of a 5 cm diameter phantom filled with an aqueous 11 solution of C with a total initial radioactivity of 87.2 MBq 6 (starting count rate: 10 ct/s). At the end of the scan the count rate dropped to approximately 525 ct/s. A 10 min 68 singles-based transmission scan with a Ge point source was acquired before the emission scan. Data were binned into 24x600 second scans. Radial and axial uniformity were used as figures of merit and were evaluated for 3 selected 5 frames with count rates corresponding to: 1) 7x10 ct/s (high count rate), 2) a count rate matching the average count rate at which the normalization data were acquired (match count rate), and 3) a count rate matching a typical rat study of 4 around 2x10 ct/s (rat count rate). Study 2. Uniformity analysis was performed on data obtained from separate scans of each phantom. To accomplish this we used the 5 cm diameter phantom scan described for the first study but re-binned it so that the number of counts in the frame matched the 6 cm diameter phantom scan. The 6 cm diameter phantom was filled with 11.3 MBq and scanned for 30 min with an average count 4 rate of 6x10 ct/s. A 10 min singles-based transmission scan 68 with a Ge point source was acquired before the emission scan. The influence of normalization procedures was evaluated on emission data corrected for attenuation with the two methods most commonly used in microPET® imaging: measured and segmented attenuation correction.
0-7803-8701-5/04/$20.00 3468 (C) 2004 IEEE
B. Rat studies Each animal was injected with 3.7 MBq/100g and scanned for 1-hour. A 10 min singles-based transmission 68 scan with a Ge point source was performed before 11 emission scans. Analysis was performed on 12 C11 Methylphenidate and 9 C-Dihydrotetrabenazine rat scans. All rat studies were reconstructed with all six normalization procedures. C. Figures of merit and analysis. Phantom studies. Axial uniformity was evaluated by plotting the axial distribution of a region of interest (ROI) encompassing the phantom image. All profile uniformities were quantitatively assessed by calculating the coefficients of variation (COV) for values in the flat range of the curve (skipping the first and last 6 planes for axial profiles and skipping the first and last 18 and 14 cm for the 5 cm and 6 cm radial profiles). Rat studies. Logan analysis [15] was performed on time activity curves (TAC) obtained from ROIs placed on the right and left striatal image averaged over three planes. The cerebellum was used as a reference region. Cerebellar ROIs were placed on two contiguous axial planes that were generally located approximately 1.2 cm away from the striatum. Binding potentials obtained from TAC curves were extracted and compared to the BP values obtained from the point-direct normalization procedure, which were used as references. III. RESULTS AND DISCUSSION A. Phantom studies Study 1. We found that axial image uniformity degraded significantly when there was a large mismatch between the count rate at which the emission scan was acquired and that at which the normalization scan was performed, similarly to what was previously observed for human size scanners [10]. This is, to a varying degree, true for all normalization procedures even for the combination procedure where the normalization data were acquired over a large count rate range. The COV in the match count rate compared to the high count rate was 47% smaller (0.03524 versus 0.05178) in the combination procedure, 54% smaller (0.03754 versus 0.07429) for the component-point procedure, and 98% smaller (0.04585 versus 0.07056) for the direct-point procedure indicating that the combination procedure is the most robust normalization with respect to count rate mismatches. Residual crystal structure is visible for all normalizations in the axial profile for the high average count
0-7803-8700-7/04/$20.00 (C) 2004 IEEE
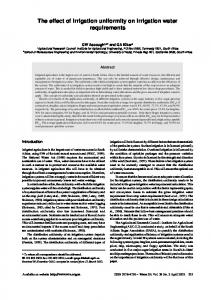
rate emission scan, while it almost entirely disappears in the profiles obtained from the match and rat count rate scans (Figure 1). Smaller differences in COV values were observed between match and rat count rate (10% for combination, 5.5 % for cylinder, and 1.2% for componentpoint). Consequently when choosing the amount of activity for a normalization scan, care should be taken to match the expected average count rate to the expected emission count rate range. Activity in the normalization scan should be chosen higher rather than lower compared to the emission scan. No similar effect was observed on radial uniformity was observed. Axial uniformity at different count-rate
0.024
Plane number
Scatter correction was also applied for both reconstructions. Radial uniformity was evaluated by plotting the phantom radioactivity profile through the center of the FOV averaged over all axial planes.
0.019
0.014
0.009
0.004 5
15
25
M ean value
35
direct cylinder inversion high count rate cylinder + point source high count rate component based high count rate direct cylinder inversion norm count rate cylinder + point source norm count rate 45 55norm count rate 65 component based direct cylinder inversion rat count rate cylinder + point source rat count rate component based rat count rate
Figure 1 Axial uniformity for different count rates. Each count-rate was scaled differently for better display. Study 2. All figures of merit obtained from the axial and radial uniformity analysis are shown in Table 2. Results for the radial uniformity on the 5 and 6 cm phantoms, performed on data from the appropriate (matched) range of count rate, are shown in Figures 2 and 3. All images corrected using the measured attenuation were found to give higher COVs and noisier profiles. As a result, analysis using COV values was performed only on images corrected using segmented attenuation. All normalization procedures show clear improvement over those obtained with both directinversion methods. The direct-point method produces higher values of COV than those observed with all three other normalization procedures for both cylinder sizes. Finally, the uniformity of radial profiles were found to be phantom size dependent for all normalization procedures. Such dependence likely indicates a residual problem with scatter and/or attenuation correction. This issue is currently under investigation.
0-7803-8701-5/04/$20.00 3469 (C) 2004 IEEE
Coefficient of variation Direct-point Direct-cylinder Component-point Geometry normalized component Combination Geometry normalized combination Segm. 0.08222 5cm 0.05904 0.02060 0.02056 0.01924 0.01042 Radial diameter Meas. 0.0814 0.05346 0.04538 0.05041 0.04462 0.05522 cylinder Segm. 0.02858 0.01839 0.02832 0.03495 0.02484 0.02621 phantom Axial Meas. 0.04587 0.03591 0.03786 0.04074 0.04581 0.03689 Segm. 0.13118 0.07715 0.02989 6cm 0.03800 0.03252 0.03379 Radial diameter Meas. 0.16423 0.10220 0.05658 0.06444 0.05690 0.06892 cylinder Segm. 0.9835 0.03952 0.00949 0.01648 0.02340 0.02665 phantom Axial Meas. 0.12611 0.06697 0.02493 0.03333 0.04223 0.03982
Table 2 Coefficient of variation for axial and radial uniformity Profiles 5cm diameter cylinder average 0.014 0.012
Profile value
0.01 0.008 direct-point direct-point + segm direct-cylinder direct-cylinder + segm component-point component-point + segm combination combination + segm geometry normalized component geometry normalized component +segm geometry normalized combination geometry normalized combination +segm
0.006 0.004 0.002
distribution issues. The COV obtained with the geometry normalized combination is at most half the value obtained with any other normalization procedures. The direct-point procedure produced very poor results for all conditions (COV higher than any other procedures, see Table 2). Hence the best overall compromise for axial uniformity is the combination normalization procedure. Axial profiles 5 cm diameter cylinder 0.003
0 0
10
20
30
40
50
60
70
0.0025
Profile axis (mm)
0.002 Mean value
Figure 2 Segmented and measured attenuation correction scans (scaled differently for better display)
direct-point direct-point + segm direct-cylinder direct-cylinder + segm component-point component-point + segm combination combination + segm geometry normalized component geometry normalized component +segm geometry normalized combination geometry normalized combination +segm
0.0015 0.001
direct-point direct-point + segm direct-cylinder direct-cylinder + segm component-point component-point 8.00E-04 + segm combination combination + segm geom etry normalized component geom 7.00E-04 etry normalized component +segm geom etry normalized combination geom etry normalized combination +segm
0.0005
Profiles 6 cm diameter cylinder 0 5
25
35
45
55
Plane numbe r
Figure 4 Axial uniformity for the 5 cm diameter phantom
6.00E-04
Profile axis (mm)
15
5.00E-04 4.00E-04
Axial profiles 6 cm diameter cylinder
3.00E-04
0.0009 2.00E-04
0.0008 1.00E-04
0.0007 0
10
20
30
40
50
60
70
Profile v alue
Figure 3 Radial uniformity for the 6 cm diameter phantom Figures 4 and 5 show the results obtained for the axial uniformity on the 5 and 6 cm diameter phantoms. All methods correct to a large extent for the crystal sensitivity pattern although only the direct-cylinder and the geometry normalized combination procedure completely eliminate it. Unfortunately the direct-cylinder gives such noisy profiles that the COV values cannot be trusted. Excluding these values, for the 5 cm diameter cylindrical phantom the lowest COVs (average value 0.02552) are obtained with both combination and geometry normalized combination procedures. These COV values are lower than those obtained with the component-point (11%) but much better than the geometry normalized component (37%) and the direct-point procedures (150%). However, for the 6 cm diameter cylindrical phantom study, the geometry normalized combination outperformed the combination due to the geometry correction applied to the efficiency corrections which eliminate any residual geometric or source
0-7803-8700-7/04/$20.00 (C) 2004 IEEE
Mean value in roi
0.00E+00
0.0006 0.0005 0.0004 0.0003 0.0002 0.0001 0 5
15
25
35 Plane number
direct-point direct-point + segm direct-cylinder direct-cylinder + segm component-point component-point + segm combination combination + segm geometry normalized component geometry normalized component +segm 45 normalized combination 55 geometry geometry normalized combination +segm
Figure 5 Axial uniformity for the 6 cm diameter phantom B. Rat studies TACs obtained from a representative rat study are shown in Figure 6 as an example of the influence of normalization procedure. TACs were always obtained using ROIs in the same plane, so only relative differences between them as a function of time are observed with no differences in curve shape. The difference in the TACs obtained with the different normalization method depends on the radial and axial position of the ROI (Figure 6) thus suggesting that different normalization methods will lead to different results of the Logan analysis. This was indeed found to be the case as shown in Table 3.
3470 (C) 2004 IEEE 0-7803-8701-5/04/$20.00
left striatum direct-cylinder right striatum cereb left striatum combination right striatum cereb left striatum component-point right striatum cereb left striatum direct-point right striatum cereb
Time Activity Curv e for dtbz 116 0.006
Mean value in roi
0.005 0.004
towards other image corrections (such as attenuation or scatter correction) that might introduce higher relative inaccuracies compared to normalization correction. V. REFERENCES [1]
0.003 0.002
[2]
0.001
[3]
0 0
500
1000
1500
2000
2500
3000
3500
Time (s)
[4]
Figure 6 Time activity curve for Rat #116 IV. CONCLUSION This investigation shows that the normalization correction method greatly affects image uniformity in the microPET® R4 scanner to the point of affecting the results of further biologically based analysis. We found that the directcylinder, the component-point, the combination, the geometry normalized component, and the geometry normalized combination procedures all outperform the direct-point procedure for radial uniformity. The optimal choice among today’s available options for normalization is the geometry normalized combination procedure. Count rate was shown to influence all the normalization procedures. Fortunately this was a major problem only for emission scan with high count rates and could be avoided if acquisition of the normalization scan was performed at a higher average count rate than the emission scan. Further work on the normalization, especially for high count rates, is continuing. Moreover, switching between normalization methods should be avoided since variations in biological results were shown to be non-negligible. We also observed that other quantification corrections need to be optimized to obtain consistent data quantification and care thus needs to be taken when comparing data from different scanning conditions. Significant improvements to the previous default normalization procedure (direct-point) were made through the introduction of the component-point and the combination procedures. Attention should now be directed rat number 103
mp
121
BP_l
1.21258
2.59%
0.11491
-4.19%
geometry normalized component
1.21107
2.46%
0.11426
-4.74%
combination
1.18202
0.00%
0.11994
0.00%
geometry normalized combination
1.18587
0.33%
0.10088
-15.89%
direct-point
1.33947
13.32%
0.15008
25.13%
direct-cylinder
1.30288
10.22%
0.17472
45.67%
component norm
0.72418
-0.90%
0.44735
-2.84%
geometry normalized component
0.72802
-0.37%
0.44581
-3.18%
combination
0.73072
0.00%
0.46044
0.00%
0.7083
-3.07%
0.43413
-5.71%
0.83647
14.47%
0.52038
13.02%
0.7749
6.05%
0.49749
8.05%
direct-point direct-cylinder
[6] [7] [8] [9] [10] [11] [12] [13] [14]
[15]
rat number
component norm
geometry normalized combination mp
BP_r
[5]
118
mp
116
dtbz
D.W. Townsend, T. Sprinks, T. Jones et al., “Three dimensional reconstruction of PET data from a multiring camera”, IEEE Trans. Nucl. Sci., vol. 36, pp. 1056-1065, 1989. E.J. Hoffman, T.M. Guerrero, G. Germano et al., “PET system calibrations and corrections for quantitative and spatially accurate images”, IEEE Trans. Nucl. Sci., vol. 36, pp. 1108-1112, 1989. D.L. Bailey et al., “Quantitative procedures in 3D PET”, in The Theory and Practice of 3D PET, B. Bendriem and D. W. Townsend, Eds, Dordrecht, Netherlands: Kluwer, pp.55-109, 1998. D.L. Bailey, D.W. Townsend, P.E. Kinahan et al., “An investigation of factors affecting detectors and geometric correction in normalization of 3D PET data”, IEEE Trans. Nucl. Sci., vol. 43, pp. 3300-3307, 1996. P.E. Kinahan, D.W. Townsend, D.L. Bailey et al., “Efficiency normalization techniques for 3D PET data”, Nuclear Science Symposium and Medical Imaging Conference Record, vol. 2, pp. 1021-1025, 1995. M. Defrise, D.W. Townsend, D.L. Bailey et al., “A normalization technique for 3D PET data”, Phys. Med. Biol., vol 36, pp. 939-952, 1991. J. M. Ollinger, “Detector efficiencies and Compton scatter in fully 3D PET”, IEEE Trans. Nucl. Sci., vol. 42, pp. 1168-1173, 1995. C. Knoess, S. Siegel, A. Smith et al., “Performance evaluation of the microPET R4 PET scanner for rodents”, Eur. J. Nucl. Med., vol. 30, pp. 737-747, 2003. M.W. Stazyk, V. Sossi, K.R. Buckley et al., “Normalization measurement in septa-less PET scanners”, J. Nucl. Med., vol. 35, pp. 41, 1994. G. Germano and E.J. Hoffman, “A study of data loss and mispositioning due to pileup in 2-D detectors on PET”, IEEE Trans. Nucl. Sci., vol. 37, pp. 671-675, 1990. R.D. Badawi and P.K. Marsden, “Self-normalization of emission data in 3D PET”, IEEE Trans. Nucl. Sci., vol. 46, pp. 709-712, 1999. R. D. Badawi and P. K. Marsden, ``Developments in componentbased normalization for 3D PET'', Phys. Med. Biol., vol. 44, pp. 571594, 1999 S.R. Cherry, Y. Shao, R.W. Silverman et al., ”MicroPET: a high resolution PET scanner for imaging small animals”, IEEE Trans. Nucl. Sci., vol. 44, pp. 1161-1166, 1997. M.E. Casey, H. Gadagkar and D. Newport, “A component based method for normalization in volume PET” Proceedings of the International Meeting on Fully Three-dimensional Reconstruction in Nuclear and Radiology, Ais-les-Bains, France, pp. 67-71, 1995. J. Logan, J.S. Fowler, N.D. Volkow et al., “Distribution volume ratios without blood sampling from graphical analysis of PET data”, J. Cereb. Blood Flow. Metab., vol. 16, pp. 834-840, 1996
BP_r
BP_l
component norm
3.36768
-1.37%
2.18276
-0.14%
geometry normalized component
3.35844
-1.64%
2.18577
-2.45%
combination
3.41452
0.00%
2.24075
0.00%
geometry normalized combination
3.32482
-2.63%
2.16545
-3.36%
direct-point
3.93195
15.15%
2.51876
16.32%
cylindernorm
3.63578
6.48%
2.39394
10.55%
component norm
2.15495
0.77%
0.0306
-75.60%
geometry normalized component
2.12884
-0.45%
0.09119
-27.28%
combination
2.13845
0.00%
0.1254
0.00%
geometry normalized combination
2.11399
-1.14%
0.07056
-43.73%
direct-point
2.35165
9.97%
0.11095
-11.52%
cylindernorm
2.36937
10.80%
0.1693
35.01%
Table 3 Binding potential for right and left striatum on 12 Methylphenidate and 9 Dihydrotetrabenazine rat studies.
0-7803-8700-7/04/$20.00 (C) 2004 IEEE
0-7803-8701-5/04/$20.00 3471 (C) 2004 IEEE