Effect of Processing Conditions on Microstructure of Milk Fat Fraction/Sunflower Oil Blends S. Martinia, M.L. Herreraa, and R.W. Hartelb,* a
Centro de Investigación y Desarrollo en Criotecnología de Alimentos (CIDCA) (UNLP-CONICET), La Plata 1900, Argentina, and bFood Science Department, University of Wisconsin–Madison, Madison, Wisconsin 53706
ABSTRACT: The effect of processing conditions on the crystallization of blends of a high-melting milk fat fraction and sunflower oil was investigated. Two cooling rates were selected for all studies: 0.1°C/min (slow rate) and 5.5°C/min (fast rate). Blends were crystallized in two conditions: (i) with agitation in an 80-mL crystallizer (dynamic), and (ii) on a microscope slide without agitation (static). The selected crystallization temperatures were 25, 30, and 35°C for both cooling rates. Photographs of the development of crystals with time were taken in both static and dynamic conditions, and the crystal size distribution was determined at the moment that the laser signal reached its peak. Photographs showed that when samples were cooled slowly, crystals had a more regular boundary, appeared to be more densely arranged, and were larger. In dynamic conditions, crystal sizes were smaller and the background contained numerous small crystals, which were not found in statically crystallized samples. All images showed that crystals were not single crystals, but grew by accretion. Paper no. J10000 in JAOCS 79, 1063–1068 (November 2002). KEY WORDS: Cooling rate, crystal morphology, crystal size distribution, dynamic and static crystallization conditions, high-melting milk fat fraction, polarized light microscopy, sunflower oil.
The formation of a solid from a solution or a melt is a complicated process in which molecules must first come in contact, orient, and then interact to form highly ordered structures known as nuclei. For a natural lipid to crystallize, it must be supersaturated or supercooled to provide a driving force for both crystallization steps (1). Nucleus formation can be encouraged by stirring, or the nucleation process can be circumvented by seeding the supercooled liquid with tiny crystals of the type ultimately desired. Following nucleation, enlargement of these nuclei (crystal growth) progresses at a rate dependent on operating parameters such as temperature, agitation rate, and remaining composition in the liquid phase (2). Differential thermal analysis, X-ray diffraction, and IR spectroscopy are techniques often used to characterize the morphological form of crystals. Although polarizing microscopy already has found wide application in the food industry, the technique has recently started to gain attention in polymorphism and crystallization studies of fats. Light microscopy proved to be an excellent method for the study of early events in the crystallization of fats (3). It is also an increasingly used technique for studying the microstructure and composition of food systems in relation to their physical *To whom correspondence should be addressed at Food Science Department, University of Wisconsin–Madison, 1605 Linden Dr., Madison, WI 53706. E-mail:
[email protected]
Copyright © 2002 by AOCS Press
properties and processing behavior (4). In many applications of edible fats, however, the morphology and number of glyceride crystals determine the suitability of the fat for a given purpose. For example, the morphology of TAG crystals is related to the possibility of network formation to give a plastic fat. The β′-polymorph forms thin needles, and, because of their shape, only the β´-crystals are effective in forming networks, as each needle in a disordered array will touch adjacent needles (5). Early microscopic studies of the polymorphic forms of single-acid TAG have shown that the crystal forms exhibit a wide range of microscopic appearances. More recent studies with DSC, X-ray diffraction, and synchrotron radiation have led to a reassessment of these earlier reports (6,7). Kellens et al. (8) have described four β′-microstructures for pure tripalmitin: grainy, fibrous, feathery, and lamellar. Complex fat systems were also described by polarized light microscopy (PLM). The isothermal crystallization behavior of hydrogenated sunflower oil was described for different temperatures using PLM (9). The morphology and crystal size distribution of blends of milk fat fractions were studied by PLM for different cooling and agitation rates and different temperatures (10,11). Many factors influence lipid crystallization, most notably the way in which the sample is cooled from the melt (cooling rate, initial and final temperatures, agitation rate) and the composition (FA profile and TAG organization). In this work we studied the effect of cooling rate, crystallization temperature, and chemical composition on nucleation and growth behaviors for mixtures of a high-melting milk fat fraction (HMF) and sunflower oil (SFO). Crystallization was performed in an agitated crystallizer (dynamic condition) and on a microscope slide (static condition). Crystal size and morphology were determined by PLM for the blends of HMF and SFO in both conditions. MATERIALS AND METHODS Starting materials. HMF was obtained from La Serenisima S.A. (Gral. Rodriguez, Buenos Aires, Argentina) and SFO from Molinos Rio de La Plata S.A. (Avellaneda, Buenos Aires, Argentina). Three blends were prepared by mixing 10, 20, and 40% of SFO with HMF. Dropping points and chemical composition of the samples were reported previously (12). Crystallization procedures. Samples were crystallized under the following thermal treatments: (i) Samples were melted at 80°C for 30 min, and then immediately placed at crystallization temperature (Tc) (fast rate), or (ii) cooled from 60°C to Tc at 0.1°C/min using a programmable Lauda ethyleneglycol/water
1063
JAOCS, Vol. 79, no. 11 (2002)
1064
S. MARTINI ET AL.
(3:1) bath model RK 8 KP (Werklauda, Königshofen, Germany). The fast cooling rate was calculated from the slope of the cell temperature record, with the results of several runs being averaged. The average cooling rate was 5.5°C/min for the rapidly cooled samples. The selected crystallization temperatures were 25, 30, and 35°C for both cooling rates. Samples were crystallized under two agitation conditions: (i) dynamically in a 80 mL crystallizer, and (ii) without agitation by placing a melt sample at 80°C directly on a microscope slide. Photographs were taken at timed intervals. Experiments were performed at least five times, and more than 200 crystals were photographed at the laser peak signal (described below) to determine the crystal size distribution. Laser polarized light turbidimetry. When samples were crystallized in dynamic conditions, the crystallization process was monitored by using an optical setup described elsewhere (9). Laser polarized turbidimetry with a helium–neon laser as light source was used to follow the occurrence of optically anisotropic fat crystals. The sample, ~80 g, was contained in a water-jacketed glass cell. A polarizer lens was placed between the laser and the cell. The temperature of the glass cell was controlled by means of water that was circulated from a
water bath. The light transmitted by the crystals was then passed through the second analyzer placed at the Cross–Nicolls position with the first analyzer, which enables the photodiode to detect crystals. A typical photosensor output and the cell temperature record were reported previously (9). Crystals were collected with a pipette from the 80-mL crystallizer and were placed on the slide at crystallization temperature for imaging. PLM. A Leitz microscope model Ortholux II (Ernest Leitz Co., Wetzlas, Germany) with a controlled-temperature platform was used to photograph the initial crystals. The platform temperature was controlled by a Lauda model RK 8 KP cryostat (Werklauda). Photographs of the crystals were taken with a Leitz-Vario-Othomat camera under polarized light. A 2.5× ocular and a 25× objective were selected, and a scale of 1 cm : 55 µm was used for all photographs. The photographs were scanned with a Genius Color Page CS scanner (KYE Corp., Torrance, CA); the number of crystals was determined using Global Lab Image 2.1 software. These data were evaluated with Origin 4.0 for Windows software to obtain the crystal size distribution. The diameters of circles having areas equivalent to the measured areas were reported.
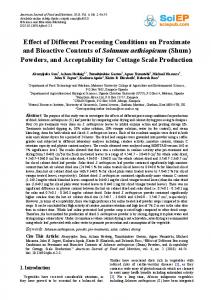
FIG. 1. Images of crystals corresponding to a 40–60% blend of highmelting milk fat fraction in sunflower oil rapidly cooled (5.5°C/min) with agitation to 35°C. Images were taken at (A) 90 min, (B) 125 min, and (C) 135 min.
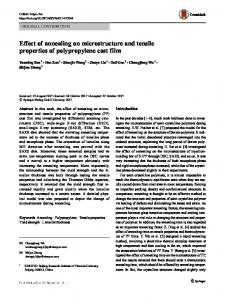
FIG. 2. Images of crystals corresponding to a 40–60% blend of high-melting milk fat fraction in sunflower oil slowly cooled (0.1°C/min) with agitation to 35°C. Images were taken at (A) 70 min, (B) 80 min, and (C) 100 min. For scale bar see Figure 1A.
JAOCS, Vol. 79, no. 11 (2002)
EFFECT OF COOLING RATE ON MICROSTRUCTURE
1065
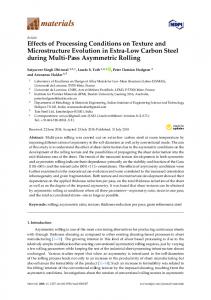
FIG. 3. Effect of composition and cooling rate on crystal size and morphology for the blends of high-melting milk fat fraction in sunflower oil cooled with agitation to 30°C. (A) 10–90% blend, rapidly cooled (5.5°C/min), 30 min; (B) 10–90% blend, slowly cooled (0.1°C/min), 30 min; (C) 40–60% blend, rapidly cooled, 120 min; (D) 40–60% blend, slowly cooled, 120 min. For scale bar see Figure 1A.
X-ray diffraction. When the laser signal reached its peak, samples were filtered under vacuum with Whatman filter paper (no. 4) at the same temperature as crystallization. The crystals were analyzed for polymorphic form by using a
Philips 1730 X-ray spectrometer fitted with a system for temperature control (Philips Argentina S.A., Capital Federal, Argentina). The temperature of the sample holder placed within the refraction chamber was controlled with a programmable
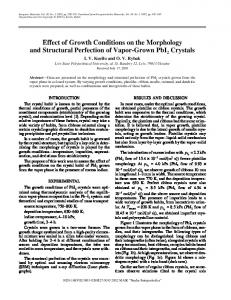
FIG. 4. Effect of composition and cooling rate on crystal size and morphology for the blends of high-melting milk fat fraction in sunflower oil cooled without agitation to 30°C. See Figure 3 for panels A–D. For scale bar see Figure 1A. JAOCS, Vol. 79, no. 11 (2002)
1066
S. MARTINI ET AL.
FIG. 5. Effect of temperature on crystal size and morphology; 10–90% blend rapidly crystallized without agitation, 5 min after the start of crystallization. (A) 35, (B) 30, and (C) 25°C. For scale bar see Figure 1A.
Lauda UK 30 cryostat (Werklauda) at the same temperature as crystallization. Ethylene glycol in water (3:1, vol/vol) was used as coolant. Kα1α2 radiation from copper was used at 40 kV, 20 mA, and scanning velocity 1°/min from 5 to 30°. X-ray spectra were collected within 30 min of filtration. RESULTS AND DISCUSSION Crystal formation. To better understand the processes of nucleation and growth under dynamic conditions, we took samples from the glass cell periodically, beginning when the cell temperature reached crystallization temperature and continuing for 3 h. As an example, Figure 1 shows the morphology of crystals with time obtained when the mixture with 40% SFO was crystallized with agitation at a cooling rate of 5.5°C/min to 35°C. Crystallization was followed by recording the laser signal. When the laser signal started to deviate from the baseline, that is, when the occurrence of anisotropic crystals was detected by the laser (54 ± 2.5 min after the sample reached crystallization temperature), no crystals were still found on the microscope. About 2 or 3 min after the laser signal deviation, one or two small crystals per field, which appeared as bright spots, were observed. Crystals were not big JAOCS, Vol. 79, no. 11 (2002)
enough to observe their surface morphology until the laser signal reached its peak (68 ± 3.2 min). A few large crystals were formed at these processing conditions for the 20 and 40% SFO samples. The photographs showed that they were not single crystals but grew by accretion. These crystals had a spherical shape consisting of small needle crystals. Samples made with 0 and 10% SFO had more numerous but smaller crystals with the same crystal morphology, indicative of a higher nucleation rate for higher supersaturation. Figure 2 shows a similar example for dynamic crystallization at 35°C at the slow cooling rate. The 40% SFO sample crystallized more slowly but had a shorter induction time after reaching Tc (27.0 ± 1.3 min) than at the fast cooling rate. This behavior was generally observed for slow cooling of all samples. Induction times for crystallization once temperature had reached Tc were shorter for all blends. At first (70 min; Fig. 2A), only a few big crystals formed, with needles oriented similarly to those seen for fast cooling (Fig. 1A). After 80 min, numerous small crystals had formed (Fig. 2B) with only minimal growth of the earlier crystals. Finally, after 100 min, an accumulation of ill-defined crystals in contact with each other was observed. Smaller and more well-defined crystals were obtained for samples with a lower content of SFO. The images suggested that crystallization was promoted at the slow rate. After 90 min, most fields on the microscope slide were covered by crystals. When samples were crystallized at the fast cooling rate at the same time, only isolated crystals were found. Effect of processing conditions. Figure 3 shows the effect of cooling rate and blend composition on crystal morphology for the 10 and 40% SFO samples crystallized with agitation to 30°C. At 30°C, samples crystallized with high supercooling, as evidenced by the small crystal size that appeared when samples were crystallized with the fast cooling rate (Fig. 3A,C) or the high amount of solids shown in the photographs (Fig. 3B,D). In this condition, small needle crystals covered the field (Fig. 3A,C). At the slow rate, a different structure can be observed. For the 40% SFO sample, fields were covered by ill-defined crystals with spherical shape (Fig. 3D) that appeared to be in contact with each other, whereas for the 10% SFO sample, well-formed spherical crystals were observed in a background of small needles (Fig. 3B). Cooling rate influenced the nature of the crystals obtained. Slowly crystallized samples appeared to have a number of crystals with denser crystal structure (Fig. 3B). More solid material was contained in these crystals, and this is why they look darker (more opaque) in the photographs. Photographs taken in dynamic conditions always showed small crystals in the background. Higher agitation rates had a dramatic effect on crystal size resulting in formation of many small crystals (11), which is perhaps evidence of secondary nucleation caused by crystal contact mechanisms (2). The 40% [Mettler dropping point (MDP) of 37.4°C] and 10% (MDP of 40.4°C) SFO blends had very different crystallization behaviors, which is surprising taking into account the small difference in the MDP (3°C) (12). The addition of SFO to the blends dramatically increased the C54 fraction content, and especially the
EFFECT OF COOLING RATE ON MICROSTRUCTURE
1067
FIG. 6. Crystal size distribution of blends of high-melting fraction of milk fat in sunflower oil rapidly crystallized (5.5°C/min) to 35°C when the laser signal reached its peak. (A) 0–100, (B) 10–90, (C) 20–80, and (D) 40–60% blend.
18:1-cis TAG, and slightly decreased the contents of C36, C38, C42, C44, C46, C48, and C50 TAG (12). The changes in TAG composition should have changed the interactions between TAG and therefore crystallization behavior. The crystal size decreased with the proportion of HMF (Fig. 3B,D). Figure 4 shows a similar example for crystallization without agitation. Here, no crystals appeared in the liquid background. Rapidly crystallized samples (Fig. 4A,C) had crystals that were smaller and more transparent, with lower amount of solids in each crystal. For the slow cooling rate (Fig. 4B,D), denser and larger crystals, with a more regular boundary, were found. Samples crystallized without agitation appeared to be more densely arranged within the crystal and to have bigger crystal sizes than samples crystallized in dynamic conditions. Figure 5 shows the effect of temperature on crystal structure for the 10% SFO blend crystallized at a fast cooling rate without agitation. Crystal size increased dramatically, whereas crystal number decreased significantly with temperature. This effect was found in all cases. At higher temperatures, fewer initial crystals were formed and their growth was favored. These conditions favor crystal growth over nucleation (2). Crystal size distribution. Figures 6 and 7 summarize the effects of formulation and cooling rate on crystal size distribution. Figure 6 shows an example of the crystal size distribution for the blends crystallized to 35°C with agitation at the
fast cooling rate. Figure 7 shows a similar example, but for the slow cooling rate. A temperature of 35°C was selected to evaluate crystal size distribution. Images were taken at the time the laser signal reached its peak. At this time and temperature, crystal morphology and size could be evaluated with low error by the image processor program, because crystals were isolated and well-defined. Two trends are clear. Samples with higher content of SFO (and therefore lower MDP) showed a broader crystal size distribution (Fig. 4C,D). Slowly crystallized samples showed a broader crystal size distribution than rapidly crystallized samples. This effect is especially obvious for the 0 (Fig. 4A) and 40% (Fig. 4D) SFO samples, which showed some very large crystals. When samples crystallized without agitation were analyzed for their crystal size distribution at the same temperature and time, similar behavior was found for both cooling rates. The two trends found above were also clear. However, samples had larger average crystal sizes (average radii were greater, P < 0.05). The average radii were 29.6 ± 5.2, 33.2 ± 6.7, 45.2 ± 12.4, and 56.0 ± 15.7 µm for the 0, 10, 20, and 40% SFO blends crystallized with rapid cooling at 35°C, respectively. Average radii were 78.6 ± 10.4, 81.6 ± 15.6, 90.2 ± 11.7, and 98.7 ± 12.9 µm for the 0, 10, 20, and 40% SFO blends crystallized with slow cooling at 35°C, respectively. Agitation produced a marked decrease in crystal size, which was observed at both cooling rates. JAOCS, Vol. 79, no. 11 (2002)
1068
S. MARTINI ET AL.
FIG. 7. Crystal size distribution of blends of high-melting fraction of milk fat in sunflower oil slowly crystallized (0.1°C/min) to 35°C when the laser signal reached its peak. (A) 0–100, (B) 10–90, (C) 20–80, and (D) 40–60% blend.
X-ray spectroscopy. The X-ray spectra of all samples corresponded to patterns for β´ polymorphs with two strong signals at d-spacings of 3.9 and 4.3 Å. Even at 35°C and for the samples crystallized with slow cooling, nucleation occurred in the β´ form. Neither differences in morphology between fast and slow cooling nor differences in crystal sizes with temperature were due to polymorphism. ACKNOWLEDGMENTS This work was funded by the University of La Plata through the 11/X279 project. M.L. Herrera is an Associate Researcher of the National Research Council of Argentina (CONICET).
REFERENCES 1. Garside, J., General Principles of Crystallization, in Food Structure and Behavior, edited by J.M.V. Blanshard and P. Lillford, Academic Press, London, 1987, pp. 35–49. 2. Hartel, R.W., Crystallization in Foods, Aspen, Gaithersburg, MD, 2001. 3. Wright, A.J., S.S. Narine, and A.G. Marangoni, Comparison of Experimental Techniques Used in Lipid Crystallization Studies, J. Am. Oil Chem. Soc. 77:1239–1242 (2000). 4. Marangoni, A.G., and D. Rousseau, Is Plastic Fat Rheology
JAOCS, Vol. 79, no. 11 (2002)
5. 6. 7. 8. 9. 10. 11. 12.
Governed by the Fractal Nature of the Fat Crystal Network? Ibid. 73:991–994 (1996). Larsson, K., Lipids in the Solid State, in Lipids: Molecular Organization, Physical Functions and Technical Applications, Oily Press, Glasgow, Scotland, 1994, pp. 7–45. Kellens, M., W. Meeussen, and H. Reynaers, Crystallization and Phase Transition Studies of Tripalmitin, Chem. Phys. Lipids 55:163–178 (1990). Kellens, M., W. Meeussen, C. Riekel, and H. Reynaers, Time-Resolved X-Ray Diffraction Studies of the Polymorphic Behavior of Tripalmitin Using Synchrotron Radiation, Ibid. 52:79–98 (1990). Kellens, M., W. Meeussen, and H. Reynaers, Study of the Polymorphism and the Crystallization Kinetics of Tripalmitin: A Microscopic Approach, J. Am. Oil Chem. Soc. 69:906–911 (1992). Herrera, M.L., Crystallization Behavior of Hydrogenated Sunflowerseed Oil: Kinetics and Polymorphism, Ibid. 71:1255–1260 (1994). Grall, D.S., and R.W. Hartel, Kinetics of Butterfat Crystallization, Ibid. 69:741–747 (1992). Herrera, M.L., and R.W. Hartel, Effect of Processing Conditions on Crystallization Kinetics of a Milk Fat Model System, Ibid. 77:1177–1187 (2000). Martini, S., M.L. Herrera, and R.W. Hartel, Effect of Cooling Rate on Crystallization Behavior of Milk Fat Fraction/Sunflower Oil Blends, J. Am. Oil Chem. Soc. 79:1055–1062 (2002). [Received June 7, 2001; accepted August 8, 2002]