It was shown that at least for amorphous polymers a ... For semicrystalline PP (3, 20) and PA (17, 20) its was shown that length and ... space, setup a material balance, and calculate the ..... for high density polyethylene. .... completely solidified.
Effect of Processing Conditions on Shrinkage in Injection Molding K.M. B. JANSEN, D. J.VAN DIJK, and M.H. HUSSELMAN lbente University Dept of Mechanical Engineering Enschede, The Netherlands A systematic study on the effect of processing conditions on mold shrinkage was undertaken for seven common thermoplastic polymers. It turned out that the holding pressure was ahvays the key parameter. The effect of the melt temperature is slightly less important. Injection velocity and mold temperature do not show a general trend for all polymers. It was shown that at least for amorphous polymers a simple thermoelastic model could describe all experimental results. For semi-crystalline materials the model overpredicts shrinkage. INTRODUCTION
T
he objective of this paper is first to present the results of a systematic study on the effect of processing conditions on the dimensions of as-molded products. The second objective is to show that all shnnkage data is well described by a simple equation that relates shrinkage to the local pressure history. The study was done using seven common resins, being PS,ABS,HIPS, PC, PBT, PBT-GF30 and HDPE, and systematically varying holding pressure, injection velocity, mold temperature and melt temperature. In general we may discern three types of shnnkage in injection molding: in-mold shrinkage (shrinkage during processing which may show up in extreme cases), as-molded shnnkage (the shnnkage just after mold opening, sometimes referred to as "mold shrinkage") and post-shnnkage (time effects during storage as physical aging, recrystallization, etc.). Here we will focus on as-molded shrinkage and, briefly, on postshrinkage effects. In-mold shrinkage is discussed in detail elsewhere ( 1). In the past tables or nomograms (2) were used to correct for product shrinkage during mold design. However, with the increasing demands on product tolerances more exact information is required. Recent experimental studies show that as-molded shnnkage of injection molded products is affected by processing parameters as well as by mold geometry (3-24). All studies conclude that the holding pressure is by far the most important parameter affecting shnnkage. A higher holding pressure setting decreases part shrinkage in all directions. The second most important parameter is the injection temperature (3-7). Increasing the injection temperature was usually seen to reduce shrinkage because of a better pressure transmission). Some authors reported an increase in shrinkage with
838
increasing mold temperature (3, 4,6, 8) while others concluded differently (5, 9). Increasing the holding time always decreases shrinkage until leveling off occurs at the gate freeze-off time (3,4, 10, 11). In most studies rectangular plates or tensile bars were considered. Exceptions are center gated disk molds (12, 13). box molds (14) and a flat plate with holes (15, 16). In only a few cases the geometry was considered as a variable (17-19). Geometry may affect shnnkage in two ways. First, geometry may affect flow and hence cause orientation effects (of either amorpous phase, crystalline phase or filler particles) resulting in shrinkage anisotropy. Second, geometrical constraints (ribs, bosses, etc.) affect the shrinkage boundary conditions. These effects are discussed elsewhere (1, 10, 13, 17, 18, 20-22). Shrinkage variations along the flowpath are usually directly related to the local cavity pressure (3, 11, 17, 18, 20).For semicrystalline PP (3, 20) and PA (17, 20) its was shown that length and width shnnkage varied differently. In most cases, width shrinkage was slightly larger than length shrinkage, the only exception being Thomas's measurements on PP (20)where close to the gate length shrinkage is larger than width shrinkage and f a r from the gate the reverse holds true. Shay et al. (17) reported that for amorphous polycarbonate no differences between length and width shrinkage could be detected. For fiber filled resins, large differences between shrinkage in the flow direction and in the transverse direction (width) are always reported (e.g., 6, 18, 19, 23). Typical length shrinkage values are always close to 0.2%. while shrinkage in transverse direction approaches that of unfilled resins. In contrast to in-plane shrinkage, surprisingly little agreement in the literature is found between thickness shnnkage measurements. For similar POLYMER ENGINEERING AND SCIENCE, MAY 1998, Vol. 38,No. 5
Effect of Processing Conditions o n Shrinkage molding conditions some authors report thickness shrinkage of the same order of magnitude as in-plane shrinkage (20)while others mention thickness shrinkages many times larger (and in some cases of opposite sign) than length and width shrinkage (4, 6, 10-12, 19, 24). Possible explanations for these observations are elastic expansion of the compressed polymer due to a nonvanishing cavity pressure (9, 10, 22). elastic deformation of the mold during packing (10, 11, 22, 24), flashing at high holding pressures (12). void formation in thicker bars (19) or the much larger thermal gradient in thickness direction (6). In practice, thickness shnnkage is most probably governed by a combination the f i s t three effects. In most studies, shrinkage is measured between 24 and 48 hours after production (25).It is, however, well known that shrinkage continues (slowly) during storage because of physical aging or recrystallization effects (5, 8, 26, 27). Since these are self-delaying processes, shrinkage must proceed proportional to the logarithm of time (26). As a first attempt to deal with the parameters affecting shrinkage, statistical analysis methods were used to construct empirical fit functions based on shrinkage data of a limited number of experiments (3, 5, 8, 20). It is obvious that with this approach predictions are limited to the specific testing geometry and testing window. Such "models," moreover, do not have any physical meaning and are difficult to use for interpretation purposes. A better way to try to understand shnnkage in injection molding is to consider the mold as a closed space, setup a material balance, and calculate the amount of mass accumulated in the mold. The volumetric shrinkage then follows from the pvT-diagram (7, 12, 24). In general these models use a Tait-like equation in combination with calculated temperature and pressure histories to obtain the final volumetric product shnnkage. The disadvantage of this method is that no distinction can be made between shnnkage in flow, transverse and thickness direction. In practice, however, it is well known that thickness shrinkage can well be 5 to 10 times larger than in-plane shrinkage and that shrinkage in flow and transverse directions may differ due to filer or crystallization effects. Commercial codes like MoldFlow and C-Mold calculate shnnkage in a post processing step from the thermal stress distribution. They probably neglect pressure-induced stresses and, therefore, also the solidification pressure term outlined in the next section. This can be a possible cause of the often surprisingly large discrepancies between predicted and measured shrinkages (e.g., 12, 14, 15, 17). Recently, three other shrinkage models were proposed. Jansen and Titomanlio (22, 28) proposed a simple thermoelastic model taking into account pressure effects and Poisson expansion on thickness shrinkage, but neglecting viscoelastic effects. Their final equations for in-plane shrinkage are similar to the semi-empirical model proposed by Kumazawa (4). POLYMER ENGINEERING AND SCIENCE, MAY 1998, Vol. 38, No. 5
A complete viscoelastic theory for shrinkage predictions is given by Bushko and Stokes (21, 29). In this paper, however, the thermoelastic model is discussed.
THEORY
The idea explored in the thermoelastic model is that during solidification no relaxation and creep occurs and that stresses start to build u p as soon as the temperature drops below the solidification temperature. A product that is restrained from shrinking during solidification will then build up tensile stresses as a result of thermal and crystallization shnnkage. In addition, pressure effects should be considered. A layer that solidified under pressure is compressed with respect to atmospheric conditions. If it were to expand freely after ejection, it would expand proportionally to the pressure during solidification (denoted as PJ. Since all layers solid@ under different pressures, the product expands proportionally to the gapwise averaged solidification pressure, E. This effect may balance or even exceed the thermal and crystallization effects. The local in-plane and thickness shrinkages, denoted as S , Syand S, respectively can then be expresses as (22.28) S,(t) = a i [ T s - T , ] - p i ~ + C m ~ ,t > te, i = x, y (1)
with Here a and p stand for the linear expansion and compressibility, T, for the solidification temperature 5- for the gapwise averaged crys(either Ts or Tm), tallinity and C , = (p,-pa)/3p, for the maximum crystallization shrinkage. The equations clearly show how expansion effects are caused by the average local pressure balance against thermal and crystallization shrinkage. Note that the second term in Eq 2 is evaluated between the instant of solidification of each layer, denoted as t,. and the instant of ejection, g. Therefore, the thickness shrinkage equation contains a term proportional to the pressure just before ejection and takes into account the material expansion due to a nonvanishing pressure. The last term in Eq 2 is the mold deformation term consisting of a stiffness constant and the gate freeze-off pressure, PM (22). If the modulus shows a strong variation over the thickness, the equations become slightly more complicated (23). EXPERIMENTAL
The experiments were performed on a 175-ton Engel injection molding machine with a film-gated rectangular cavity with nominal dimensions 120 X 300 X 2.4 mm. The mold is equipped with three pressure transducers at 14 mm (Pl), 150 mm (P2)and 839
K. M.B.Jansen,D.J. v a n Dyk, and M.H . Husselman 286 mm (P3) from the gate and nine thermocouples. All pressure, temperature, and screw velocity data is recorded using a data acquisition system. On one of the two mold halves a 10-mm-wide grid was engraved covering the entire product. The line thickness was approximately 5 pm. The distances between all gridpoints were carefully measured with a Stras-mann traveling microscope and were used as a reference. Experimental shrinkages were then obtained as (4)
The scatter between individual length measurements turned out to be of the order of 15 pm. Reference distances of 30 to 50 mm will therefore result in shrinkage errors of less than 0.05%. which was considered to be acceptable for our purposes. The standard measurement procedure consisted of measuring the coordinates of four grid points centered around transducer P2 (halfway the product) and 50 mm apart. With these data two length and two width shrinkage values were calculated. This procedure was repeated for 3 to 5 products of each molding condition. Finally all shnnkages were averaged yielding a single length and width shrinkage value for each molding condition. All products were stored in a conditioned room a t 23OC, 50%RH and were measured two days after production. For some products, measurements were repeated at increasing time intervals to assess the shrinkage change in time. The materials used were four amorphous resins CpC, PS,Al3S and HIPS) and two semicrystalline materials (PBT and HDPE), of which the PBT was also available in a 30% glass filled grade. The materials are listed in Tabk 1. Attention was paid in obtaining reli-
able data for the coefficients of thermal expansion and the compressibility since these are clearly the key parameters of the model above. Agreement between various data sources is often poor. It turned out that for most materials the standard deviation in reported values for a and p was about lo?! of the actual values. In Table 1 the average values are listed. In cases where the disagreement in literature data was particularly large, additional measurements were performed in our own laboratory. The measurements of the compressibility were done in a pressure cell containing silicon oil and a sample containing two strain gauges. Corrections for the effect of pressure on strain gauges were taken into account (36). The processing conditions that were varied are the holding pressure (Ph), screw velocity (v), melt temperature (TJand mold wall tempexatme (Td.Holding time (t,,) and cooling time (0were kept constant. All conditions are listed in Tabk 2. The standard conditions for every parameter are underlined.
RESULTS E f f d of Flowpath In order to check the shrinkage uniformity along the flowpath, length and width shnnkages were measured as a function of the distance from gate for PC, PS, PBT, and HDPE. As can be seen in Fig. 1, the shrinkage for the amorphous materials PC and PS is low and constant along the flowpath. No significant anisotropy effects can be detected. For the semicrystalline PBT, the as-molded shnnkage is considerably larger and varies from 2.5% near the gate to 3 O h at the end of the flowpath. Near the gate, length shnnkage is slightly larger than width shrinkage. For HDPE (Q. 2)
Table 1. Materials Used in This Study and Some of Their Properties(at Ambient Conditions). TI Data Were Taken From the GMold Data Bank. Values for cx and p Are an Average of Literature Data (Most Important Sources are 27,3049. Data With a "*" Were Measured in our Laboratory. For PBT-GWO, the First and Second Values Refer to Flow and Transverse Direction, Respectively. Code
Material
Producer
T""C1
PC PS ABS HIPS PBT PBT-GF30 HDPE
Xantar 22R PS 678E Magnum 3391 HIPS 5192 Pocan 1505 Pocan 3235 KT 10000
DSM Dow Dow Dow Bayer Bayer Dow
144 100 102 104 214 214 133
u[lOdK-l]
p[106MPa-1] 7.4' 9.1 9 9 6.2 2.414.9' 9
7.5' 7.7 8.4' 8.3 11 2.418.0' 16
Table 2. Molding Conditions Used in Experiments. The Underlined Values Refer to the Standard Settings. The Listed Pressures and Velocities Are Machine Settings. To Obtain the Actual Pressure in Front of the Screw Tip [in Bar], One Has to Multiply by 11.67. Melt Front Velocities Are Obtained by Multiplication of V-set by 6.818. Material PC PS ABS HIPS PBT 1505 PBT 3235 HDPE
P,-set [bar] 0, 15,3Q, 50,70 5, 15, 40, 50 10,30,40, 70 10, 30,40, 5p, 70 10,20, 50,70 10,20, 32,50,70 26, g , 43,51
a, a,
V-set [ m d s ]
T,[CI
20, 80 20, 100,150 50,1pp, 150,200 50,1Qp, 150,200, 20, &Q, 60,90,120 20,&Q,60,90,120 20,32, 40,W
280,300, 190, 260 260 190, 190, 260 275 245, 245, 275 260 190,
a,
a a, a, a, a, m, m,
TVI[Cl
tk[Sl
t,
70, &, 95 35,5!2,65 35,5Q, 65 35,5p, 65 50, LQ,90 50, LQ,90 35,5!2, 65
l.5 l.5 l.5 l.5
I5
~~
840
24 2Q
2Q
32
a
111
32
25
15
~~~~~~~~~
POLYMER ENGINEERING AND SCIENCE, MAY 1998, Vol. 38,No. 5
EjCfect of Processing Conditions on Shrinkage tion. The shnnkage changes in time (typically about O.Ol%/decade) are shown in Table 3 below. In case of PI3T and PET-GF30 also, the weight was recorded in order to make sure that no water absorption took place during storage.
the anisotropy effects are much larger and vary along the flowpath. Near the gate, length shrinkage is about 1% larger than width shrinkage while at the end of flow the reverse is true. Note that this is similar to Thomas's observations for PP (20). Ef€ect of Molding Conditions
VERIFICATION OF THE THERMOELASTIC MODEL
In Q. 3 the shnnkages for all amorphous materials are plotted as a function of the processing conditions. The symbols refer to measured length (crosses) and width (triangles) shrinkages, while the full lines denote the calculated shrinkages (to be discussed in the next section).The following observations can be made. First, the shrinkages all vary between 0.4% and 0.9%. The second observation is that increasing holding pressure and melt temperature both decrease the product shrinkage. Injection velocity and mold temperature do not have large effect on shrinkage. For semicrystalline materials (Fig. 4) t h e situation is slightly different. Now the packing pressure seems to be the parameter with the largest effect on shrinkage. AU other parameters did not show clear effects,just as reported in other studies (see previous section).
Shnnkage predictions were obtained by using Eq. 1 and the data listed in Table 1. In order to avoid that errors in the pressure calculation would obscure the verifkation of Eq 1, we decided use measured pressure profiles to calculate the solidification pressure Ps(z) (from f i t ) and zs(t)).In doing so one irnpZkitZy takes into account the effect of mass flow during packing. What counts in shnnkage calculations is the actual cavity pressure. The solidified layer growth, z,(t),was obtained by numerically solving a two-dimensional heat problem, including convection and dissipation effects but neglecting crystallization effects. The wall temperature and thermal parameters were considered as constant. The thermal parameters are listed in Table 4. Only one value for the crystallinity was used for all experiments since the gapwise averaged crystallinity did not vary much with processing conditions (37). Alternatively, the solidified layer growth can be obtained from the following analytical approximations (38)
Effect of GLPUS Fibers on Shrinkage
This effect is shown in more detail in Fig. 5. Clearly, the addition of short glass fibers has a dramatic effect on the length shnnkage (drop from about 3% to 0.2% shrinkage). Also the effect on width shnnkage is considerable (decrease of about 0.7%). Next we see that the holding pressure affects only width shrinkage, whereas length shrinkage remains unaffected by the holding pressure. The injection velocity has only a small effect on width shrinkage and a negligible effect on length shrinkage of fiber reinforced PI3T.
1
1
z , ( t ) / D = - Arc sin[u]+ Tsfi - - Arc s@u] bl bl (5) u = Ts&yCl,
(7rl2)Bi Bi+ 1 '
b,
= ___
c
= _
Post-Molding Shrinkage
Shrinkage changes were recorded over a least four decades of time, starting 20 minutes after produc-
'
[:
I----
(1
1
+ Bi)2
3.5% 3.0%
-8
2.5%
L
Fig. 1 . Measured inplane shrinkage variations alongflowpath for three materials. Crosses and tiangles refer to length and width shrinkage, respectiuely.
@2.0%
e
x
E 1.5%
c v)
1 .O%
0.5%
0
POLYMER ENGINEERING AND SCIENCE, MAY 1998, Vol. 38, No. 5
50
100
150
200
Distance from gate [mm]
250
300
841
K . M. B. Jansen, D. J. v a n D y k , a n d M . H . Husselman
*.. --..
*
3.0% 2.5%
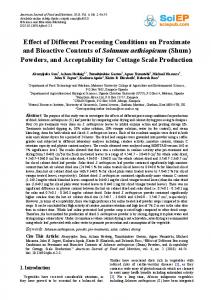
F@. 2. Measured in-plane shrinkage variations along jlowpath for high density polyethylene. Crosses and tiangles refer to length a n d width shrinkage, respectwely. 1.O%
0.5%
t 50
0
Here T = kt/(pcJF?) denotes the dimensionless time and Bi= h D / k the Biot number, which was taken as infinite here. In fact, it turned out that using Eq 5 instead of the numerically obtained layer growth resulted in only minor changes in the calculated shnnkages. The results of the calculated shrinkages are included in Figs. 3 and 4 as the solid lines. It turns out that for amorphous materials the calculated shrinkages correspond almost exactly with the measured shrinkage data for all experimental conditions. For semicrystalline materials (Fig. 4),the correspondence is poor and shrinkages are overpredicted. Moreover, the shrinkage predictions do not follow the experimentally observed trends with increasing holding pressure and injection velocity. DISCUSSION The main observation is that the simple thermoelastic model considered here is well able to predict shrinkages for amorphous materials. The fact that
..*..*
. . . . . . . . . . . . . . . . . . . . . . . . .
. . . .
0.0%
100
150
200
D h t a m from gab [mm]
250
i 300
with these data mold shrinkage can be predicted so well clearly proves that eventual r e h t i o n phenomena in the glass transition range did not have any effect at all on the final shrinkages. Therefore, we now can state that for amorphous materials the mold shrinkage phenomenon is well understood. For semicrystalline materials the situation is different. Although the theory was designed to deal with shnnkage of the crystalline phase, the approach followed here obviously did not lead to satisfactory shnnkage predictions. Recall that possible effects on shrinkage of extra mass flow through crystallization are implicitly corrected for since the actual holding pressure was used to calculate shnnkage. Therefore, a different explanation has to be found. Some insight can be gained by inspecting the shrinkage versus pressure plots. By extrapolating to zero holding pressure an estimate of the shrinkage of a slab solidifymg under ambient pressure can be obtained. By comparing this with Eq 1, it is obvious that this should correspond to the thermal contraction and crystallization
Table 3. Shrinkage Change in Time [%,/Decade] for Standard Conditions of All Materials Considered in This Study. Aging Conditions: 23"C, 50% Humidity.
Length Width
PC
PS
ABS
HIPS
PBT
0.005 0.005
0.023 0.016
0.015 0.008
0.025 0.021
0.006
0.004
PBT-GF30 -0.002 0.008
HDPE 0.033 0.01?
Table 4. Thermal and Crystalinity Parameters of Used Materials. ~
PC PS ABS HIPS PBT PBT- GF30 HDPE
0.24 0.17 0.152 0.17 0.25 0.288 0.335
1200 1050 1050 1037 1290 1530 9532)
~~
1900 1300 2032 1750 1900 1600 2140
~~
-
-
-
-
-
-
-
-
1280
1396
856
1001
0.35') 0.37') 0.672)
-
-
"Fmm DSC using AM = 142 and 99 J/g, respectively. 2)Fmm density measurements.
a42
POLYMER ENGINEERING AND SCIENCE, MAY 1998, Vol. 38,No. 5
..
0
0
O O * i i
0
0
.
.
b
j
oos.1.
00 ' .
0 2%
'2:
40
........
60
.
x\
:
40
*.
'
..:.
60
:
n.....-
,
:
40
'
: 60
40
60
Packing pressure W a )
20
Packlng pressure [MPa]
20
:
Pecking pressure [MPa]
20
:
.........
[El
'
'
'
8C
'
80
0c
IHIPSJ
~
80
d
2 . . ...... ...)
Packing pre%3ure [MPal
20
3
+
x.. ..... x . " : : ,
I O 4"0 t
E
f 0 O6 '-'.
OR""
1
T
0
fi2
50
........
100
Injection velocity [ m d s ]
....
100
. . t . - 4
[m&9
1so
....y .............x
*......*.._.,.....
'.%
::::..
f:jectioA'veloci$
. . . .: .... : . . . . : eo
p..:.............. ..........A Y
.......
..........
300
..x
Moll temperature ['Cl
320
30
30
i
T
60
50
50
60
Mould lempe;ature r C ]
40
..
(TI
90
.-.*. wdul
..
Mould tempwature
40
h . ..............
70
Mould tompw%ra
70
70
K. M.B.Jansen,D.J. v a n Dyk, and M.H.Husselman
. x
I
. i
t
0
.*
.. .. dri.
L
I .
F ). d ..
,.
xi
b
.
:
.
:
.
:
.
;
. L o
Fig. 4. Same asfor Fig. 3 but now for semicrystalline rnatmuh . . mfuu and short &shed lines w m u t symbols m w ref- to predictions of lengthand wuidthshrinkageaccordingto Eq 1.
a44
POLYMER ENGINEERING AND SCIENCE, MAY 1998, Vol. 38,No. 5
Effect of Processing Conditions on Shrinkage
a:
.--. - --.-- A.. . i PBT 1 'X-
-&
- .- - : : r . ? ' - .
---
,
I
0
20
40
60
Packing pressure [MPa]
L____
7
I
0
80
20
40
60
80
100
Injection velocity [ m d s ]
120
I
FYg. 5 . In-plane shrinkage of unfrued PBT [dotted lines) and 30% g l a s s m j i l l e d PBT [dashed lined).kjk effect of packing pressure: Right: e f f e t of injection velmity.
terms. The slope of the shrinkage versus pressure graphs, on the other hand, is proportional to the linear compressibility, p. For unfilled PBT, for example, the thermal contraction and crystallization contributions seem to be estimated correctly whereas the compressibility is probably far too small. In fact, an excellent fit for all molding conditions would be obtained if the linear compressibility would have been a factor of ten larger. We have reason to believe that for most experiments with crystalline materials, the product did not remain fixated in the mold and started to shrink before being completely solidified. In the derivation leading to Eq I , however, the product was assumed to remain fixed. It is therefore expected that experiments with constrained products should yield shrinkage results closer to the predicted ones. Alternatively, one can use the in-mold shrinkage analysis (1, 22) to get a more reliable prediction. Also, for the fiber filled PBT, the pressure term for width shrinkage was underestimated. For length shrinkage, on the other hand, the measured compressibility is of the right order but now the initial value is overestimated. The most probable cause of this overestimation is a too large value for the crystallization term, since thermal contraction is much smaller and relatively well understood. There is, in fact, no reason why (shear induced) crystallization should not cause anisotropic shrinkage, just as the other dilation terms. This, of course, then poses the practical problem of measuring the crystallization contraction in the three independent directions. An additional complication is that fibers most probably enhance shear induced crystallization (39). Considering the post-molding shnnkage in Table 3, we observe that all shrinkage rates are relatively small. A sample of polycarbonate, for example, experiences an extra shnnkage of only 0.01% between the first day after production and 100 days later. The data
POLYMER ENGINEERING AND SCIENCE, MAY 1998, Vol. 38,No. 5
for polycarbonate and polystyrene corresponds well with Greiner et aL (27)who reported at room temperature a three times larger volumetric shrinkage rate for PS as compared with PC. The negative number for width shrinkage of PBT-GF30 falls within the measurement uncertainty. The rather large difference between length and width shrinkage for HDPE is most probably related to recrystallization effects. CONCLUSIONS A N D FUTURE WORK
Shnnkage of injection molded products is most influenced by the holding pressure and the melt temperature. An increase in those parameters causes a decrease in shrinkage. The effects of injection velocity and mold temperature on shrinkage are much smaller and differ for each material. The simple thermoelastic model employed here to interpret the measurements was seen to give highly reliable predictions for all amorphous materials without any adjustable parameters. For semicrystalline materials, the shrinkages were overpredicted, which was attributed to in-mold shrinkage effects. ACKNOWLEDGIUENTS
The authors acknowledge PTN for their financial support and Dow Chemicals and Philips Drachten for kindly supplying most of the materials. Special thanks to Gerard Semmekrot, Ze Cunha, Kees Bos, Marco Freriksen and Hendrik de Vries, who all contributed to this project. R e d o Akkerman and Krista Bouma are kindly acknowledged for their help with the numerical calculations and DSC measurements, respectively. REFERENCES 1. K. M. B. Jansen, G. Titomanlio and R. Pantani, 'InMold Shrinkage Measurements of PS Samples With
Strain Gauges," Intern Poh~rnRoc.,XII, 4 (1997).
845
K. M.B.Jansen,D. J. v a n Dyk, and M.H . Husselman 2. D. Rosato and D. Rosato, Iyection Molding Handbook, 2nd ed., p. 484,Chapman and Hall, London (1995). 3. A.MamatetaL,PolyrnErg..Sci,35,1511 (1995). 4. H. Kumazawa, SPEANTEC Tech Papers,40,817(1994). 5. M. F. Bain e t aL, SPE ANTEC T e c h Papers, 38,977 ( 1992). 6. P. Delbarre et aL, SPEANTEC T e c h Papers, 37, 301 ( 1991). 7. A. I. Isayev and T. Hariharan, Polyrn Eng. Sci., 25,271 (1985). 8. M. R Nagy, SPEANTECTech Papers, 39,2155 (1993). 9. C. Liu a n d L. T. Manzione. Polyrn. Eng. Sci., 36. 1 (1996). 10. K. M. B. Jansen, G. Titomanlio, and R. Pantani, Polyrn Eng. Sci, 38,254(1998). 1 1. V. Leo and C. H. Cuvelliez, Fblyrn Eng. Sd, 36,1961 ( 1996). 12. C. A. Heiber et aL. SPEANIEC Tech Papers, 37, 259 (1991). 13. L. P. Herbert et d ,SPEANIEC Tech Papers, 37,430 (1991). 14. S.J. Ni and K. K. Wang, SPEANIEC T e c h Papers, 39, 612 (1993). 15.A. G. Gennari, SPE AIWEC T e c h Papers, 39,3436 ( 1993). 16. G. Burke a n d D. Kazmer, SPE AhTECH T e c h Papers. 58, 1354 (1992). 17. R.M. Shay et aL, Proc. RETEC (Nov. 1995). 18. H. Flies, Kunststofle, 84, 1710 (1994). T e c h Papers, 36, 19. C. S. Lee and A. Dubin, SPE 375 (1990). 20. R. Thomas and N. McCa!Tery SPEAhTEC Tech Papers. 35,371(1989). 21.W.Busko and V. K. Stokes, SPE AI\ITEC Tech Papers, 41,484 (1995). 22. G. Titomanlio and K. M. B. Jansen, PoZyrn Erg. Sci., 36,2041(1996).
846
23.K. M. B. Jansen. D. J. van Dijk. and M. J. A. Freriksen, "Shrinkage Anisotropy in Fiber reinforced Injection Molded Products,"Fblyrn Compos.,in preparation. 24.T.W. Schmidt, PhD thesis, R W H Aachen. Germany (1987). 25.Annual Book of ASlM Standards, Designation D995-89. Vol. 8.01 (1989). 26.L. C. E. Struik, Internal Stresses, Dimenswnal StabiLities and Molecular Orientations in Plastics, p. 177,Wdey and Sons,Brisbane (1990). 27.R. Greiner a n d F. R. Schwarzl. Rheol. Acta, 23,387 (1984). 28. K. M. B. Jansen and G. Titomado. Polym. Eng. Sci. 36,2029 (1996). o w Eng. Sci, 35,351 29. W. Busko a n d V. K. Stokes, P (1995). 30. C-Mold 4.0data. 31. VDMA, Kenndaten fuer die Verarbeitung Thermoplastischer Kunststoffe: h e r m o d y n a m i k , H a n s e r Verlag, Munich (1986). 32.P. Zoller and Walsh, Standard P r e s s u r e - V o ~ T ~ ature Datafor Polymers, Technomic Publishing Company, kincaster, Pa. (1995). 33. J. Brandrup and E. H. Immergut. PoZymer Handbook, Wiley a n d Sons,New York (1989). 34. E. Moore, ed., Styrene Polymers, Wiley and Sons (1989). 35.H. Domininghaus, Die Kunststoffe und ihre EigenschJen VDI Verlag, Dfisseldorf, Germany (1992). 36. K. M. B. Jansen, Experin Mech, (in press). 37. H. W. J. de Vries, Master's thesis (1996). 38. K. M. B. J a n s e n , Int. J . Heat M a s s Thnsf@, 38. 309 (1995). 39. B. Monasse, J . Mater. Sci, 27, 6047 (1992). Received Feb. 5, 1997 Revised July 1997
POLYMER ENGINEERING AND SCIENCE, MAY 1998, Vol. 38,No. 5