metals Article
Effect of Synthesizing Temperature on Microstructure and Electrochemical Property of the Hydrothermal Conversion Coating on Mg-2Zn-0.5Mn-Ca-Ce Alloy Guanghui Guo 1 , Dan Song 1,2,3, *, Jinghua Jiang 1, *, Aibin Ma 1,4 , Liwen Zhang 2 and Cheng Li 1 1 2 3 4
*
College of Mechanics and Materials, Hohai University, Nanjing 210098, China;
[email protected] (G.G.);
[email protected] (A.M.);
[email protected] (C.L.) Department of Material Science and Engineering, North Carolina State University, Raleigh, NC 27606, USA;
[email protected] School of Materials Science and Engineering, Southeast University, Nanjing 211100, China Jiangsu Collaborative Innovation Center of Advanced Micro/Nano Materials & Equipment, Nanjing University of Science and Technology, Nanjing 210094, China Correspondence:
[email protected] (D.S.);
[email protected] (J.J.); Tel.: +86-25-8378-7239 (D.S. & J.J.); Fax: +86-25-8378-6046 (D.S. & J.J.)
Academic Editors: Vineet V. Joshi and Alan Meier Received: 14 January 2016; Accepted: 15 February 2016; Published: 25 February 2016
Abstract: Mg(OH)2 conversion coatings were formed on an Mg-2Zn-0.5Mn-Ca-Ce alloy via hydrothermal method at three different synthesizing temperatures (160, 170 and 180 ˝ C). The effect of synthesizing temperature on microstructure and electrochemical property of the coatings were systematically studied. With increasing synthesizing temperature, the coating became thicker due to the faster reaction and deposition of Mg(OH)2 on the α-Mg phase and secondary phases of the substrate Mg alloy. Internal micro-cracks were also generated in the higher-temperature synthesized coatings due to the increased shrinking stress, but the cross-cutting micro-cracks were suppressed. Benefiting from the improved barrier effect against penetration of corrosive medium, the higher-temperature synthesized thicker coating presented significantly enhanced electrochemical property and anti-corrosion efficiency in Hanks’ solution. Keywords: conversion coating; electrochemical property
synthesizing temperature;
Mg alloy;
microstructure;
1. Introduction In recent years, Magnesium (Mg) alloys have been wildly reported as potential candidates for applications in biomaterials due to their bio-degradation ability, and similar densities and elastic modulus to that of human bone. The biomedical Mg alloys have been found to be applicable in numerous medical applications, such as bone screw, bone plates and vascular scaffold [1–4]. However, the main limitation of biomedical Mg alloys is the fast bio-degradation rate in human body [5]. Thus, it is of great practical significance to reduce the bio-degradation rate of the biomedical Mg alloy. Various methods, such as alloying [6,7], heat treatment [8,9] and surface treatment [10], have been employed to improve corrosion resistance of Mg implants. Coating on the Mg alloys can effectively provide a barrier between the metal and the corrosion medium to reduce the corrosion rate [11,12]. So far, there have been lots of coating technologies reported for Mg alloys, such as micro-arc oxidation [13], electrochemical-deposited coating [14], chemical conversion coating [15], and composited coating [16]. Hydrothermal synthesis of the protective coating on Mg alloys is also one of the most potential methods [17]. This method is simple, efficient, eco-friendly and low-cost. In addition, hydrothermal Metals 2016, 6, 44; doi:10.3390/met6030044
www.mdpi.com/journal/metals
Metals 2016, 6, 44
2 of 11
crystallization occurs on a 3-dimensional structure and therefore makes it easy to be industrially scaled up [18]. In our previous study [19], a novel kind of Mg-2Zn-0.5Mn-Ca-Ce alloy was designed and fabricated considering the trade-off between influence on human health and corrosion resistance. Corrosion resistance improvement of this new bio-medical Mg alloy was obtained, but the in-vitro bio-degradation rate was still not acceptable for medical standards. To further reduce the bio-degradation rate, the hydrothermal synthesis of the protective conversion coating in de-ionized water on this Mg alloy was conducted in this study. The effects of hydrothermal-synthesizing temperature on the microstructure and electrochemical property of the conversion coatings were systematically studied. 2. Experimental Section 2.1. Synthesizing Process of Conversion Coating The material to be coated was cut from a casting Mg-2Zn-0.5Mn-Ca-Ce alloy, which was designed and casted in our former research [19]. The chemical composition of this alloy was analyzed by inductively coupled plasma optical emission spectrometry (ICP-OES) (Iris Advantage 1000, Thermo Jarrell-Ash, Franklin, MA, USA), as listed in Table 1. The samples with a size of 10 mm ˆ 10 mm ˆ 5 mm were cut by an electric discharging machine, then polished with SiC papers successfully up to 1800 grades and ultrasonically cleaned in acetone and ethanol for each 5 min, following a drying process in air. Table 1. Chemical composition of Mg-2Zn-0.5Mn-Ca-Ce alloy (wt.%). Zn
Mn
Ca
Ce
Mg
2.00
0.50
1.02
1.35
balance
The reactor used in this experiment is a stainless steel autoclave (100 mL) with a Teflon liner. The de-ionized water was poured into the reactor to 70% volume as the reaction solution. Three parallel groups were treated in one reactor simultaneously. The reactor was heated via an electric furnace with a heating accuracy of 0.1 ˝ C. The hydrothermal-heating temperatures (synthesizing temperature) were selected as 160, 170 and 180 ˝ C, respectively, for the three parallel groups. And the synthesizing time for all the samples were set as 3 h. The coated samples were named as 160 ˝ C-coated sample, 170 ˝ C-coated sample, and 180 ˝ C-coated sample, respectively. 2.2. Microstructure Characterization The surface macro-morphologies of the coatings were observed by a digital microscope (Hirox, KH-7700, Hackensack, NJ, USA). The surface and cross-sectional micro-morphologies of the coatings, as well as the microstructure of the Mg alloy, were examined by scanning electron microscope (SEM, Hitachi, S3400-N, Tokyo, Japan). X-ray diffraction (XRD) analysis of the Mg alloy and coated sample was tested via a Bruker D8 Advance diffractometer (Bruker AXS, Karlsruhe, Germany) with Cu Kα1 radiation. The θ–2θ diffraction patterns were scanned from 10˝ to 90˝ with a scanning rate of 2˝ /min. 2.3. Corrosion Tests The electrochemical property of the coating in in-vitro environment were tested via a Parstat 2273 (Princeton, Oak Ridge, TN, USA) advanced potentiostat in the Hanks’ solution at the temperature of 37 ˝ C. Table 2 shows the chemical composition of the Hanks’ solution. The ion concentrations of the Hanks’ solution (Na+ = 141.84 mM, K+ = 5.77 mM, Mg2+ = 0.814 mM, Ca2+ = 1.261 mM, HCO3´ = 4.17 mM, HPO42´ = 0.338 mM, SO4 2´ = 0.814 mM, H2 PO4´ = 0.44 mM, Cl´ = 144.85 mM
Metals 2016, 6, 44
3 of 11
Metals D 2016, 6, 3 3 of 11 and -Glucose = 5.56 mM) were nearly equal to those of human blood plasma. The Hanks’ solution was renewed every single day to keep the corrosion environment consistent. In order for was renewed every dayout, to all keep the corrosion environment In order for electrochemical tests to single be carried the coated samples were molded inconsistent. the epoxy with a squared 2 electrochemical tests to be carried out, all the coated samples were molded in the epoxy with a exposure coating of 10 mm , while the substrate was connected by a copper wire. A three-electrodes cell 2 squared exposure coating of 10 mm of , while the substrate connected by a copper wire. Acalomel threewas employed, which was composed the tested sample aswas the working electrode, a saturated electrodes cell was employed, which was composed of the tested sample as the working electrode, a electrode (SCE) as the reference electrode, and a large-area platinum sheet as the counter electrode. saturated calomel electrode (SCE) as the reference electrode, and a large-area platinum sheet as the Three electrochemical measurements, including open circuit potential (OCP) test, electrochemical counter electrode. Three electrochemical measurements, including open circuit (OCP) test, impendence spectroscopy (EIS) test, and potentiodynamic polarization (PDP) test,potential were systematically electrochemical impendence spectroscopy (EIS) test, and potentiodynamic polarization (PDP) test, conducted. Since the OCP test would impact slightly negative effect on a sample, the same sample was were systematically conducted. Since the OCP test would impact slightly negative effect on a sample, tested continuously the OCP curve and the EIS curves while the OCP value was steady. Another new the samewas sample tested continuously the OCP curve and thesolution EIS curves the stable OCP value was sample usedwas for the PDP test, which was immersed in the for 1while h to get potential steady. Another new sample was used for the PDP test,which was immersed in the solution for h before the PDP tests. The immersion time of all OCP tests was set for 3600 s. The frequency range1of to get stable before PDP and tests.the The immersion time of allpotential OCP tests was 3600 s. EIS tests werepotential from 10 kHz to the 10 mHz, amplitude of sinusoidal was 20set mV.for The PDP The frequency range of EIS tests were from 10 kHz to 10 mHz, and the amplitude of sinusoidal ´ 1 tests were performed at a scan rate of 1 mV¨ s . potential was 20 mV. The PDP tests were performed at a scan rate of 1 mV·s−1.
Table 2. Chemical composition of Hanks’ solution. Table 2. Chemical composition of Hanks’ solution. Chemical Composition (mM)
Solution
Solution
NaCl NaCl
Hanks’ Hanks’
137 137
CaCl CaCl 22 1.261 1.261
Chemical Composition (mM) MgSO44 KCl KH2PO KH42 PONa Na2 HPO 4 2HPO 4 D -Glucose MgSO KCl 4 D-Glucose 0.814 5.33 0.44 0.44 0.3380.338 0.814 5.33 5.565.56
NaHCO33 NaHCO 4.17 4.17
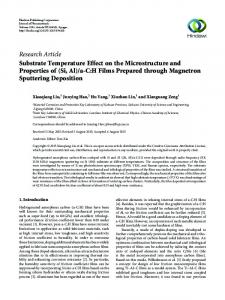
3. Results Resultsand andDiscussion Discussion 3.1. Microstructure Characteristic 3.1. Microstructure Characteristic of of the the Coatings Coatings Figure microstructure of of the the substrate substrate Mg Mg alloy. alloy. Clearly as marked, this alloy alloy Figure 11 shows shows the the SEM SEM microstructure Clearly as marked, this has Our previous previous study study has has two two kinds kinds of of microconstituents: microconstituents: α-Mg α-Mg phase phase and and secondary secondary phases. phases. Our has identified the secondary phases as Mg Ca, Mg Ca Zn and Mg CeZn phases, which were strip-like 2 6 2 12 identified the secondary phases as Mg2Ca, Mg6Ca Zn and Mg12CeZn phases, which were strip-like and and distributed distributed along along the the grain grain boundaries boundaries of of the the α-Mg α-Mg phase phase [19]. [19].
Figure Figure 1. 1. Microstructure Microstructure of of the the Mg Mg alloy. alloy.
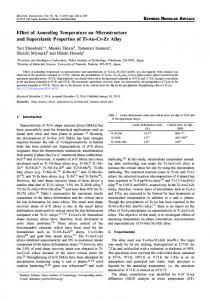
The XRD patterns of the uncoated and coated samples are shown in Figure 2. The instrument The XRD patterns of the uncoated and coated samples are shown in Figure 2. The instrument background has been subtracted from the initial XRD pattern. The XRD pattern of the uncoated alloy background has been subtracted from the initial XRD pattern. The XRD pattern of the uncoated alloy presents strong Mg phase peaks. Meanwhile, the weak secondary-phases (including Mg2Ca phase, presents strong Mg phase peaks. Meanwhile, the weak secondary-phases (including Mg2 Ca phase, Mg6Ca2Zn and Mg12CeZn) peaks can also be detected. The obtained Mg phase peaks present a little Mg6 Ca2 Zn and Mg12 CeZn) peaks can also be detected. The obtained Mg phase peaks present a little deviation from standard pure Mg peaks, which phenomenon should be caused by the solid-solution deviation from standard pure Mg peaks, which phenomenon should be caused by the solid-solution of alloying elements in the α-Mg phase. As reported in the references [20,21], the hydrothermal of alloying elements phase. As reported in the references [20,21], the synthesizing reactionsin ofthe the α-Mg conversion coating on Mg alloy using de-ionized water canhydrothermal be described as follows: H2O (l) H+ + OH− (aq)
(1)
Metals 2016, 6, 44
4 of 11
synthesizing reactions of the conversion coating on Mg alloy using de-ionized water can be described as follows: Metals 2016, 6, 3 4 of(1) 11 H2 O plq Ñ H+ ` OH´ paqq 2+ Mg 2e Mgpsq (s)ÑMg Mg2+paqq (aq)` + 2e
(2) (2)
+ 2H 2e ÑH H22 (g) pgq 2H+paqq (aq)` + 2e
(3) (3)
2+ ´ Mg paqq ÑMg(OH) MgpOHq22(s) psq Mg2+paqq (aq)`+ 2OH 2OH− (aq)
(4) (4)
The XRD patterns the coated presentMg(OH) typical 2Mg(OH) and Mg pattern. The XRD patterns of the of coated samplessamples present typical pattern and Mg pattern. According 2 pattern According to the coating reaction equation, the Mg(OH) pattern should be related to the coating to the coating reaction equation, the Mg(OH)2 pattern should be related to the coating layer, and Mg 2 layer, and Mg pattern should correspond to the α-Mg of the MgDue alloy to the pattern should correspond to the α-Mg phase of the Mgphase alloy substrate. tosubstrate. the coatingDue coverage, coating coverage, the feedback fromare the substrate are furthertoweakened to beFrom detected. the feedback signals from thesignals substrate further weakened be detected. the From XRD the XRD characterization, one can judge that the main composition of the obtained conversion coating characterization, one can judge that the main composition of the obtained conversion coating is is Mg(OH) Mg(OH) 2. 2 .
Figure 2. XRD patterns of the samples. Figure 2. XRD patterns of the samples.
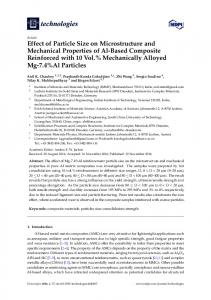
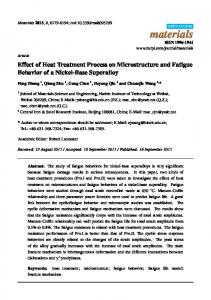
Figure 3 shows the macro surface-morphologies of the coatings synthesized at different Figure 3 Macroscopically shows the macro surface-morphologies of thehave coatings at Mg different temperatures. uniform and compact coatings been synthesized formed on the alloy temperatures. Macroscopically uniform and compact coatings have been formed on the Mg substrate at all synthesizing temperatures. Basically, the coatings show remarkable golden color.alloy The substrate at all synthesizing temperatures. Basically, the coatings show remarkable golden color. The surface color becomes darker with the synthesizing temperature increasing, which is accompanied surface color becomes darkermatte with textured the synthesizing increasing, which most is accompanied by the appearance of some features.temperature Such characteristics become noticeable by in the appearance of some matte textured features. Such characteristics become most noticeable in the the180 °C‐coated sample, which is marked as white arrows in Figure 3c. 180 ˝ C-coated sample, which is marked as white arrows in Figure 3c. Figure 4 represents the SEM surface morphologies of the coatings. In Figure 4a (low magnification), the coating surface of the 160 ˝ C-coated sample presents obvious net-like shape, which is similar to the distribution of secondary phase in the substrate Mg alloy. Meanwhile, some globular clusters with diameter about 20–40 µm are distributed on the coating surface. Careful examinations of SEM photographs with higher magnification (Figure 4b) reveal some micro defects, including micro-cracks and pores. It is also worth noting those micro defects always exist in the vicinity of the secondary phases of the Mg alloy substrate. In contrast, the coating layer on the α-Mg matrix is more compacter, and free of micro-cracks and pores under the set magnification. From the above observation, one can infer that the secondary phase is not well covered by the coating of the 160 ˝ C-coated sample. In Figure 3. Macro morphologies of the coated samples. (a) 160 °C-coated; (b) 170 °C-coated; (c) 180 °C-coated.
Figure 4 represents the SEM surface morphologies of the coatings. In Figure 4a (low magnification), the coating surface of the 160 °C‐coated sample presents obvious net-like shape,
Metals 2016, 6, 44
5 of 11
Figure 4b (170 ˝ C-coated sample with low magnification), as the synthesizing temperature elevated, the net-like shape of this coating surface become less obvious. This phenomenon should be caused by the better stacking of Mg(OH)2 on the secondary phases. Meanwhile, the globular clusters also grows up remarkably, presenting diameter of about 40–60 µm. As seen in Figure 4d, the clusters are composed by many coarse hexagonal flake structural units of Mg(OH)2 , presenting loose stacking structure. As reported in the references [22,23], the hexagonal flake structural unit is the basic form Metals 2016, 6, 3 5 of 11 of Mg(OH)2 stacking crystals. This kind of structural unit can be found all over the coatings, which which similarphase to the and distribution of secondary phase in the substrate Mg alloy. Meanwhile, some covers both theisα-Mg the secondary phase of the substrate. As the synthesizing temperature globular clusters about to 20–40 μm are distributed on the coating surface. Careful was further elevated to with 180 ˝diameter C, it is hard distinguish the net-like shape of the coating surface (as Figure XRD patterns of the samples. examinations of SEM photographs with2.higher magnification (Figure 4b) reveal some micro defects, seen in Figure 4e), and the globular clusters also disappear. Seen from Figure 4f, the secondary phase including micro-cracks and pores. It is also worth noting those micro defects always exist in the has beenvicinity well covered by Mg(OH) which presents even more stacking Mg(OH) Figure 3 secondary shows thephases macro surface-morphologies ofIn the coatings synthesized at different 2ofcrystals, of the the Mg alloy substrate. contrast, the coating layer on the α-Mg2 crystals Macroscopically uniform and compact coatings have been formed on the Mg alloy than thattemperatures. on the α-Mg matrix. However, the stacking Mg(OH) crystals on the secondary matrix is more compacter, and free of micro-cracks and pores under the phase is 2 the set magnification. From substrate at all synthesizing temperatures. Basically, coatings show remarkable golden color. The above observation, one is can infer that thethat secondary phase is not well covered by the ofobservation, the seem to be chalking, which looser than on thethe α-Mg matrix. Based on thecoating above surface color becomes darkerFigure with the temperature increasing, which is accompanied 160in°C‐coated sample. 4b synthesizing (170 sample with magnification), as the quantity the change color and macroInmorphologies of °C‐coated the coating should below caused by the different by the appearance of someelevated, matte textured features. Such characteristics become most less noticeable in synthesizing temperature the net-like shape of this coating surface become obvious. and stacking the Mg(OH) synthesized different temperatures. 2 crystals the180structure °C‐coated of sample, which is marked as white arrows inat Figure 3c. This phenomenon should be caused by the better stacking of Mg(OH)2 on the secondary phases. Meanwhile, the globular clusters also grows up remarkably, presenting diameter of about 40–60 μm. As seen in Figure 4d, the clusters are composed by many coarse hexagonal flake structural units of Mg(OH)2, presenting loose stacking structure. As reported in the references [22,23], the hexagonal flake structural unit is the basic form of Mg(OH)2 stacking crystals. This kind of structural unit can be found all over the coatings, which covers both the α-Mg phase and the secondary phase of the substrate. As the synthesizing temperature was further elevated to 180 °C, it is hard to distinguish the net-like shape of the coating surface (as seen in Figure 4e), and the globular clusters also disappear. Seen from Figure 4f, the secondary phase has been well covered by Mg(OH)2 crystals, which presents even more stacking Mg(OH)2 crystals than that on the α-Mg matrix. However, the stacking Mg(OH)2 crystals on the secondary phase is seem to be chalking, which is looser than that Figure Macro Based morphologies of theobservation, coated samples. (a) 160 in °C-coated; (b)macro 170 °C-coated; (c) of on the α-Mg3.matrix. on the above the change color and morphologies Figure 3.180 Macro morphologies of the coated samples. (a) 160 ˝ C-coated; (b) 170 ˝ C-coated; °C-coated. the˝coating should be caused by the different quantity and stacking structure of the Mg(OH)2 crystals (c) 180 C-coated. synthesized at different temperatures. Figure 4 represents the SEM surface morphologies of the coatings. In Figure 4a (low magnification), the coating surface of the 160 °C‐coated sample presents obvious net-like shape,
Figure 4. SEM surface morphologies of the coated samples at low and high magnification. (a) and (b)
Figure 4.are 160 SEM surface morphologies coated samples low180and high sample. magnification. °C‐coated sample; (c) and (d) areof 170the °C‐coated sample; (e) andat (f) are °C‐coated ˝ ˝ (a) and (b) are 160 C-coated sample; (c) and (d) are 170 C-coated sample; (e) and (f) are 180 ˝ C-coated sample.
Metals 2016, 6, 44
6 of 11
Figure 5 shows the cross-sectional morphologies of the coated samples, all the coatings are well Metals 2016, 6, 3 6 of 11 bonded to substrate. There are two remarkable differences between the three coated samples. One is the coating thickness, the other is the uniformity and compactness the coatings. As the synthesizing Figure 5 shows the cross-sectional morphologies of the coated of samples, all the coatings are well temperature increases, the coating thickening become more remarkable. The coating bonded to substrate. There are two remarkable differences between the three coated samples.thickness One is of ˝ C-coated sample is about 13–17 µm, while that of the 170 ˝ C-coated sample is about 25 µm. the 160 the coating thickness, the other is the uniformity and compactness of the coatings. As the synthesizing Whentemperature the synthesizing temperature was elevated to 180 the coating was increased increases, the coating thickening become more˝ C, remarkable. Thethickness coating thickness of the to ˝ °C‐coated about 13–17 that of the 170 °C‐coated sample is about μm. When 45–70160 µm, almost sample 4 timesisthicker thanμm, thatwhile of the 160 C-coated sample. Besides the25 obvious coating ˝ the synthesizing temperature was elevated to 180 °C, the coating thickness was increased to 45–70 thickening, the 180 C-coated sample has large fluctuations in the coating thickness, presenting less μm, almost times thicker than that of the 160Moreover, °C‐coated the sample. the obvious coating uniformity than 4the other two kinds of samples. 180 ˝Besides C-synthesized coating has less thickening, the 180 °C‐coated sample has large fluctuations in the coating thickness, presenting less compactness than the other two kinds of coatings, existing more internal micro-cracks. Those internal uniformity than the other two kinds of samples. Moreover, the 180 °C-synthesized coating has less micro-cracks distributed irregularly in the cross section of the coating, even at the substrate/coating compactness than the other two kinds of coatings, existing more internal micro-cracks. Those internal interface. Fortunately, bare cross-cutting micro-cracks continuously from the coating micro-cracks distributed irregularly in the cross section(cracks of the coating, even atexpand the substrate/coating surface to the substrate/coating interface) can be found. However, some cross-cutting interface. Fortunately, bare cross-cutting micro-cracks (cracks continuously expand frommicro-cracks the coating can ˝ be found in the 160substrate/coating C-coated sample with low (as marked in Figure 5a),micro-cracks and the bottom surface to the interface) canmagnification be found. However, some cross-cutting of these to be connected with themagnification secondary phase. Via careful can micro-cracks be found in theseems 160 °C‐coated sample with low (as marked in Figurecomparison 5a), and the with bottom of these micro-cracks seems to coatings be connected with the one secondary phase. Via careful localized cross-section morphologies of the (Figure 5b,d,f), can find that some secondary ˝ comparison with localized cross-section morphologies of the coatings (Figure 5b,d and f), one can to phase are occupied in the coating. In the 160 C-coated sample, the secondary phase seem to extend find that some secondary phase are occupied in the coating. In the 160 °C‐coated sample, the coating surface, which indicates that this secondary phase has not been well covered by the the coating. secondary phase seem to extend to the coating surface, which indicates that this secondary phase has ˝ In contrast, the secondary phases in the 170 and 180 C synthesized coatings have been surrounded not been well covered by the coating. In contrast, the secondary phases in the 170 and 180 °C completely, which directly indicates that these secondary phases have already been well covered by synthesized coatings have been surrounded completely, which directly indicates that these the coating. secondary phases have already been well covered by the coating.
Figure 5. SEM cross-sectional morphologies of the coated samples at low and high magnification. (a)
Figure 5. SEM cross-sectional morphologies of the coated samples at low and high magnification. and (b) are 160 °C‐coated sample; (c) and (d) are 170 °C‐coated sample; (e) and (f) are 180 °C‐coated (a) and (b) are 160 ˝ C-coated sample; (c) and (d) are 170 ˝ C-coated sample; (e) and (f) are sample. 180 ˝ C-coated sample.
Metals 2016, 6, 44 Metals 2016, 6, 3
7 of 11 7 of 11
3.2. 3.2. Electrochemical Properties Properties of of the the Coatings Coatings Electrochemical Electrochemical tests were performed performed to study the the electrochemical electrochemical properties of of the the coatings coatings in in the the Hanks’ Hanks’ solution. solution. Figure 6 presents the OCP OCP curves curves of of the the samples samples immersed immersed in in Hanks’ Hanks’ solution solution during initial 3600 3600 s.s.Generally, Generally,the thecoated coated samples have nobler OCP values compared with during the initial samples have nobler OCP values compared with the the uncoated alloy substrate. Note OCPvalues valuesofofthe the coated coated samples samples were actually uncoated Mg Mg alloy substrate. Note thatthat thethe OCP actually determined determined by the mixed electrode potential of both the substrate and the coating layer. Therefore, one potential in the Hanks’ one can can infer infer that that the the coating coating layer layer of of Mg(OH) Mg(OH)22 would have much nobler potential solution. C-coated samples has nobler OCP values compared C-coated and solution. The 180 ˝°C‐coated compared with with the the 160 160 ˝°C‐coated and ˝ C-coated samples. Therefore, the nobler OCP value of the 180 ˝ C-coated sample should 170 170 °C‐coated samples. Therefore, the nobler OCP value of the 180 °C‐coated sample should be be attributed to the thicker Mg(OH) In contrast with thetwo other two samples, attributed to the thicker Mg(OH) 2 coating layer.layer. In contrast with the other samples, the 180 the °C‐ 2 coating ˝ C-coated sample presents obvious fluctuation in OCP values in the initial immersion period for 180 coated sample presents obvious fluctuation in OCP values in the initial immersion period for 1800 s. 1800 This phenomenon should be caused by the exchange of the aggressive across the This s. phenomenon should be caused by the exchange of the aggressive mediummedium across the coating coating the corrosion reaction the substrate. Because of the largercoating coatingthickness thickness and and less and theand corrosion reaction in thein substrate. Because of the larger less compactness C-synthesized coating, it needs more time to get relatively relatively stable OCP values. values. compactness of of the the 180 ˝°C-synthesized
Figure 6. Open circuit potential (OCP) curves of the samples. Figure 6. Open circuit potential (OCP) curves of the samples.
EIS was further conducted to study the electrochemical characteristics of the coatings in the EIS was further conducted to study the electrochemical characteristics of the coatings in the Hanks’ Hanks’ solution. As shown in Figure 7, all Nyquist plots of the coated samples are composed of two solution. As shown in Figure 7, all Nyquist plots of the coated samples are composed of two capacitive capacitive loops and one inductive loops. Moreover, the uncoated sample is composed of one loops and one inductive loops. Moreover, the uncoated sample is composed of one capacitive loop and capacitive loop and one inductive loop. The inductive loop demonstrates that all the samples have one inductive loop. The inductive loop demonstrates that all the samples have been corroded to some been corroded to some extent. As reported by Mosiałek [24], two capacitive loops are the typical extent. As reported by Mosiałek [24], two capacitive loops are the typical Nyqusit plot of many coated Nyqusit plot of many coated samples, the high/low-frequency loop are related to EIS signal samples, the high/low-frequency loop are related to EIS signal responded from the substrate/coating, responded from the substrate/coating, respectively. It is noteworthy that both capacitive loops of the respectively. It is noteworthy that both capacitive loops of the coating and substrate increased with the coating and substrate increased with the synthesizing temperature, and this phenomenon is most synthesizing temperature, and this phenomenon is most obvious in the 180 ˝ C-coated sample. The obvious in the 180 °C‐coated sample. The capacitive loop diameter is associated with charge-transfer capacitive loop diameter is associated with charge-transfer resistance, the larger diameter the better resistance, the larger diameter the better corrosion resistance the experimental sample has. The corrosion resistance the experimental sample has. The increased capacitive loop can be presented as increased capacitive loop can be presented as the enhanced corrosion resistance of the coating and the enhanced corrosion resistance of the coating and the less corrosion damage in the substrate. The the less corrosion damage in the substrate. The Rs(Cf(Rp(CdlRt(RLL)))) equivalent circuit was used to Rs (Cf (Rp (Cdl Rt (RL L)))) equivalent circuit was used to simulate the EIS plots of the coated samples. simulate the EIS plots of the coated samples. This equivalent circuit was also used in Razavi’s research This equivalent circuit was also used in Razavi’s research on biomedical coating of Mg alloys [25]. on biomedical coating of Mg alloys [25]. The Rs(CdlRt(RLL)) equivalent circuit was used to simulate The Rs (Cdl Rt (RL L)) equivalent circuit was used to simulate the EIS plot of the uncoated sample. In the EIS plot of the uncoated sample. In the above models, Rs is the electrolyte solution resistance, Rp the above models, Rs is the electrolyte solution resistance, Rp and Cf represent the microporous and Cf represent the microporous resistance and capacitance of the Mg(OH)2 coating, Cdl and Rt resistance and capacitance of the Mg(OH)2 coating, Cdl and Rt represent the double layer capacitance represent the double layer capacitance and the charge transfer resistance of the substrate, RL and L and the charge transfer resistance of the substrate, RL and L represent the inductive arc. The fitted represent the inductive arc. The fitted parameters were listed in Table 3. The Rp value of the 180 °C‐ parameters were listed in Table 3. The Rp2 value of the 180 ˝ C-coated sample is about 14,800 ohms¨ cm2 , coated sample is about 14,800 ohms·cm , which is 10 and 2.47 times larger than those of the 160 °C‐ coated sample (1480 ohms·cm2) and 170 °C‐coated sample (6000 ohms·cm2), respectively.
Metals 2016, 6, 44
8 of 11
which is 10 and 2.47 times larger than those of the 160 ˝ C-coated sample (1480 ohms¨ cm2 ) and ˝ C-coated sample (6000 ohms¨ cm2 ), respectively. 170 Metals 2016, 6, 3 8 of 11
Figure7.7.Electrochemical Electrochemicalimpendence impendencespectroscopy spectroscopy(EIS) (EIS)Nyquist Nyquist plots the samples. Figure plots ofof the samples. Table 3. Fitted EIS parameters of samples. the samples. Table 3. Fitted EIS parameters of the
Sample Sample
uncoated
Rs (Ω·cm2) Rs (Ω¨ cm2 )
uncoated 160 °C‐coated 160 ˝ C-coated ˝ C-coated °C-coated 170170 ˝ C-coated 180180 °C-coated
24.67
24.67 14.96 14.96 13.1913.19 10.3610.36
Cf (10−6 F· cm−2)
Cf (10´6 F¨ cm´2 )
/
/ 31.1 31.1 19.219.2 12.812.8
Rp (Ω·cm2) Rp (Ω¨ cm2 )
/
/ 1480 1480 60006000 14800 14800
Cdl (10−6 F· cm−2) Cdl (10´6 F¨ cm´2 )
128.4
128.4 71.8 71.8 37.537.5 26.126.1
Rt (Ω·cm2) Rt (Ω¨ cm2 )
847
847 1204 1204 2148 2148 4830 4830
PDPtest test was conducted study coatings’ positive effect against corrosion propagation PDP was conducted to to study thethe coatings’ positive effect against the the corrosion propagation in in substrate the substrate under situation of strong polarization, and PDP curves are shownininthe theFigure Figure8.8. the under the the situation of strong polarization, and thethe PDP curves are shown Thecorrosion corrosion potentials (Ecorr ) and corrosion current densities ) were derived directly The potentials (Ecorr ) and thethe corrosion current densities (Icorr(I ) corr were derived directly from from the the curves PDP curves byTafel the extrapolation Tafel extrapolation method, andresults the results summarized in Table 4. It be can PDP by the method, and the werewere summarized in Table 4. It can be noticed thatEcorr the values Ecorr values the coated samples arenobler much than nobler that of the uncoated noticed that the of theof coated samples are much thatthan of the uncoated sample, sample, and their slightly increase with the elevating synthesizing The and their values alsovalues slightlyalso increase with the elevating synthesizing temperature. temperature. The nobler Ecorr noblershould Ecorr values should has directwith relationship withcoatings. the obtained coatings. Great can values has direct relationship the obtained Great difference candifference be found in thebe ˝ C-coated ˝ C-coated foundpolarization in the anodic polarization curves that theand 170180 °C‐coated and 180 °C‐coated samplesanodic present anodic curves that the 170 samples present obvious ˝ C-coated obviousin anodic passivity in the voltage rangeEof 150 mVthe above Ecorr, and the passivity of the 180 °C‐ passivity the voltage range of 150 mV above , and passivity of the 180 sample is corr ˝ coated sample is particularly evident. In contrast, the and uncoated sample and the 160 °C‐coated sample particularly evident. In contrast, the uncoated sample the 160 C-coated sample exhibits typical exhibits typical active dissolution behavior in the anodic polarization. In addition, the Isamples corr of the active dissolution behavior in the anodic polarization. In addition, the Icorr of the coated coated samples are extremely smaller than that of the uncoated sample, and drastically decrease are extremely smaller than that of the uncoated sample, and drastically decrease as the synthesizingas −7 A·cm−2) ´7 A¨ cm ´2 ) is the synthesizing temperature The Icorr˝ C-coated value of the 180 o(2.78 C‐coated (2.78 × 10 temperature increases. The Icorr increases. value of the 180 sample ˆ 10sample decreased −6 2A·cm−2) ´6 A¨×cm decreased by nearly 20 and 200 timeswith compared with the 160 o(5.42 C‐coated 10´ byis nearly 20 and 200 times compared those of thethose 160 ˝of C-coated ˆ 10(5.42 ) and −5 −2 ´ 5 ´ 2 and uncoated sample (5.85 A·cm), respectively. ), respectively. known, Icorrpresents presentsa akinetic kineticcharacteristic characteristic uncoated sample (5.85 ˆ 10 × 10 A¨ cm AsAs known, Icorr givenmetal-electrolyte metal-electrolytesystem, system,which whichcan can character character the the corrosion rate directly. The ofofa agiven The lower lower IIcorr corris, the less corrosion rate can be obtained. In our study, the corrosion current was created from the is, the less corrosion rate can be obtained. In the corrosion current was created from the corrosiondamage damageininMg Mg alloy substrate.Lower Lower Icorrmeans meansless lesscorrosion corrosiondamage damageininthe thesubstrate substrateofof corrosion alloy substrate. Icorr the180 180˝ C-coated °C‐coatedsample, sample,which whichalso alsosupports supportsthe thebetter betterprotection protectionofofitsitscoating. coating. the
Metals 2016, 6, 44 Metals 2016, 6, 3
9 of 11 9 of 11
Figure 8. Potentiodynamic polarization (PDP) curves of the samples. Figure 8. Potentiodynamic polarization (PDP) curves of the samples. Table 4. Ecorr and Icorr values obtained from the PDP curves. Table 4. Ecorr and Icorr values obtained from the PDP curves.
Samples uncoated Samples 160 °C-coated uncoated 170 °C-coated 160 ˝ C-coated 180 °C-coated 170 ˝ C-coated 180 ˝ C-coated
Ecorr (V) Ecorr−1.486 (V) −1.383 ´1.486 −1.366 ´1.383 −1.354 ´1.366 ´1.354
Icorr (A·cm−2) −5 Icorr (A¨ cm´2 ) 5.85 × 10 5.42 × 10⁻⁶ 5.85 ˆ 10´5 −7 5.42 ˆ 10´6 4.59 × 10 4.59 ˆ 10´7 2.78 × 10⁻⁷ 2.78 ˆ 10´7
3.3. Effect of Synthesizing Temperaturse on the Coating Formation 3.3. Effect of Synthesizing Temperaturse on the Coating Formation It is generally believed that a hydrophobic surface can reduce the penetration of electrolyte and enhance corrosion resistance coating system [26].can As areduce corrosion the microstructure It is the generally believed thatofathe hydrophobic surface the barrier, penetration of electrolyte of theenhance conversion such as thickness, compactness and uniformity, play great rolethe in and the coating, corrosion resistance of the coating system [26]. As should a corrosion barrier, the protective efficiency. In this research, coatings withcompactness better electrochemical property were microstructure of the conversion coating,thicker such as thickness, and uniformity, should synthesized oninthe at higherthicker temperatures. synthesizing play great role theMg-2Zn-0.5Mn-Ca-Ce protective efficiency. Inalloy this research, coatingsThe withincreased better electrochemical temperature to not only coating thickening alsotemperatures. the great change coating property werelead synthesized on the the significant Mg-2Zn-0.5Mn-Ca-Ce alloy at but higher The in increased microstructures. The thinner and the cross-cutting have been found thechange lowersynthesizing temperature leadcoating to not only significantmicro-cracks coating thickening but also the in great temperature synthesized sample (160 °C‐coated It is easiermicro-cracks for the penetration of aggressive in coating microstructures. The thinner coating sample). and cross-cutting have been found in ˝ C-coated will medium through a thinsynthesized coating layer, and the penetration also be the lower-temperature sample (160 sample). It accelerated is easier forvia thecross-cutting penetration micro-cracks. As descripted in aSEM the cracks on the 160 will °C-synthesized coating via are of aggressive medium through thinobservation, coating layer, and the penetration also be accelerated ˝ mainly over the secondary phase. Due to the lower coating formation reaction and coating deposition cross-cutting micro-cracks. As descripted in SEM observation, the cracks on the 160 C-synthesized on the secondary lesssecondary Mg(OH)2phase. crystalsDue willtobethe stacked the secondary theand coating on coating are mainlyphase, over the lower on coating formationphase, reaction coating this part will thinner thanless thatMg(OH) on the 2α-Mg phase. the on drying process, the thinner deposition on be themuch secondary phase, crystals willDuring be stacked the secondary phase, the coating on layer phase will result of phase. the shrinking leading to crosscoating thisover partthe willsecondary be much thinner thancrack that as onathe α-Mg Duringstress, the drying process, the cutting coating micro-cracks. As synthesizing temperature increased, thicker coatings werestress, obtained on the thinner layer over the secondary phase will crack as a result of the shrinking leading to substrate Mgmicro-cracks. alloy, and this was particularly obvious in the 180 °C‐coated sample. cross-cutting As phenomenon synthesizing temperature increased, thicker coatings were obtained on According toMg Y.Y. Zhu’s [22], the ionization of water, the in dissolution of Mg, and the the substrate alloy, andresearch this phenomenon was particularly obvious the 180 ˝ C-coated sample. formation to of Y.Y. Mg(OH) the hydrothermal synthesis processing can and be accelerated by According Zhu’s2 coating researchduring [22], the ionization of water, the dissolution of Mg, the formation the elevated synthesizing temperature. Benefiting from the faster reaction and deposition of of Mg(OH)2 coating during the hydrothermal synthesis processing can be accelerated by the elevated Mg(OH)2, more Mg(OH)2 Benefiting crystals will be the created deposited, leading to synthesizing temperature. from fasterand reaction and deposition of obvious Mg(OH)2coating , more thickening on the α-Mg phase and the secondary phases. Due to the enhanced coverage on the Mg(OH) crystals will be created and deposited, leading to obvious coating thickening on the α-Mg 2 secondary phase, the cracks on it will and thecoverage cross-cutting will bethe gradually phase and the secondary phases. Duebetoreduced, the enhanced on themicro-cracks secondary phase, cracks suppressed. Also, because of the more stacked Mg(OH)2,will more micro-cracks created of on it will be reduced, and the cross-cutting micro-cracks be internal gradually suppressed.were Also, because ˝internal thethe 180more °C-synthesized coating due to the increased shrinking stress. The presence of microof stacked Mg(OH) , more internal micro-cracks were created of the 180 C-synthesized 2 cracks will play to against corrosive medium.will However, those coating due to the negative increasedrole shrinking stress.the Thepenetration presence of of internal micro-cracks play negative internal micro-cracks are not connected continuously, which cannot provide a shortcut for the
Metals 2016, 6, 44
10 of 11
role to against the penetration of corrosive medium. However, those internal micro-cracks are not connected continuously, which cannot provide a shortcut for the penetration of aggressive medium. Considering the positive effect of thicker coating and the negative effect of internal micro-cracks, the enhanced barrier effect of the 180 ˝ C-synthesized coating should be attributed to the dominant effect of the thicker coating. 4. Conclusions Mg(OH)2 conversion coatings were fabricated on an Mg-2Zn-Mn-Ca-Ce biomedical Mg alloy through the hydrothermal synthesizing method at three different temperatures (including 160, 170 and 180 ˝ C). The obtained coatings were macroscopically uniform and compact, and provided an effective protection against corrosion in substrate Mg alloy. With increased synthesizing temperatures, the coating thickening became more remarkable due to the faster formation reaction and deposition of Mg(OH)2 on both α-Mg phase and secondary phases of the substrate Mg alloy. Internal micro-cracks were also created in the higher-temperature synthesized coatings due to the increased shrinking stress, but the cross-cutting micro-cracks were suppressed. Benefiting from the improved barrier effect against penetration of corrosive medium, the higher-temperature synthesized thicker coatings presented significantly enhanced electrochemical property and anti-corrosion efficiency in Hanks’ solution. Acknowledgments: This work was supported by Natural Science Foundation of China (Grant No. 51308111), Joint innovation fund project of Jiangsu province of China (Grant No. 20155017912), the fundamental research funds for the central universities (Grant No. 2015B18614) and Qing Lan Project of Jiangsu Province of China. Author Contributions: The work presented here was carried out in collaboration between all authors. Dan Song, Jinghua Jiang and Aibin Ma defined the research theme. Guanghui Guo, Liwen Zhang and Cheng Li designed methods and experiments, carried out the laboratory experiments, analyzed the data, interpreted the results and wrote the paper. All authors have contributed to, seen and approved the manuscript. The author hopes that this paper can make its due contribution to the successful application of the high-performance Mg alloy implant. Conflicts of Interest: The authors declare no conflict of interest.
References 1. 2. 3. 4. 5. 6. 7. 8. 9.
10.
Mani, G.; Feldman, M.D.; Patel, D.; Agrawal, C.M. Coronary stents: A materials perspective. Biomaterials 2007, 28, 1689–1710. [CrossRef] [PubMed] Witte, F.; Hort, N.; Vogt, C.; Cohen, S.; Kainer, K.U.; Willumeit, R.; Feyerabend, F. Degradable biomaterials based on magnesium corrosion. Curr. Opin. Solid State Mater. Sci. 2008, 12, 63–72. [CrossRef] Witte, F. The history of biodegradable magnesium implants: A review. Acta Biomater. 2010, 6, 1680–1692. [CrossRef] [PubMed] Mordike, B.L.; Ebert, T. Magnesium: Properties—applications—potential. Mater. Sci. Eng. A 2001, 302, 37–45. [CrossRef] Xin, Y.; Hu, T.; Chu, P.K. In vitro studies of biomedical magnesium alloys in a simulated physiological environment: A review. Acta Biomater. 2011, 7, 1452–1459. [CrossRef] [PubMed] Sun, Y.; Zhang, B.P.; Wang, Y.; Geng, L.; Jiao, X.H. Preparation and characterization of a new biomedical Mg-Zn-Ca alloy. Mater. Des. 2012, 34, 58–64. [CrossRef] Gu, X.; Zheng, Y.; Cheng, Y.; Zhong, S.; Xi, T. In vitro corrosion and biocompatibility of binary magnesium alloys. Biomaterials 2009, 30, 484–498. [CrossRef] [PubMed] Zhou, W.; Shen, T.; Aung, N.N. Effect of heat treatment on corrosion behaviour of magnesium alloy AZ91D in simulated body fluid. Corros. Sci. 2010, 52, 1035–1041. [CrossRef] Tsai, M.H.; Chen, M.S.; Lin, L.H.; Lin, M.H.; Wu, C.Z.; Ou, K.L.; Yu, C.H. Effect of heat treatment on the microstructures and damping properties of biomedical Mg-Zr alloy. J. Alloy. Compd. 2011, 509, 813–819. [CrossRef] Cui, X.J.; Lin, X.Z.; Liu, C.H.; Yang, R.S.; Zheng, X.W.; Gong, M. Fabrication and corrosion resistance of a hydrophobic micro-arc oxidation coatingon AZ31 Mg alloy. Corros. Sci. 2015, 90, 402–412. [CrossRef]
Metals 2016, 6, 44
11. 12. 13.
14. 15. 16. 17. 18. 19.
20. 21. 22. 23. 24.
25. 26.
11 of 11
Atrens, A.; Cao, F.; Shi, Z.; Dargusch, M.S. 3-Corrosion of Mg for Biomedical Applications. In Surface Coating Modification of Metallic Biomaterials; Woodhead Publishing: Cambridge, UK, 2015; pp. 1–102. Hornberger, H.; Virtanen, S.; Boccaccini, A.R. Biomedical coatings on magnesium alloys—A review. Acta Biomater. 2012, 8, 2442–2455. [CrossRef] [PubMed] Zhang, R.F.; Zhang, Y.Q.; Zhang, S.F.; Qu, B.; Guo, S.B.; Xiang, J.H. Formation process of micro arc oxidation coatings obtained in a sodium phytate containing solution with and without CaCO3 on binary Mg-1.0Ca alloy. Appl. Surf. Sci. 2015, 325, 79–85. [CrossRef] Razavi, M.; Fathi, M.; Savabi, O.; Beni, B.H.; Vashaee, D.; Tayebi, L. Nanostructured merwinite bioceramic coating on Mg alloy deposited by electrophoretic deposition. Ceram. Int. 2014, 40, 9473–9484. [CrossRef] Jiang, X.J.; Guo, R.G.; Jiang, S.Q. Microstructure and corrosion resistance of Ce-V conversion coating on AZ31 magnesium alloy. Appl. Surf. Sci. 2015, 341, 166–174. [CrossRef] Lu, Y.J.; Wan, P.; Tan, L.L.; Zhang, B.C.; Yang, K.; Lin, J.X. Preliminary study on a bioactive Sr containing Ca-P coating on pure magnesium by a two-step procedure. Surf. Coat. Technol. 2014, 252, 79–86. [CrossRef] Jeong, H.; Yoo, Y. Synthesis and characterization of thin films on magnesium alloy using a hydrothermal method. Surf. Coat. Technol. 2015, 284, 26–30. [CrossRef] Tomozawa, M.; Hiromoto, S. Growth mechanism of hydroxyapatite-coatings formed on pure magnesium and corrosion behavior of the coated magnesium. Appl. Surf. Sci. 2011, 257, 8253–8257. [CrossRef] Zhang, F.; Ma, A.B.; Song, D.; Jiang, J.H.; Lu, F.M.; Zhang, L.Y.; Yang, D.H.; Chen, J.Q. Improving in-vitro biocorrosion resistance of Mg-Zn-Mn-Ca alloy in Hanks’ solution through addition of cerium. J. Rare Earth 2015, 33, 93–101. [CrossRef] Zhu, Y.Y.; Wu, G.; Zhang, Y.H.; Zhao, Q. Growth and characterization of Mg(OH)2 film on magnesium alloy AZ31. Appl. Surf. Sci. 2011, 257, 6129–6137. [CrossRef] Gupta, R.K.; Mensah-Darkwa, K.; Kumar, D. Corrosion protective conversion coatings on magnesium disks using a hydrothermal technique. J. Mater. Sci. Technol. 2014, 30, 47–53. [CrossRef] Zhu, Y.Y.; Zhao, Q.; Zhang, Y.H.; Wu, G.M. Hydrothermal synthesis of protective coating on magnesium alloy using de-ionized water. Surf. Coat. Technol. 2012, 206, 2961–2966. [CrossRef] Zhou, W.; Shan, D.; Han, E.H.; Ke, W. Structure and formation mechanism of phosphate conversion coating on die-cast AZ91D magnesium alloy. Corros. Sci. 2008, 50, 329–337. [CrossRef] Mosiałek, M.; Mordarski, G.; Nowak, P.; Simka, W.; Nawrat, G.; Hanke, M.; Socha, R.P. Phosphate-permanganate conversion coatings on the AZ81 magnesium alloy: SEM, EIS and XPS studies. Surf. Coat. Technol. 2011, 206, 51–62. [CrossRef] Rzazvi, M.; Fathi, M.; Savabi, O.; Vashaee, D.; Tayebi, L. In vitro study of nanostructured diopside coating on Mg alloy orthopedic implants. Mater. Sci. Eng. C 2014, 41, 168–177. [CrossRef] [PubMed] Chiu, K.Y.; Wong, M.H.; Cheng, F.T.; Man, H.C. Characterization and corrosion studies of fluoride conversion coating on degradable Mg implants. Surf. Coat. Technol. 2007, 202, 590–598. [CrossRef] © 2016 by the authors; licensee MDPI, Basel, Switzerland. This article is an open access article distributed under the terms and conditions of the Creative Commons by Attribution (CC-BY) license (http://creativecommons.org/licenses/by/4.0/).