metals Article
Effect of Different Current Values on Microstructure and Mechanical Properties of Microalloyed Steels Joined by the Submerged Arc Welding Method Hasan Karabulut 1 , Mustafa Türkmen 2 , Mehmet Akif Erden 1 and Süleyman Gündüz 3, * 1 2 3
*
TOBB Tech. Sci. Vocational School, Karabuk University, Karabuk 78050, Turkey;
[email protected] (H.K.);
[email protected] (M.A.E.) Hereke Vocational School, Kocaeli University, Kocaeli 41380, Turkey;
[email protected] Engineering, Department of Manufact, Technology Faculty, Karabuk University, Karabuk 78050, Turkey Correspondence:
[email protected]; Tel.: +90-370-433-8200
Academic Editors: Halil Ibrahim Kurt, Adem Kurt and Necip Fazil Yilmaz Received: 23 October 2016; Accepted: 11 November 2016; Published: 16 November 2016
Abstract: In this study, microalloyed steels were joined by using the submerged arc welding method at different welding currents of 350 A, 400 A and 450 A. The effects of selected welding parameters on the microstructure and mechanical properties of welded materials were investigated. Tensile tests and microhardness measurements were performed. Microstructural changes have been identified in the welding zone. The results showed an increase in hardness and tensile strength depending on the current intensity. The heat affected zone was observed much wider with the increase in welding current. Keywords: microalloyed steel; submerged arc welding method; mechanical properties
1. Introduction The development of microalloyed carbon steels was one of the significant advances in the 1970s [1]. The main benefit of microalloyed steels is to provide important energy and cost savings in the manufacturing of forged components for automotive applications. In such steels, the strength levels and other properties achieved after cooling from hot working temperatures are reported to be comparable with those obtained from conventional quenched and tempered steels [2–4]. Microalloying or the use of additions of elements (V, Nb, and Ti) at small concentrations in low carbon steels has been successfully employed for large diameter pipelines, bridges, and other construction applications. This has been extended to medium carbon steels for various automotive engine and engineering applications. The microalloying elements produce precipitation of carbonitrides in austenite, and the pro-eutectoid ferrite and pearlite phases of the final microstructure in order to obtain grain refinement and precipitation strengthening [5–8]. Submerged arc welding (SAW) is extensively used in the iron and steel industry to fabricate pressure vessels, pipelines, marine vessels and wind turbine towers [9]. The extensive use of SAW is associated with certain inherent metallurgical and process advantages [10], such as (a) a high deposition rate (18 kg/h) and high electrode deposition efficiency; (b) low nitrogen in weld metal; (c) excellent weld bead appearance; and (d) possibility of welding over a wide range of thicknesses. This process finds a prominent place in fabrication industries due to high productivity and absence of smoke. Microalloying provides improved weldability by reducing carbon content; this was fairly quickly recognised and became a major driving force for the development and understanding of microalloyed steels. The use of microalloyed steel weldments in critical structural applications, such as offshore
Metals 2016, 6, 281; doi:10.3390/met6110281
www.mdpi.com/journal/metals
Metals 2016, 6, 281
2 of 7
platforms and arctic installations, has prompted the evaluation of factors affecting weld metal microstructure and mechanical properties [11,12]. In this study, microalloyed steels were joined by using the submerged arc welding method at 350 A, 400 A and 450 A with different welding currents. The effects of selected welding parameters on microstructure and mechanical properties of Metals 2016, 6, 281 2 of 7 welded materials were investigated. Tensile tests and microhardness measurements were performed. Microstructural changes were identifiedproperties in the welding zone. metal microstructure and mechanical [11,12]. In this study, microalloyed steels were joined by using the submerged arc welding method at 350 A, 400 A and 450 A with different welding
2. Materials Techniques currents.and TheExperimental effects of selected welding parameters on microstructure and mechanical properties of welded materials were investigated. Tensile tests and microhardness measurements were performed.
Plates of microalloyed steel with dimensions of 400 mm × 200 mm × 6 mm were used for welding Microstructural changes were identified in the welding zone. in this study. Table 1 illustrates the chemical compositions for the as-received metals and for the (Oerlikon-S2) submerged arc welding wire used for joining. 2. Materials and Experimental Techniques BeforePlates welding, microalloyed steels were heat treated at mm 100 ×◦ 6Cmm andwere then theforsamples of microalloyed steel with dimensions of 400 mm × 200 used welding were centered as face-to-face with a 1-mm interval; the welding process was performed as two passes in this study. Table 1 illustrates the chemical compositions for the as-received metals and for the from the front side and then the back side by using an Oerlikon Magmaweld brand ZD5-1000 B model (Oerlikon-S2) submerged arc welding wire used for joining. welding,machine microalloyed steels were heat treated at 100 °C Industry and then Inc., the samples were submergedBefore arc welding (Oerlikon Welding Electrodes and Manisa, Turkey). face-to-face withwere a 1-mm interval;by theusing welding was parameters performed as indicated two passes in from Three centered differentaswelded joints obtained theprocess welding Table 2. the front side and then the back side by using an Oerlikon Magmaweld brand ZD5-1000 B model SF-104 submerged arc welding powder was also used in the welding process. submerged arc welding machine (Oerlikon Welding Electrodes and Industry Inc., Manisa, Turkey). Three different welded joints obtainedcompositions by using theof welding parameters indicated in Table 2. Tablewere 1. Chemical test materials. SF-104 submerged arc welding powder was also used in the welding process. Materials
C
Si
Mn
P
S
Cr
Ni
Table 1. Chemical compositions of test materials.
Mo
V
Nb
Ti
Microalloyed Steel 0.13 0.8 1.02 0.02 0.01 1.50 1.1 0.33 0.1 0.06 0.05 Oerlikon Materials S2 (SAW wire) C0.08 Si 0.6 Mn 1.3 P 0.025 S0.025 Cr - Ni - Mo - V - Nb - Ti Microalloyed 0.13 0.8 1.02 0.02 0.01 1.50 1.1 0.33 0.1 0.06 0.05 Steel Table 2. The process parameters used in the submerged arc welding. Oerlikon S2 0.08 0.6 1.3 0.025 0.025 (SAW wire)
Sample No.
Welding Parameters
Current (A) Voltage (V) Welding Speed (cm/min) Heat Input (kJ/mm) Table 2. The process parameters used in the submerged arc welding.
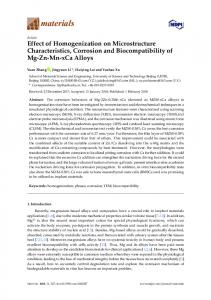
S1 350 30–32 42 1.34 Welding Parameters Sample No. S2 400 30–32 46 1.53 Current (A) Voltage (V) Welding Speed (cm/min) Heat Input (kJ/mm) S3 450 30–32 50 1.73 S1 350 30–32 42 1.34 S2 400 30–32 46 1.53 After submerged arc welding, tensile test samples were50prepared with an Ermaksan laser cutting S3 450 30–32 1.73 machine (Ermaksan Machinery Industry Trade were Inc., prepared Bursa, Turkey) according tocutting TS EN ISO After submerged arc welding, tensileAnd test samples with an Ermaksan laser machine (Ermaksan Machinery Industry And Trade Inc., Bursa, to TSofEN ISOspecimens. 4136 4136 standards, as shown in Figure 1 [13]. The weld zoneTurkey) was ataccording the center the standards, shown in Figure 1 [13]. was at the centerby of using the specimens. tensile The tensile test as was carried out at 4.76The × weld 10−4 zone s−1 tensile speed an Al¸saThe tensile testing −4 s−1 tensile speed by using an Alşa tensile testing machine (Alşa test was carried out at 4.76 × 10 ˙ machine (Al¸sa Laboratory Equipment Limited Company, Istanbul, Turkey) with 100 kN capacity. Laboratory Equipment Limited Company, İstanbul, Turkey) with 100 kN capacity.
Figure sample. Figure1.1.Tensile Tensile test test sample. In order to determine thestructural structural changes in the welded samples, grindinggrinding and polishing In order to determine the changes in the welded samples, and were polishing applied to them. Etching of samples was performed by using 2% HNO3 + 98% Ethyl alcohol solution were applied to them. Etching of samples was performed by using 2% HNO3 + 98% Ethyl alcohol
Metals 2016, 6, 281 Metals 2016, 6, 281
3 of 7 3 of 7
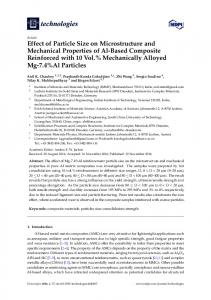
solution for 20 s. Microstructure examinations were performed with a Nikon Eclipse L150 brand for 20microscope s. Microstructure were performed with a The Nikon Eclipse L150 brand optical optical (Nikon examinations Instruments Europe BV, Amsterdam, Netherlands). microscope (Nikon Instruments Europe BV, Amsterdam, The Netherlands). Micro hardness measurements with Vickers indenter were carried out at a load of 300 g with Micro measurements with Vickers indenter were Hardness carried outwas at a taken load of20300 g with a a Qness Q10+hardness model device (Qness GmbH, Salzburg, Austria). points along Q10+ model devicesection. (Qness GmbH, Salzburg, Austria). was taken 20 points along theQness width of the welding Hardness was also taken Hardness for eight points, including the firstthe and width of the welding section. Hardness was also taken for eight points, including the first and second second weld metal along the thickness. Hardness measurements were made at 1 mm intervals along metal along the thickness. Hardness measurements were made at 1 mm intervals along the theweld measurement line. measurement line. 3. Results and Discussion 3. Results and Discussion 3.1. Microstructure 3.1. Microstructure The microstructure of the welded samples, joined by using different welding parameters, The microstructure of the welded samples, joined by using different welding parameters, were were analyzed with an optical microscope under different magnifications. Figures 2–4 show the analyzed with an optical microscope under different magnifications. Figures 2–4 show the microstructure of the as-received metal, heat affected zone (HAZ) and weld metal. The initial microstructureofofthe thesteel as-received metal, heatconsisted affected of zone (HAZ) weldstructure. metal. TheHowever, initial microstructure used in this study ferrite andand pearlite microstructure of the steel used in this study consisted of ferrite and pearlite structure. However, the the weld metal has polygonal ferrite and plate ferrite near the HAZ. Widmanstatten ferrite and a small weld metal has polygonal ferrite and plate ferrite near the HAZ. Widmanstatten ferrite and a small amount of martensite was also observed in the center of the weld metal. It is generally agreed that amount of martensite was also observed in the center of the weld metal. It is generally agreed that the different transformation structures, in a continuous cooled system with decreasing temperature, the different transformation structures, in a continuous cooled system with decreasing temperature, are as follows: (a) Grain boundary ferrite; (b) Polygonal ferrite; (c) Widmanstatten side plate ferrite; are as follows: (a) Grain boundary ferrite; (b) Polygonal ferrite; (c) Widmanstatten side plate ferrite; (d) Acicular ferrite; (e) Upper bainite; (f) Lower bainite and martensite [14]. Grain boundary ferrite (d) Acicular ferrite; (e) Upper bainite; (f) Lower bainite and martensite [14]. Grain boundary ferrite nucleates at the austenite grain boundary, after which, Widmanstatten side plate ferrite nucleates at nucleates at the austenite grain boundary, after which, Widmanstatten side plate ferrite nucleates at thethe grain boundary matrix planes, planes,while whileintragranular intragranularferrite ferrite grain boundaryferrite, ferrite,but butgrows growsalong along well-defined well-defined matrix nucleates entirely nucleates entirelywithin withinthe theaustenite austenitegrains grains [15,16]. [15,16]. Table 2 shows the calculated heat input Table 2 shows the calculated heat inputvalues valuesofofthe thewelded weldedjoints. joints. As As can can be be seen seen from from Table Table 2, the2, highest heatheat input value of 1.73 kJ/mm S3. Therefore, Therefore,the theHAZ HAZ the highest input value of 1.73 kJ/mmwas wasobtained obtained in in the the sample sample S3. ofof sample S3 (310 µm) is somewhat wider than the HAZ of the samples S1 (200 µm) and S2 (240 µm) sample S3 (310 µ m) is somewhat wider than the HAZ of the samples S1 (200 µ m) and S2 (240 µ m) as asseen seenin inFigures Figures2–4. 2–4.This Thisisisaaresult resultof ofthe theheat heatinput inputbeing beingincreased increasedwith withan anincreasing increasingwelding welding current [17,18]. current [17,18].
Figure Microstructure welded sample ferrite pearlite, plate ferrite (LF), martensite Figure 2. 2. Microstructure ofof welded sample S1:S1: ferrite (F),(F), pearlite, (P),(P), plate ferrite (LF), martensite (M), (M), polygonal ferrite (PF) and witmanstaten ferrite (WF). polygonal ferrite (PF) and witmanstaten ferrite (WF).
Metals 2016, 6, 281 Metals 2016, 6, 281 Metals 2016, 6, 281
4 of 7 4 of 7 4 of 7
Figure 3. Microstructure of welded sample ferrite (F), pearlite,(P), (P), plateferrite ferrite (LF),martensite martensite Figure 3. Microstructure of welded sample S2:S2: ferrite (F), pearlite, Figure 3. Microstructure of welded sample S2: ferrite (F), pearlite, (P),plate plate ferrite(LF), (LF), martensite(M), (M), polygonal ferrite (PF) and witmanstaten ferrite (WF). polygonal ferrite (PF) and witmanstaten ferriteferrite (WF).(WF). (M), polygonal ferrite (PF) and witmanstaten
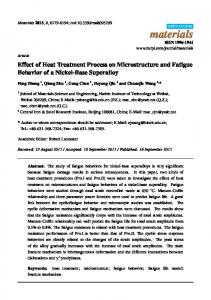
Figure 4. Microstructure of welded sample S3: ferrite (F), pearlite, (P), plate ferrite (LF), martensite Figure 4. Microstructure of welded sample S3: ferrite (F), pearlite, (P), plate ferrite (LF), martensite
(M),4.polygonal ferrite (PF) and witmanstaten Figure Microstructure of welded sample S3: ferrite ferrite (WF). (F), pearlite, (P), plate ferrite (LF), martensite (M), (M), polygonal ferrite (PF) and witmanstaten ferrite (WF). polygonal ferrite (PF) and witmanstaten ferrite (WF). 3.2. Mechanical Properties 3.2. Mechanical Properties 3.2. Mechanical Table 3Properties shows the yield strength (YS), ultimate tensile strength (UTS) and total elongation of S1, Table 3 shows the yield strength (YS), ultimate tensile strength (UTS) and total elongation of S1, S2 and S3 samples welded under different welding parameters (see Table 2). As seen, sample S2 Table thewelded yield strength (YS), ultimate strength (UTS)2).and S2 and 3S3shows samples under different welding tensile parameters (see Table As total seen, elongation sample S2 of showed the highest yield strength (609 MPa) and UTS (665 MPa). The highest values in YS and UTS S1, S2 and S3 samples under(609 different welding parameters Tablevalues 2). Asinseen, sample showed the highest welded yield strength MPa) and UTS (665 MPa). The(see highest YS and UTS S2 of sample S2 with increased welding current can be linked to the amount of Widmanstatten ferrite in of sample S2 withyield increased welding canUTS be linked to the amount of Widmanstatten in of showed the highest strength (609 current MPa) and (665 MPa). The highest values in YSferrite and UTS the transition area. An increase in the welding current raised heat input which encouraged the the S2 transition area. Anwelding increasecurrent in the welding current raised heat input which encouraged the sample with increased can be linked to the amount of Widmanstatten ferrite in the formation of Widmanstatten ferrite. Bodnar and Hansen [19] showed that the volume fraction of formation of Widmanstatten ferrite. Bodnar and Hansen [19] showed that the volume fraction of transition area. An ferrite increase in the welding heat input which encouraged the formation Widmanstatten increased with the current increaseraised in the prior austenite grain size and cooling rate. Widmanstattenferrite. ferrite increased with the increase in the prior austenite grain size and cooling rate. of Widmanstatten Bodnar and Hansen [19] showed that the volume fraction of Widmanstatten They concluded that both the yield strength and ultimate tensile strength of steel increased with an They concluded that both the yield strength and ultimate tensile strength of steel increased with an ferrite increased the fraction increaseofinWidmanstatten the prior austenite size and cooling increase in thewith volume ferrite grain and a reduction in ferriterate. grainThey size. concluded increase in the volume fraction of Widmanstatten ferrite and a reduction in ferrite grain size. S3 showed lower yield strength, tensile strength percentage than that bothSample the yield strengththe and ultimate tensile strength of steel and increased withelongation an increase in the Sample S3 showed the lower yield strength, tensile strength and percentage elongation than samples S1 and S2 (see Table 3). This is due a fracture formed in the HAZ of welded S3 samples. volume fraction of Widmanstatten ferrite andto a reduction in ferrite grain size. samples S1 and S2 (see Table 3). This is due to a fracture formed in the HAZ of welded S3 samples. However, theshowed fracture in samples S1 andstrength, S2 occurred in the as-received Lower elongation strength and Sample S3 lower yield tensile strength andmetal. percentage However, the fracture the in samples S1 and S2 occurred in the as-received metal. Lower strength andthan percentage elongation in sample S3 indicated extensive precipitation hardening in the HAZ region. samples S1 andelongation S2 (see Table 3). This is due toextensive a fractureprecipitation formed in the HAZ of samples. percentage in sample S3 indicated hardening in welded the HAZS3 region.
However, the fracture in samples S1 and S2 occurred in the as-received metal. Lower strength and percentage elongation in sample S3 indicated extensive precipitation hardening in the HAZ region.
Metals 2016, 6, 281
5 of 7
Metals 2016, 6, 281
5 of 7
In their work, Gondola [20]observed observedhigher higher residual residual stress in in thethe HAZ In their work, Gondola etetal.al.[20] stressand anddislocation dislocationdensity density HAZ region of microalloyed steel due to rapid cooling after welding. They also showed that the interaction region of microalloyed steel due to rapid cooling after welding. They also showed that the interaction between dislocations and precipitates or the carbon and nitrogen atoms in solid solution lead to a between dislocations and precipitates or the carbon and nitrogen atoms in solid solution lead to fracture in the Metals 2016,HAZ. 6, 281 5 of 7 a fracture in the HAZ. In their work, Gondola et al. [20] observed higher residual stress and dislocation density in the HAZ region of microalloyed steel due to rapid cooling after welding. They also showed that the interaction betweenNo. dislocations precipitates carbon and nitrogen atoms in solid solution lead to(%) a Sample Yield and Strength (MPa)or the Ultimate Tensile Strength (MPa) Elongation Sample No. Yield Strength (MPa) Ultimate Tensile Strength (MPa) Elongation (%) fracture in the HAZ. S1 596 653 17 653 17 15 S2 S1 609596 665 Table under different welding parameters. S2 3. Tensile test results 609of samples S1, S2 and S3 welded 665 15 S3 S3 520520 585 585 7 7 Sample No. Yield Strength (MPa) Ultimate Tensile Strength (MPa) Elongation (%) S1 596illustration of microhardness 653 17 Microhardness Figure 5 shows a schematic measurement areas. Figure 5 shows illustration of microhardness measurement areas. Microhardness S2 a schematic609 665 15 results of the welded samples S1, S2 and S3 are given in Figures 6–8. It was observed that the hardness S3 samples S1, 520 585 6–8. It was observed 7 that the hardness results of the welded S2 and S3 are given in Figures
Table 3. Tensile test resultsofofsamples samplesS1, S1,S2 S2and and S3 S3 welded welded under Table 3. Tensile test results underdifferent differentwelding weldingparameters. parameters.
of the welded samples S1, S2 and S3 raised when the measurement was carried out along the
of the welded measurement samples S1, S2 andfrom S3 raised when the measurement was outmetal. alongThe the horizontal horizontal the as-received metal to the HAZcarried or areas. weld highest Figure 5 shows aline schematic illustration of microhardness measurement Microhardness measurement line from the as-received metal to the HAZ or weld metal. The highest hardness hardness of 281 HV, 297 samples HV andS1,320 HVS3 was in the6–8. weld metal for samples S1, S2 and S3 of results of the welded S2 and are obtained given in Figures It was observed that the hardness 281respectively. HV, 297 HV and 320 HV was obtained in the weld metal for samples S1, S2 and S3 respectively. of the welded samples and S3 raised the measurement was that carried out widmanstatten along the In general, as S1, theS2welding currentwhen increases, it is possible more measurement line from the as-received metal to more the because HAZ or weld metal. The highest In general, the welding current increases, it isinpossible that widmanstatten ferrite or martensitic ferrite horizontal orasmartensitic structure can be formed the weld center of large austenite grains and of 281 HV, and center HV because was obtained in the austenite weld metal grains for samples S1, S2 andcooling structure can be formed in297 theHV weld of large and a high rate. a highhardness cooling rate. Generally, the 320 lowest and highest hardness values were obtained inS3the asrespectively. In general, as the welding current increases, it is possible that more widmanstatten received metal and weld metal respectively, for all welded samples. Hardness of HAZ was also found Generally,ferrite the lowest and highest hardness values were obtained in the as-received metal and weld or martensitic structure can be formed in the weld center because of large austenite grains and to be higher than that the as-received metal, lower than was that of the weld metal. These results metal respectively, for allofwelded samples. Hardness of hardness HAZ also found to beinhigher that a high cooling rate. Generally, the lowest andbut highest values were obtained the as-than are as-received consistent with the results obtained by Kurşun and [21]. received metal and weld metal respectively, forthe all welded samples. Hardness of HAZ was also found with the of the metal, but lower than that of weldTekin’s metal.study These results are consistent The hardness measurement was also carried along the of vertical measurement line for the to be higher than of theTekin’s as-received metal, but out lower than that the weld metal. These results results obtained by Kur¸ sthat un and study [21]. are consistent with the results obtained by Kurşun and that Tekin’s study [21]. values gradually decreases weld metal obtained by two passes. It was observed the hardness The hardness measurement was also carried out along the vertical measurement line for the weld Theweld hardness measurement was also carried out along theshows verticalthat measurement line for from second pass to the Itfirst pass. This second weld passtheapplies metal obtained by obtained two passes. wasweld observed thatsituation the values decreases from weld metal by two passes. It was observed that hardness the hardness values gradually gradually decreases stress relief annealing on first weld pass and therefore the hardness decreases accordingly (Figures second weld toweld the pass first toweld pass. This situation shows that second passapplies applies stress from pass second the first weld pass. This situation shows that secondweld weld pass 6–8). In his study, Lord [22] showed that the hardness of the weld metal does not only depend on stress relief on pass first weld and therefore the hardness decreases accordingly accordingly (Figures relief annealing onannealing first weld andpass therefore the hardness decreases (Figures 6–8). chemical composition, but [22] it can also that be affected by interpass transition temperatures. Kaya and 6–8). In his study, Lord showed the hardness of the weld metal does not only depend on chemical In his study, Lord [22] showed that the hardness of the weld metal does not only depend on Korkutchemical [23] alsocomposition, showed that armor welded two passes cools temperatures. down more slowly than the butthe it can alsosteel be affected byininterpass transition Kaya and composition, but italso can alsoand be affected bysteel interpass transition temperatures. Kaya and Korkut [23] steel welded in one pass, as the a result, that in increase hardness, suchmore as martensite, occurred Korkut [23] showed that armor phases welded two passes cools down slowly than the alsoless. showed that the armor steel welded in two passes cools down more slowly than the steel welded steel welded in one pass, and as a result, phases that increase hardness, such as martensite, occurred less.and as a result, phases that increase hardness, such as martensite, occurred less. in one pass,
Figure 5. Schematic illustration of microhardness measurement areas. Figure 5. 5.Schematic measurementareas. areas. Figure Schematicillustration illustration of of microhardness microhardness measurement
Figure 6. Microhardness test results of sample S1 (a) horizontal and (b) vertical.
Metals 2016, 6, 281 Metals 2016, 6, 281 Metals 2016, 6, 281
6 of 7 6 of 7 6 of 7
Figure 6. Microhardness test results of sample S1 (a) horizontal and (b) vertical. Figure 6. Microhardness test results of sample S1 (a) horizontal and (b) vertical.
Figure 7. Microhardness test results of sample sample S2 (a) (a) horizontal and and (b) vertical. vertical. Figure Figure 7. 7. Microhardness Microhardness test test results results of of sample S2 S2 (a) horizontal horizontal and (b) (b) vertical.
Figure 8. Microhardness test results of sample S3 (a) horizontal and (b) vertical. Figure 8. 8. Microhardness Microhardness test test results results of of sample sample S3 S3 (a) (a) horizontal horizontal and and (b) (b) vertical. vertical. Figure
4. 4. Conclusions Conclusions 4. Conclusions In In this this study, study, the the mechanical mechanical properties properties of of microalloyed microalloyed steels, steels, welded welded by by the the submerged submerged arc arc In this study,under the mechanical properties of microalloyed steels, welded by the submerged arc welding method different welding parameters, are investigated. The results welding method under different welding parameters, are investigated. The results obtained obtained from from welding method under different welding parameters, are investigated. The results obtained from present present study study are are as as follows: follows: present study are as follows: 1. 1. The The initial initial microstructure microstructure of of the the steel steel used used in in this this study study consisted consisted of of ferrite ferrite and and pearlite pearlite structure. structure. the weld metal of all welded samples has polygonal ferrite and plate ferrite near 1. However, The initial microstructure of the steel used in this study consisted of ferrite and pearlite However, the weld metal of all welded samples has polygonal ferrite and plate ferritestructure. near the the HAZ. Widmanstatten ferrite and a small amount of martensite was also observed in the However, the weld metal of all welded samples has polygonal ferrite and plate ferrite near the HAZ. Widmanstatten ferrite and a small amount of martensite was also observed in the center center of the metal. HAZ. Widmanstatten ferrite and a small amount of martensite was also observed in the center of of the weld weld metal. 2. An increase in the welding the weld metal. 2. An increase in the welding current current caused caused an an increase increase in in the the heat heat input. input. As As aa result result of of this, this, samples welded at higher welding currents showed a wider HAZ compared to the samples An increase in the current currents caused an increase in the HAZ heat input. As atoresult of this, 2. samples welded at welding higher welding showed a wider compared the samples welded lower currents. samplesat at higher welding currents showed a wider HAZ compared to the samples welded atwelded lower welding welding currents. 3. The highest ultimate tensile welded at lower welding currents. 3. The highest ultimate tensile strength strength was was measured measured as as 665 665 MPa MPa in in the the sample sample S2, S2, welded welded at at aa welding current of 400 A. This is due to the formation of Widmanstaten ferrite in the transition 3. welding The highest ultimate was MPa in the ferrite sample at current of 400tensile A. Thisstrength is due to themeasured formationas of 665 Widmanstaten inS2, thewelded transition area of the welded joints. An increase in the welding current raised the heat input which a welding current of 400 A. This is due to the formation of Widmanstaten ferrite in the transition area of the welded joints. An increase in the welding current raised the heat input which encouraged Widmanstatten ferrite. area of the the welded joints.of increase in the welding current raised the heat input which encouraged the formation formation ofAn Widmanstatten ferrite. 4. The highest hardness of 281 HV, 297 HV and 320 HV encouraged the formation of Widmanstatten ferrite. 4. The highest hardness of 281 HV, 297 HV and 320 HV was was obtained obtained in in the the weld weld metal metal for for samples samples and respectively. general, as the welding current increases, that more 4. S1, TheS2 highest hardness of 281In HV, 297 HV HV was obtained in the it weld metal for samples S1, S2 and S3 S3 respectively. In general, asand the320 welding current increases, it is is possible possible that more widmanstatten ferrite or martensitic structure can be formed in the weld center because of large S1, S2 and S3 respectively. In general, as the welding currentinincreases, is possible that widmanstatten ferrite or martensitic structure can be formed the welditcenter because ofmore large austenite grains and a high cooling rate. widmanstatten martensitic structure can be formed in the weld center because of large austenite grainsferrite and a or high cooling rate. austenite grains and a high cooling rate.
Author Contributions: Mustafa Türkmen, Hasan Karabulut and Mehmet Akif ERDEN performed the Author Contributions: Mustafa Türkmen, Hasan Karabulut and Mehmet Akif ERDEN performed the experiments, analyzed the data and wrote the paper; Süleyman Gündüz conceived and designed the experiments, analyzed the data Türkmen, and wrote Hasan the paper; Süleyman Gündüz Akif conceived andperformed designed the the Author Contributions: Mustafa Karabulut and Mehmet ERDEN experiments, contributed to the discussion and interpretation of the results. experiments,analyzed contributed theand discussion and interpretation the results. experiments, the to data wrote the paper; Süleyman of Gündüz conceived and designed the experiments, contributed the discussion and interpretation of theofresults. Conflicts ofto Interest: The authors declare no conflict interest. Conflicts of Interest: The authors declare no conflict of interest.
Metals 2016, 6, 281
7 of 7
Conflicts of Interest: The authors declare no conflict of interest.
References 1. 2.
3. 4. 5. 6. 7. 8. 9. 10. 11. 12. 13. 14. 15. 16. 17.
18. 19. 20. 21. 22. 23.
Matlock, D.K.; Krauss, G.; Speer, J.G. Microstructures and properties of direct cooled microalloy forging steels. J. Mater. Process. Technol. 2001, 117, 324–328. [CrossRef] Balart, M.J.; Davis, C.L.; Strangwood, M. Fracture behaviour in medium-carbon Ti–V–N and V–N microalloyed ferritic-pearlitic and bainitic forging steels with enhanced machinability. Mater. Sci. Eng. A 2002, 328, 48–57. [CrossRef] Khalid, F.A. Precipitation and compositional changes in the structural phases of microalloyed automotive steels. Mater. Sci. Eng. A 2002, 325, 281–285. [CrossRef] Gündüz, S.; Acarer, M. High-temperature tensile and wear behaviour of microalloyed medium carbon steel. Ind. Lubr. Tribol. 2005, 57, 145–149. [CrossRef] Gladman, T. The Physical Metallurgy of Microalloyed Steels, 1st ed.; The Institute of Materials: London, UK, 1997. Parsons, S.A.; Edmonds, D.V. Microstructure and mechanical properties of medium-carbon ferrite-pearlite steels microalloyed with vanadium. Mater. Sci. Technol. 1987, 3, 894–904. [CrossRef] Gündüz, S.; Acarer, M. The effect of heat treatment on high temperature mechanical properties of microalloyed medium carbon steel. Mater. Des. 2006, 27, 1076–1085. [CrossRef] Erden, M.A.; Gündüz, S.; Türkmen, M.; Karabulut, H. Microstructural characterization and mechanical properties of microalloyed powder metallurgy steels. Mater. Sci. Eng. A 2014, 616, 201–206. [CrossRef] Olson, D.L.; Siewert, T.A.; Liu, S.; Edwards, G.R. ASM Handbook Volume 6: Welding, Brazing and Soldering, 9th ed.; ASM International: Metals Park, OH, USA, 1983; Volume 6. American Welding Society (AWS). Welding Handbook, 8th ed.; AWS: Miami, FL, USA, 1995. Bajic, N.; Zeravcic, V.S.; Bobic, B.; Cikara, D.; Arsic, M. Filler metal influence on weld metal structure of microalloyed steel. Weld. J. 2011, 90, 55–62. Hunt, A.C.; Kluken, A.O.; Edwards, G.R. Heat input and dilution effects in microalloyed steel weld metals. Weld. J. 1994, 73, 9–15. TS EN ISO 4136. Destructive Tests on Welds in Metallic Materials—Transverse Tensile Test; Turkish Standardization Institute: Ankara, Turkey, 2013. Welding Institute. Compendium of Weld Metal Microstructures and Properties; The Welding Institute: Cambridge, UK, 1985. Babu, S.S.; Bhadeshia, H.K.D.H. Transformation from bainite to acicular ferrite in reheated Fe–Cr–C weld deposites. Mater. Sci. Technol. 1990, 6, 1005–1019. [CrossRef] Esmailian, M. The effect of cooling rate and austenite grain size on the austenite to ferrite transformation temperature and different ferrite morphologies in microalloyed steels. Iran. J. Mater. Sci. Eng. 2010, 7, 7–14. Unlu, B.S.; Yılmaz, S.S.; Uzkut, M. Microstructure and mechanical properties of welding zone by mig/mag welding joined at different currents. In Proceedings of the 6th International Advanced Technologies Symposium, Elazıg, ˘ Turkey, 16–18 May 2011. Suresh, M.V.; Krishna, B.V.; Venugopal, P.; Rao, K.P. Effect of pulse frequency in gas tungsten arc welding of powder metallurgical preforms. Sci. Technol. Weld. Join. 2004, 9, 362–368. [CrossRef] Bodnar, R.L.; Hansen, S.S. Effects of Widmanstätten ferrite on the mechanical properties of a 0.2 pct C-0.7 pct Mn steel. Metall. Mater. Trans. A 1994, 25, 763–773. [CrossRef] Gondoh, H.; Sato, M.; Kanaya, K.; Miyasaka, A.; Yoshida, I. Behaviour of nitrogen, nitrides, carbides in weld HAZ. Trans. Iron Steel Inst. Jpn. 1981, 10, 444–448. Kur¸sun, T.; Teker, T. Effect on microstructure and hardness of synergic controlled pulsed (MIG-P) and manual (MIG) welding of AISI430/AISI1030 steel couples. Electron. J. Mach. Technol. 2008, 8, 27–37. Lord, M. Interpass temperature and the welding of strong steels. Weld. World 1998, 41, 452–459. Kara, S.; Korkut, M.H. Investigation the effect of welding groove on metallurgical and mechanical properties in armor steels. Electron. J. Mach. Technol. 2012, 9, 35–45. © 2016 by the authors; licensee MDPI, Basel, Switzerland. This article is an open access article distributed under the terms and conditions of the Creative Commons Attribution (CC-BY) license (http://creativecommons.org/licenses/by/4.0/).