AIAA 2007-6554
AIAA Guidance, Navigation and Control Conference and Exhibit 20 - 23 August 2007, Hilton Head, South Carolina
Effects of Automated Arrival Management, Airborne Spacing, Controller Tools, and Data Link Thomas Prevot 1 , Todd Callantine 2 , Jeff Homola 3 , Paul Lee 4 , Joey Mercer 5 San Jose State University/NASA Ames Research Center tprevot, tcallantine, jhomola, plee,
[email protected], Moffett Field, CA Everett Palmer 6 , Nancy Smith 7 , NASA Ames Research Center epalmer, nsmith @mail.arc.nasa.gov, Moffett Field, CA
The effects of automated arrival management, airborne spacing, controller tools, and data link on airspace operations were investigated in an air/ground simulation at NASA Ames Research Center in September 2006. Four radar-certified air traffic control (ATC) specialists in the Airspace Operations Laboratory (AOL), eight glass cockpit pilots in the Flight Deck Display Research Laboratory (FDDRL), and additional “ghost” pilots and controllers operated a heavy eastbound arrival push into Louisville’s Standiford airport (SDF) with high density crossing traffic. An arrival management system scheduled aircraft along Continuous Descent Approaches (CDAs) and data linked arrival information to participating aircraft automatically throughout the simulation. The 2x3 test matrix varied two flight deck conditions: (1) with and (2) without airborne spacing, over three ATC workstation conditions: (1) current day, (2) advanced ATC scheduling and spacing tools, and (3) the same tools integrated with controller pilot data link communication. The process of automatically data linking arrival messages to participating aircraft based on a runway schedule proved to be very effective in all conditions. Flight deck-initiated speed changes to meet the CDA speed schedule and lead aircraft assignments were acceptable to pilots and controllers. Airborne spacing reduced the mean and the variance of the inter-arrival spacing on final approach, consistent with prior research. Controller scheduling and spacing tools improved handling of non-participating aircraft which did not receive the arrival information. Energy management along the CDAs was a primary issue.
The research is sponsored by the Super Density Operations element of NASA’s NGATS Airspace program and coordinated with the US merging and spacing team, with participation by the FAA, UPS, MITRE, and NASA.
Nomenclature AAC ADS-A/B ADRS AOC ASAS ASDI
= = = = = =
Advanced Airspace Concept Automatic Dependent Surveillance-Addressed/Broadcast Aeronautical Data link and Radar Simulator Airline Operational Control Airborne Separation Assistance System Aircraft Situation Display to Industry
1
Senior Research Engineer, Human Systems Integration Division, NASA ARC, MS 262-4, AIAA member. Senior Research Engineer, Human Systems Integration Division, NASA ARC, MS 262-4, AIAA member 3 Masters Student, Human Systems Integration Division, NASA ARC, MS 262-4 4 Research Psychologist, Human Systems Integration Division, NASA ARC, MS 262-4. 5 Research Associate/Masters Student, Human Systems Integration Division, NASA ARC, MS 262-4 6 Human Factors Engineer, Human Factors Research and Technology, NASA ARC, MS 262-4. 7 Research Psychologist, Human Factors Research and Technology, NASA ARC, MS 262-4 2
1 American Institute of Aeronautics and Astronautics This material is declared a work of the U.S. Government and is not subject to copyright protection in the United States.
AOL ASAS ATM ATOL ATOP ATSP CD&R CDTI CHI CO-ATM CPDLC CSD CTAS DAG-TM DSR DST E/DA ETMS FAA FD FDDRL FMS JPDO MACS M&S NAS NASA NGATS TMA TRACON RVSM STARS
= = = = = = = = = = = = = = = = = = = = = = = = = = = = = = = =
Airspace Operations Laboratory at NASA Ames Airborne Separation Assistance System Air Traffic Management Air Traffic Operations Laboratory at NASA Langley Advanced Technologies and Oceanic Procedures Air Traffic Service Providers Conflict Detection and Resolution Cockpit Display of Traffic Information Computer Human Interface Co-Operative Air Traffic Management Controller Pilot Data Link Communication Cockpit Situation Display Center/TRACON Automation System Distributed Air Ground traffic Management Display System Replacement (Center Controller Workstation in the NAS) Decision Support Tool Enroute and Descent Advisor Enhanced traffic Management System Federal Aviation Administration Flight Deck Flight Deck Display Research Laboratory at NASA Ames Flight Management System Joint Planning and Development Office Multi Aircraft Control System Merging and Spacing National Airspace System National Aeronautics and Space Administration Next Generation Air Transportation System Traffic Management Advisor Terminal RADAR Approach Control Reduced Vertical Separation Minima Standard Terminal Automation Replacement System (TRACON Controller Workstation in the NAS)
I. Introduction
T
HIS paper examines the impact of several important new technologies on air traffic operations. Several of the flight deck and ground side technologies under investigation are on the verge of being phased into the air transportation system and will as such change the airspace operations landscape irreversibly. Therefore, it is important to determine whether and how these evolutionary steps will impact the far-term plans for a complete transformation of the airspace system. The Joint Planning and Development Office (JPDO) has been established to transform the U.S. air transportation system by 2025. According to JPDO, the Next Generation Air Transportation System (NGATS) will be more flexible, resilient, scalable, adaptive, and highly automated than today’s system – meeting up to two to three times current demand. The NGATS includes security, safety, and efficiency of passenger, cargo and aircraft operations. Aircraft will be able to use information technology in a more robust way, with enhanced capabilities in the cockpit, better navigation and landing capabilities, and far more comprehensive and accurate knowledge of weather and traffic conditions in real time.1,2 Similarly, the European Commission (EC) launched the Single European Sky the ATM Research (SESAR) program, to achieve a future European ATM System for 2020 and beyond, which can meet following objectives: Relative to today's performance enable a 3-fold increase in capacity while also reducing delays both on the ground and in the air; Improve the safety performance by a factor of 10; enable a 10% reduction in the environmental effects; And provide ATM services at a cost to the airspace users which is at least 50% less. 3 Both initiatives aim at drastic air traffic system improvements that can at least double capacity in the next twenty years. Fundamental laboratory research is required to define and develop a transformed system that can meet these objectives. In parallel, the real world air traffic management systems are evolving such that, many near- to medium2 American Institute of Aeronautics and Astronautics
term initiatives will make use of advanced technologies to achieve incremental benefits. Aligning the necessary near-term evolutionary progress with the long-term transformation of the air transportation system will be a major challenge. The research presented in this paper is a laboratory simulation to assess -for a specific context- the future direction and far-term potential of some major near-term initiatives: airborne merging and spacing, continuous descent arrivals, trajectory-based arrival management, decision support tools for air traffic controllers, and data link.
II. Background The framework for the simulation is a concept under investigation at NASA Ames Research Center called ‘trajectory-oriented operations with limited delegation’ (TOOWiLD). The underlying principles for combining 4D trajectory-based operations with relative spacing were discussed at the Air Traffic Management R&D seminar in 2003 4, 5. The concept was further refined to achieve efficiency and capacity benefits through a combination of timebased traffic flow management, trajectory-oriented operations, and delegation of spacing tasks to flight crews of appropriately equipped aircraft 6,7. A possible far-term path for this concept entitled ‘Co-operative Air Traffic Management’ that includes additional new technologies and modified pilot and controller roles and responsibilities was presented at the ATM R&D seminar in 2005 8. One of the key features of the concept is to enable efficient low power idle descents for as many arriving aircraft as possible in a highly complex traffic environment. It is closely related to near-term efforts at many airports worldwide that are introducing Continuous Descent Arrivals (CDA) to reduce fuel consumption, noise and emissions. Flying CDAs in low density environments is generally considered feasible with current day technologies. In contrast, conducting CDAs routinely in high density airspace requires more advanced solutions. Current approaches include improved arrival management tools and procedures for controllers, data linking required times of arrival to the runway, data linking dynamic route changes, and conducting airborne merging and spacing along the CDAs 9-13. Research on time-based flow management and trajectory-oriented metering has demonstrated improved compliance with metering constraints and better situation awareness for controllers at high and low altitude merge points 14, 15. Little research has been conducted on the integration with CDAs or runway metering schemes. Air traffic service providers have already installed arrival management systems, such as the CTAS Traffic Management Adviser (TMA) in the US.
Centralia
•
•
M&S En Route Operations Inbound aircraft are “preconditioned” using GOC speed advisories based on sequence and spacing at en route merge fix. Spacing advisories may also be assigned. Advisories are sent to the flight deck using ACARS. Little-to-no ATC involvement.
• • •
Cheri SDF
M&S Arrival Operations Aircraft that are within ADS-B range may engage airborne merging and spacing. “Preconditioned” SDF arrivals are cleared by ATC for CDAs. Little-to-no ATC involvement.
Figure 1. M&S concept for en route and arrival operations. 3 American Institute of Aeronautics and Astronautics
Research on airborne merging and spacing has shown feasibility in arrival problems and indicated potential benefits in reducing the spacing variability on final approach 16, 17, 18. Requirements for airborne spacing are currently determined by the Requirements Focus Group. The United Parcel Service (UPS) airline has started the process of equipping their fleet with airborne merging and spacing algorithms hosted in the electronic flight bag (EFB) and plans on initial field trials in 2007. The Merging and Spacing Group (M&S group) has been formed in the US with involvement of the FAA, UPS, MITRE and NASA to plan and coordinate the near- to medium term merging and spacing research and development efforts in conjunction with the FAA’s Surveillance and Broadcast Services office. Figure 1 illustrates the near-term concept pursued by the M&S group for managing eastbound late night UPS arrivals into Louisville Standiford airport. The M&S operations depicted in Figure 1 can be viewed as a near-term implementation of trajectory-oriented operations with limited delegation (Figure 2). Time-based traffic management is initially conducted at the UPS Global Operations Center (GOC) based on 4D trajectories along Continuous Descent Arrivals. Relative spacing is engaged when aircraft are within ADS-B range and in an appropriate position to do so. The initial spacing information will be data linked from the GOC via ACARS to the aircraft. Field tests were conducted in 2006 at Louisville to test a concept for en route metering by sending speed assignments from UPS-based arrival management tools and follow-on tests adding initial airborne merging and spacing capabilities are expected to be conducted in 2007. This near-term application will initially be conducted in low density environments with a single merge point. The simulation described in this paper looks beyond this important near-term phase and investigates these kinds of operations in high density airspace with multiple traffic flows and merge points.
III. Method An air/ground simulation of a site-specific concept implementation with pilots and controllers in the loop was conducted in September 2006 in the Airspace Operations Laboratory (AOL) and the Flight Deck Display Research Laboratory at NASA Ames Research Center 19, 20. The 2x3 test matrix varied two flight deck conditions: (1) with and (2) without airborne spacing, over three ATC workstation conditions: (1) current day, (2) advanced ATC
Arrival Arrival Management Management System System uplinks uplinks arrival arrival message message to to participating participating aircraft aircraft including including runway runway STA STA and and speed speed schedule schedule for for on-time on-time Continuous Continuous Descent Descent Arrival Arrival Arrival Arrival message message includes includes airborne airborne spacing spacing information information for for equipped equipped aircraft aircraft as as appropriate. appropriate.
Flight Flight crews crews execute execute clearances clearances and and speed speed advisories. advisories. Flight Flight crews crews engage engage and and follow follow spacing spacing guidance guidance when when within within ADS-B ADS-B range. range.
Runway Threshold
Controllers Controllers monitor monitor all all arrivals. arrivals.
Runway STA assignment 300 NM from airport Controllers Controllers issue issue CDA CDA clearances, clearances, are are informed informed about about airborne airborne spacing spacing of of participating participating aircraft aircraft and and intervene intervene ifif required required for for separation, separation, and and manage manage non-participating non-participating aircraft aircraft
Figure 2: Concept of operations for managing arrivals during simulation 4 American Institute of Aeronautics and Astronautics
scheduling and spacing tools, and (3) the same tools integrated with controller pilot data link communication. A. Site-specific implementation The “site-specific” implementation of the TOOWiLD concept, prototyped for the simulation, assumed as its operational context the airspace, the fleet capabilities, air-ground procedures, traffic patterns and airline-centric arrival flow management that are being developed by the M&S group. Therefore, for the simulation it was assumed that UPS as the dominant air carrier at the airport had a 100% ADSB out equipage with a majority of its aircraft (all Boeing 757 and 767) equipped for airborne merging and spacing. It was further assumed that ACARS data link messages could be sent to all UPS aircraft from a ground-based arrival management system located either at the Global Operations Center or an appropriate Air Traffic Service Facility. No data link connection between the arrival management system and non-UPS aircraft was assumed.
B. Time-based Arrival Management The arrival management system was prototyped to generate a runway schedule for all aircraft. All aircraft were planned to land on one runway (SDF-17R). The scheduled times of arrival (STA) were determined based on their estimated times of arrival (ETA) and the minimum required wake vortex spacing at the runway threshold. The ETAs were computed based on the aircraft’s flight plan routing, a charted CDA, ADS-B reported state information and an airline supplied cost index. The minimum spacing between aircraft was computed in seconds by applying the standard wake separation matrix through the simulated wind fields and adding a 5 second buffer. The resulting desired spacing intervals between aircraft were 90, 105, and 130 seconds, depending on lead/trail weight class combination. Whenever a participating aircraft reached 300 nm from the airport the arrival management system assigned (“froze”) the STA and computed a cruise/descent speed profile that would get the aircraft to the runway on time while flying the CDA. If the aircraft was equipped for airborne spacing the arrival management system would further examine whether the scheduled lead aircraft was appropriately equipped and within range to conduct airborne merging and spacing operations. During the simulations the arrival management system automatically created the schedule and data linked an “arrival message” to all participating aircraft at the 300 nm arc (see Figure 2). C. Arrival Message The arrival message was a key feature of the concept implementation. This message contained the destination airport, the scheduled runway and scheduled time at the runway, and the cruise descent speed schedule. If appropriate it also contained the lead aircraft, the assigned spacing interval and the merge point with the lead aircraft as shown in the example on the left side of Figure 3.
“SDF ARRIVAL UPS913 17R AT 17:03:20 UTC CRZ .78 DES .78/275 LEAD: UPS907 MERGE PT: CHERI SPACING: 105 SEC”
“SDF ARRIVAL UPS913 17R AT 17:03:20 UTC CRZ .78 DES .78/275
Figure 3: Example Arrival Messages. The arrival message includes various elements that can aid flight crews in setting up their on-board systems for an on-time arrival with minimum spacing. Depending on available aircraft equipage the STA at the runway could be used as a Required Time of Arrival (RTA). Alternatively in this simulation the cruise/ descent speed schedule was loaded into the Flight Management System to plan and fly an on-time CDA. If included, the spacing information lets flight crews manage airborne merging and spacing operations.
5 American Institute of Aeronautics and Astronautics
D. Flight Deck Operations Flight crews were expected to use the arrival message to plan and manage their CDA and, if applicable, merging and spacing operations. Figure 4 shows the CDAs used for this study, which were initially drafted at NASA Langley Research Center 21. Flight crews could expect to merge behind a lead aircraft at any one of the various high and low altitude merge points. Upon loading the spacing information into their on-board automation flight crews were expected to identify the lead aircraft and decide whether and when to engage spacing. For a successful merge the lead aircraft had to fly direct to the merge point. Even though the software logic included a heading check for the lead aircraft, pilots still had to consider the geometry in assessing whether to engage/disengage the algorithm. When engaging or disengaging spacing, and upon sector check-in, pilots informed the controllers about their spacing status. E. Air Traffic Control Operations Air traffic controllers in this simulation had the same responsibilities as they have today. They were responsible for ensuring safe separation between all aircraft and workload permitting, for expediting the flow of traffic and provide additional services. Nevertheless the controllers’ role was different with regard to managing arrivals. While they were expected to actively control the non-participating arrivals they were encouraged to let participating arrivals (i.e. all UPS arrivals) manage their own speeds, provide CDA clearances whenever possible, and intervene only if necessary for separation. Non-participating aircraft, dense crossing traffic, and transitioning traffic were expected to be major challenges for the controllers.
CDA chart
Pilot Notes 1. KSDF ATIS indicates when CDA procedures are in effect for B757/767 arrivals. 2. Load CDA 17R with filed transitions and ILS approach. Close any discontinuities between the arrival and the ILS final approach. 3. Verify speed/altitudes constraints in FMS match Cheri CDA arrival chart. 4. Verify FMS cruise/descent speed based on the GOC arrival uplink message. 5. MCP altitude should be set based on ATC assigned altitude. To maintain a constant descent during arrival request lower altitude well in advance of any Top Of Descent. 6. Enter any ATC speed or route changes in the FMS and use power or speed brakes to reacquire VNAV path. Flight level change or vertical speed should not be required. 7. For best VNAV path performance enter spacing algorithms speed into FMS prior to descent. 8. ARM approach after receiving ATC clearance for the ILS approach. NOTE: The altitude constraints at individual waypoints are not ATC restrictions – they are point to initiate the speed slowdowns.
8
1/27/2007
Figure 4: Continuous Descent Approach (CDA) used during simulation 6 American Institute of Aeronautics and Astronautics
Figure 5: Sector map of test airspace Four air traffic control sectors covering the most challenging portions of the eastbound arrivals into Louisville were selected as test sectors and adapted for the simulation needs as shown in Figure 5. A Kansas-City Center high altitude sector labeled ‘ZKC-50’ managed mostly crossing traffic/high altitude merges and initiated the descent for most Louisville arrivals. The Indianapolis Center sector labeled ‘ZID-91’ managed potential merges at PXV, the transition of SDF arrivals from high altitude to FL 240, as well as departures, arrivals, and crossing traffic from other airports. The low altitude sector ‘ZID-17’ cleared SDF arrivals along the CDA into the TRACON, and acted as the gatekeeper for the TRACON corner post CHERI. In addition the low altitude controller managed regional traffic including slow flying internal departures and arrivals in the area. The Louisville TRACON was combined as one sector with the controller working feeder and final simultaneously. Confederate “ghost” controllers staffed the positions surrounding the test airspace to direct aircraft in and out of the test sectors.
IV. Experimental Design The experiment was designed according to the 2x3 test matrix in Table 1 resulting in a total of six conditions that were each run twice with similar traffic scenarios. Therefore, twelve data collection runs were conducted, each approx. 75 minutes long. The sequence of runs is also shown in Table 1. Air Ground
Arr. Mgt. Sys. + ATC Tools + Data link
Table 1 : Test Matrix FMS/CDA +Airborne Spacing 3, 12 5, 8 1, 10
6, 9 2, 11 4, 7
A. Airborne Spacing The availability of airborne spacing for 70 % of aircraft including all pilot participants was one independent variable in the simulation used during half of the data collection runs. The implemented spacing algorithm was based on the Eurocontrol CoSpace logic22. The logic was configured to allow speed increases and decreases in 5 knot increments. In the current day flight deck condition all participating aircraft were assumed to have flight management system capabilities and integrated data link communication. The data link, however could only be exercised in the data link ground condition. Figure 6 show the flight deck interface for engaging and monitoring airborne spacing operations. Spacing information could be loaded automatically from a data link message or manually into the spacing setup panel. Once engaged the algorithm started processing the data to compute the speed commands. The speed commands could be sent directly to the flight control system or manually implemented by the flight crew. The primary mode during the study was the automated mode. 7 American Institute of Aeronautics and Astronautics
B.
Behind In
Ahead
Figure 6: Flight deck interface to engage airborne spacing. An example desktop pilot station is shown on the bottom of the page. The CDTI is located on the right display. The data link interface and spacing panel are located together with the primary flight displays, the FMS and the Mode control panel on the left display. 8 American Institute of Aeronautics and Astronautics
ATC Tools and Data Link The second independent variable was the availability of advanced ATC automation on the controller position and whether this automation was integrated with controller pilot data link communication.
Figure 7: Current day Center controller display for test sector used for Arr. Mgt. Sys. Condition In all ground-side conditions the Arrival Management System was operating automatically in the background
Figure 8: Center controller display used for “+ATC-tools” condition (left) and “+Data Link” condition (right) 9 American Institute of Aeronautics and Astronautics
without operator inputs. In the condition labeled “Arr. Mgt. Sys.” controllers were presented with an accurate emulation of their current day displays with no additional tools or information about spacing or scheduling status of aircraft. In the condition labeled “+ATC-Tools” controllers had access to a Louisville runway timeline display, speed advisories, a medium term conflict probe, a fast trial planning function and spacing status information in the data tag and on the display. The scheduling and spacing information was shared between the arrival management system and the air traffic controller display. This means that controllers had access to the scheduled time of arrival, assigned lead aircraft and spacing interval as determined by the automation. The ATC condition labeled “+Data Link” provided controllers with access to the same toolset as the ATC Tools condition, but enabled issuing trial planned route and altitude changes to equipped aircraft via CPDLC as well as automated transfer of communication. Data link also provided Center controllers with an easy way of sending the automatically generated schedule-based speed advisories to equipped arrivals. The tools and data link integration are described in detail in [19]. Figures 7 and 8 show examples of the controller displays used for the different conditions. New functions like spacing tools and data link are integrated in line with the general display concept. In nominal situations the displays for the different conditions look very similar and new functions can easily be learned. C. Participants Four radar certified air traffic control specialists from three Air Route Traffic Control Centers and one Terminal facility in the United States participated in the study, as well as eight airline pilots, three of whom were active UPS pilots. Recently retired controllers operated the ghost controller positions and general aviation pilots served as multi aircraft pilots. Figure 9 shows examples of the workstations for study participants and support personal.
Figure 9: Laboratory Views: ATC operations and multi aircraft control in the Airspace Operations Laboratory and Single pilot flight simulators in the Flight Deck Display Research Lab (FDDRL) D. Traffic flows The traffic flows were an extended nighttime eastbound arrival push through busy daytime crossing traffic generated from a live traffic feed in the same airspace. The two traffic scenarios used in each of the conditions caused slightly different traffic loads in the test sectors. Figure 10 show the number of aircraft “owned” by each test controller over time for two runs that are representative of the two scenarios. .
10 American Institute of Aeronautics and Astronautics
Scenario 1 (Run3) 22 20 18 16
# of aircraft
14 12 10 8 6 4 2 0 0
500
1000
1500
2000
2500
3000
3500
4000
4500
5000
elapsed time
ZKC-50
.
ZID-91
ZID-17
SDF-262
Scenario 2 (Run 6) 22 20 18 16
# of aircraft
14 12 10 8 6 4 2 0 0
500
1000
1500
2000
2500
3000
3500
4000
4500
5000
elapsed time
ZKC-50
ZID-91
ZID-17
SDF-262
Figure 10: Traffic loads for the two scenarios Scenario 1 has several peak traffic loads of 20 or more aircraft for the two high altitude sectors ZKC-50 and ZID-17. Scenario 2 on the other hand has a very steady traffic load of 12 – 14 for the high altitude sectors. The low altitude sector (ZID-17) has a generally low traffic load, but some complexities built in. The approach controller in SDF-262 gets busy after 15 minutes and has 8 to 12 aircraft under his/her control until the scenario winds down.
11 American Institute of Aeronautics and Astronautics
V. Results The results in this section are divided into general results related to the general effectiveness of the arrival management concept, the impact of airborne spacing on the arrival flow and the impact of the ATC tools and data link on the system performance. A. Controller Workload At the onset of the study it was expected based on some prior research that either airborne spacing or the availability of controller tools would have some impact on controller workload. Workload was measured during the runs with integrated workload assessment keypads that lit up every 5 minutes and prompted controllers to assess their workload on a scale of 1 (very low) to 7 (very high). Analysis of the data for all four test sectors showed no significant differences between conditions. The introduction of controller tools or data link for a subset of aircraft had no obvious impact on controller workload as well as the use of airborne spacing. Instead the workload curves follow primarily the number of aircraft that the controller owns in the sector, which is consistent with earlier research Figure 11 depicts the average workload of the four test sectors under different ATC conditions. Figure 12 shows the average workload of the test sectors for runs with and without airborne spacing. Each point along the x-axis reflects the measurements taken at the respective 5 minute interval. So the plots show self-assessed workload over runtime averaged over the different runs for the conditions in question . Average Workload by ground tools ZID91
Average Workload by ground tools ZKC50 7
7
6
6
5
5
4
4
3
3
2
2
1
1 0
0 1
2
3
4
5
No ATC Tools
6
7
8
9
10
11
ATC Scheduling Tools
12
13
14
15
16
1
17
2
3
7
6
6
5
5
4
4
3
3
2
2
1
1
0 3
4
5
No ATC Tools
6
7
8
9
10
ATC Scheduling Tools
11
12
13
6
7
8
9
10
ATC Scheduling Tools
11
12
13
14
15
16
17
ATC Scheduling + Data link
Average Workload by ground tools SDF262
7
2
5
No ATC Tools
ATC Scheduling + Data link
Average Workload by ground tools ZID17
1
4
14
15
16
ATC Scheduling + Data link
17
0 1
2
3
4
5
No ATC Tools
6
7
8
9
10
ATC Scheduling Tools
Figure 11: Average controller workload by ATC condition
12 American Institute of Aeronautics and Astronautics
11
12
13
14
15
16
ATC Scheduling + Data link
17
Average workload ZKC50
Average Workload SDF262
7
7
6
6
5
5
4
4 3
3 2
2 1
1
0 1
2
3
4
5
6
7
8
9
10
11
12
13
14
15
16
17
0
Workload No Spacing
1
2
3
4
5
6
7
Spacing
8
9
10
No Spacing
11
12
13
14
15
16
17
Spacing
Average Workload ZID91 Average Workload SDF262 7 7
6 6
5 5
4 4
3 3
2 2
1 1
0 1
2
3
4
5
6
7
8
9
No Spacing
10
11
12
13
14
15
16
17
0 1
2
3
4
5
6
Spacing
7
8
9
No Spacing
10
11
12
13
14
15
16
17
Spacing
Figure 12: Average controller workload by flight deck condition
B. Safety To estimate the safety of the operations, occurrences of separation violations for all conditions in the Center airspace were analyzed. The safety analysis during approach is mostly reflected in the subsequent discussion of inter-arrival spacing at the runway due to the added complexities of minimum separation rules in approach airspace. Table 2 Separation violations by condition. The 1st value refers to violations lasting for at least 12 seconds (RADAR sweep), the 2nd value to violations of less than 12 seconds. Air Ground Arr. Mgt. Sys. +ATC Tools +Data link Total
FMS CDA 1(1) 0 (1) 0 (1) 1 (3)
+Airborne Spacing 0 (3) 1 (2) 0 (1) 1 (6)
Total 1 (4) 1 (3) 0 (2)
It should be noted that only one separation violation involved a Louisville arrival. The majority of separation violations lasted for less than 12 seconds and might not have been registered by current day RADAR-based systems. However, since the simulation’s data collection system receives 1 second track updates, these were logged similar to what would be expected if ADS-B data was used in ground systems. Overall safety did not seem to be significantly impacted by either spacing operations or ground side conditions.
13 American Institute of Aeronautics and Astronautics
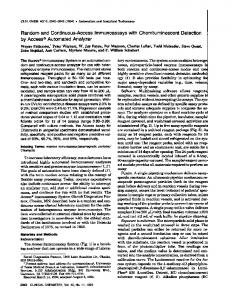
C. Effects of airborne spacing To analyze the effect of airborne spacing in more detail only the participating aircraft that conducted airborne spacing in the airborne spacing condition were analyzed. Each of them was compared to their counterpart in the conditions without airborne spacing. Since the goal of airborne spacing is to achieve spacing relative to the lead aircraft, the actual spacing intervals at the runway were compared to the required spacing intervals derived from the wake vortex matrix as described earlier in this paper. Figure 13 shows a histogram depicting the difference between the actual spacing and the required spacing for those aircraft that were actively spacing in the spacing conditions and scheduled at their minimum spacing intervals. Also shown is a histogram for those same aircraft during conditions without airborne spacing. The comparison shows a significant difference in mean and variance for those two conditions (t (70) = 3.95, p < 0.001, F (70,70) = 8.38, p < 0.001).
50 45
Number of Aircraft in Bin
40 35 30 25 20 15 10 5 0 -35
-25
-15
-5
5
15
25
35
Actual Spacing - Required Spacing Bins Not Spacing Figure 13: Spacing error atSpacing the runway.
Table 3: Inter-arrival spacing error of participating aircraft FMS CDA Spacing error (seconds)
6.3 (15.6)
+Airborne Spacing -1.5 (5.4)
These results are consistent with other findings from related airborne spacing research. Airborne spacing can reduce the spacing variability and excess spacing on final by a small, but significant margin, enabling one or two more aircraft to land per hour. In this study the arrival management system already did a very good job in scheduling and spacing the aircraft. D. Arrival Time Errors The arrival management concept using an automated system to send information to participating aircraft proved very effective in all conditions. This is demonstrated in the small arrival time errors for participating aircraft 14 American Institute of Aeronautics and Astronautics
in all conditions. The arrival time error is defined as the difference between the actual time of arrival (ATA) at the runway scheduling point and the STA. Early arrivals have a negative sign. Since it was expected that participating and non-participating aircraft would cause different results, the analysis is split between those categories. The 80% UPS vs. 20 % non-UPS arrival design resulted in sample sizes of 40 participating aircraft per condition and 10 nonparticipating aircraft per condition. Table 4 shows that on average all participating aircraft arrived in all conditions at their scheduled time with a mean error between -7.8 and +13 seconds and a standard deviation ranging from 11.1 to 53 seconds. A two-tailed pair-wise t-test reveals that the mean reduction from the FMS/CDA to. the FMS/CDA with airborne spacing condition was marginally significant (t (124) = 1.8; p < 0.07). Since airborne spacing controls the relative time behind the lead aircraft and not the absolute time a trailing aircraft relies on its lead to meet the scheduled time. During the simulation typically all airborne spacing aircraft within a chain arrived a few seconds early or a few seconds late. This explains the same overall variance as the non-airborne spacing aircraft for the absolute arrival time error, while mean and variance for the relative spacing error were significantly reduced.
Table 4: Arrival time error of participating (all UPS) aircraft (Mean and standard deviation in seconds). Air Ground Arr. Mgt. Sys. +ATC Tools +Data link Total
FMS CDA
+Airborne Spacing
Total
-2.2 (30 .4)
3.3 (53.0)
0.5 (43.0)
4.1 (15.6)
-7.8 (11.1)
-1.8 (14.7)
13.0 (37.4)
-0.02 (24.7)
6.5 (32.1)
5.0 (29.8)
-1.56 (34.7)
Examining the ground tools conditions, a variance analysis shows that ATC tools reduce the arrival time variability significantly over the current day condition even for participating aircraft (F(83,81) = 8.53, p