University of Turku and Turku Centre for Computer Science (TUCS). Informaatioteknologian ..... 4.2 Materials. All course material was distributed via the course.
Proc. 12th Australasian Computing Education Conference (ACE 2010), Brisbane, Australia
Effects of Course-Long Use of a Program Visualization Tool Erkki Kaila, Teemu Rajala, Mikko-Jussi Laakso, Tapio Salakoski University of Turku and Turku Centre for Computer Science (TUCS) Informaatioteknologian laitos, 20014 Turun yliopisto, Finland {ertaka, temira, milaak, sala}@utu.fi
Abstract We studied the course-long use of a program visualization tool called ViLLE in high school in Finland. The study was conducted in three consecutive instances of the first programming course. In the first two instances of the course, the students did not utilize ViLLE – except for a short session – while in the last instance students did ViLLE exercises throughout the whole course. The students who used ViLLE got significantly better results from the course’s final exam. This supports our hypothesis that program visualization can be an effective method in teaching programming, and indicates that we should continue developing program visualization methods to further enhance learning. Keywords: Programming education, program visualization, long-term effects of visualization, integrating visualization into a course.1
1
Introduction
The difficulties of novice programmers in introductory courses are discussed in various studies (see McCracken et al. 2001, Lister et al. 2004, Tenenberg et al. 2005). In addition to the cognitive difficulties in learning, problems often arise from lack of resources in teaching. When courses are quite large, teachers or lecturers cannot pay enough attention to single students. Moreover, the time available for introductory courses is usually quite brief, forcing the teachers to advance to more complicated topics without a possibility to ensure the level of learning. Hence, the students often lack even the basic reading and writing skills after these introductory courses. Program visualization (or program animation) is a method of illustrating the program behaviour in different states of the execution. Program visualization (PV) systems typically visualize the execution and program states (such as variable values, expression evaluation or object and function dependencies) with various graphical and textual components. Program visualization tools aim to enhance learning in two distinctive ways: firstly, a teacher can use such systems in lectures to illustrate the changes in program states during the execution of programs, and secondly, students can use tools independently to rehearse topics they found difficult. The
Copyright © 2010, Australian Computer Society, Inc. This paper appeared at the Twelfth Australasian Computing Education Conference (ACE2010), Brisbane, Australia, January 2010. Conferences in Research and Practice in Information Technology, Vol. 103. Tony Clear and John Hamer, Eds. Reproduction for academic, not-for-profit purposes permitted provided this text is included.
potential benefit of independent use is the possibility to focus on more advanced topics in the lectures, and let the students rehearse the basics on their own. However, this scenario presents a couple of issues: firstly, how to encourage the students to use the tool independently, and secondly, how to pick a tool that can be used to produce learning results?
1.1
Integrating a visualization tool into a programming course
In order to gain the possible benefits from PV tools in the course they should be properly introduced and integrated into a course. Introduction should be done with enough care. In our earlier research (Laakso et al. 2008) we found out that the students who were properly familiarized with a visualization tool beforehand gained statistically significantly better learning results than the other students. Though it is likely that the familiarization will eventually happen during the course long use, the additional cognitive load of learning to use the tool itself may frustrate the students (even more since the students at the introductory phase usually have a lot of different systems and tools they need to adapt to). Hence, the introduction should be more than a mere link at the course web site and the graphical notation of the tool should be carefully explained to the students. It is important to have a plan of what kind of role a visualization tool will have in a course. The tool can be used to replace or complement the traditional methods of teaching, however, some things that need to be considered are: What kind of topics will the tool be used for? Will it be fully integrated into all areas of teaching or used specifically to teach only some topics? What kind of “reward” will be awarded to students for using the tool? Lehtonen (2005) notes that getting in a top list of the best achievements can be enough motivation for students. Additional or alternative rewards can be, for example, extra points for the course grade or replacement of some of the course exercises with use of the tool. Though the improved learning should be a reward on itself, it often does not seem to be enough. How hard will it be for the teacher to mobilize the tool, and what kind of advantages (other than improved learning results) could be gained? Could the tool be used, for example, for the automatic assessment of exercises, what kind of statistics is available and so on?
97
CRPIT Volume 103 - Computing Education 2010
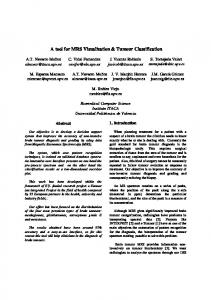
Figure 1: the visualization view in ViLLE In this article we present the results of a course long study of the program visualization tool called ViLLE. Earlier results from two-hour controlled studies on the effectiveness of ViLLE were encouraging. We consider it is important to also study the effects of the tool while used throughout programming courses.
2
Related Work
Over the years, various program visualization tools have been developed, but there are very few studies on the effectiveness of such tools, and even less on their longterm effects on learning performance. In general, algorithm and program visualization tools are studied with qualitative methods; there are very few studies where the results are based on quantitative data. Crescenzi and Nocentini (2007) describe a two-year experiment of integrating an algorithm visualization (AV) tool called ALVIE into a programming course. The course also included a textbook associated with the AV tool. They report no quantitative results, but student feedback was mainly positive. Laakso et al. (2005) report an experiment in introducing a web-based AV system called TRAKLA2 (Malmi et al. 2004) to students at two universities. They report that the tool seems to be very useful as the midterm pass rates raised significantly after the tool was introduced, and it promoted student activity in the course. The student feedback was also very positive. Carlisle et al. (2005) used a flowchart based visualization tool called RAPTOR in introductory computing courses and found out that students using the tool got better results from two questions in the final
98
exam when compared with the earlier course where the tool was not utilized. However, they also got worse results from the third question in the exam Ben-Bassat Levy et al. (2003) utilized a program visualization tool Jeliot 2000 (an earlier version of Jeliot3 (Moreno et al. 2004)) in a year-long course. They conclude that since the control group had so little room for improvement, the quantitative data only shows improvement in the animation group (the group that used the tool). Stasko (1997) studied the effects of the visualization tool called Samba, which students used in building their own visualizations. No quantitative data was presented, but student feedback indicated that students thought that they understood algorithms well. Moreover, according to an informal measure by the writer, in the final exam the students answered nearly perfectly to questions regarding the algorithms they had built earlier. Brown and Sedgewick (1984) describe the use of Balsa AV tool in an introductory course and in an algorithm and data structures course. It was found out that the students understood algorithms in less time compared with traditional teaching methods.
3
ViLLE
In this section we present the tool and describe some earlier results from the studies about ViLLE’s effectiveness.
3.1
Features
ViLLE is a program visualization tool which illustrates the changes in a program’s states with various graphical
Proc. 12th Australasian Computing Education Conference (ACE 2010), Brisbane, Australia
and textual components. The tool combines visualizations with the automatic assessment of program code reading exercises. Using ViLLE, a teacher can create example sets and include questions (multiple choice and graphical array questions in the version were used in this research) which the students answer during the execution of the example programs. As we have previously stated (Kaila et al., 2009a), mere visualizations are not enough to have a substantial effect on learning. Providing questions engages students to perform at the active level of learning. Some of ViLLE’s key features are: Possibility to visualize programs with various programming languages. Several syntaxes are included and the teacher can define new syntaxes with the built-in syntax editor. Flexible controls of animation: students can execute the program step by step or continuously in adjustable speed. Stepping backwards is also possible – a feature that is not commonly included in such tools. A built-in question editor which allows the teacher to attach questions in the chosen points in the example program. The current version includes also coding and code shuffling exercises; however, these were not in use in the version used in this research. Flexibility and ease of use both for teachers and students. Complete list of ViLLE’s features can be found at tool’s website, at http://ville.cs.utu.fi.
3.2
Motivation for developing ViLLE
Although other program visualization systems have been developed (see section 2), they seem to lack some features we found necessary for such system: The tool should have support for various programming languages instead of focusing on one particular language. Visualizations should always be combined with exercises to actively involve students. The tool should support the creation of new exercises and visualizations. The process should be as straightforward as possible to encourage teachers to develop their own materials. These features were the basis for the development of ViLLE.
3.3
Previous Studies
We have previously conducted series of experiments about the effectiveness of ViLLE in various studies. In this section we present the most significant results of those studies. The effectiveness of ViLLE was studied at University of Turku, in a course called “Introduction to information technology”. Seventy two students participated in the study, randomly divided into two groups: 32 in the treatment group and 40 in the control group. At the beginning of the session all students took a pre-test, which measured their earlier programming knowledge.
After the pre-test the students rehearsed the programming concepts with a web-based tutorial. In addition, the treatment group could visualize the examples in a ViLLE tutorial.. After this, a post-test was arranged to measure the learning effects. Both groups performed significantly better at the post-test, but no significant differences between the groups were found. However, when students’ earlier programming experience was taken into account, we found out that the difference between novices and experienced ones in the treatment group narrowed down and statistically disappeared during the session. Hence, we concluded that ViLLE is especially useful for novice programmers. The study is presented in detail in Rajala et al. (2008). Following this, the study was extended so that there were three groups, each in a different engagement level (see Naps et al. 2002). The aim of the study was to find out whether we could confirm the hypothesis, which states that visualization tools can produce learning results only if used in active levels, i.e. the mere tracking of the visualizations is not enough. In addition to the earlier research, a third group was formed. This group (the viewing group, N=62) could control the animation of program executions, but had no other ways to actively take part in them. The responding group (N=32) had a full version of ViLLE in use, with multiple choice questions about examples activated. The results showed, that the difference between experienced and the novice programmers remained in the viewing group (as well as in the tutorial-only group, i.e. the no-viewing group). This confirms the earlier findings that ViLLE is especially useful for novices, but only if used in engagement level higher than viewing. The study is presented in detail in Kaila et al. (2009a). Another study investigated whether prior experience in using a tool has an effect on learning results. The study was conducted in two instances of an introductory programming course in high school, with a session similar to the ones mentioned earlier in this section. The only difference between groups was that the (treatment group (selected randomly out of the two) was familiarized with ViLLE before the session was arranged. There were no statistically significant differences between the groups in the pre-test. However, in the post-test a statistically significant difference was found: the treatment group outperformed the control group in shared questions (i.e. the questions that were similar in pre- and post-tests) and in all questions. Based on the results we can conclude that the earlier experience of the tool has a significant effect on learning results, a fact that should be taken into account when arranging such studies. The study is presented in detail in Laakso et al. (2008). Next we arranged a study to find out if the learning effects of ViLLE can be further enhanced by using the tool in collaboration with other student. The students were randomly divided into two groups: the students in treatment group (N=62) used ViLLE in collaboration with other students, while the students in the control group (N=50) used it alone. The results confirmed our previous findings: all students’ succeeded statistically significantly better in the post-test, thus proving that it is possible to teach basic programming concepts effectively with ViLLE, even in such short time (45 minutes). While 99
CRPIT Volume 103 - Computing Education 2010
there were no differences between the groups in the pretest, a significant result was found in the post-test. This supports the earlier findings of Laakso et al. (2009), that collaboration is highly beneficial when using a visualization tool. The study is presented in detail in Rajala et al. (2009). In addition to all quantitative tests proving that ViLLE is beneficial in learning, we also wanted to find out what students think about the tool. We gathered students’ opinions at the course “Introduction to information technology” at our university. The students had used ViLLE throughout the course, with more than 10,000 exercises taken. 114 students answered the questionnaire, consisting of questions about the features, usability and usefulness of the tool. Based on the answers, most of the students think that ViLLE is beneficial when learning the basic programming concepts. Some students even thought that they learned better using ViLLE than with traditional learning methods (exercises, demonstrations and lectures). However, some students think that the best way to use such tool would be to integrate it with more traditional forms of teaching. The study is presented in detail in Kaila et al. (2009b). In this study, in contrast to our earlier studies, we wanted to examine the effects of a visualization tool when used throughout a programming course. Since the long-term effectiveness of program visualization is rarely studied, and since we have found encouraging results from two-hour sessions, we find this very relevant topic of interest.
4
Research
The effectiveness of ViLLE was studied in three consecutive high school programming courses. In the first two course students used ViLLE only in a two hour lab session at the beginning of the course. In the third course students used ViLLE throughout the course. The idea was to find out what kind of effects program visualization has on learning programming when used throughout the course.
4.1
Method
The experiment was a between subject design with a pretest and final exam results (dependant variable). We had one between-subject factor (independent variable): the amount of usage of ViLLE.
4.2
Materials
All course material was distributed via the course learning management system Moodle (Dougiamas & Taylor 2003). The material included background theory, code examples, and coding exercises for each topic taught. Python was used as the teaching language. In the third week of the courses, a computer lab session was arranged where students rehearsed programming concepts with a programming tutorial. In the tutorial some programming concepts (variables, selection, loops, and methods) were shortly explained and students solved included ViLLE exercises. At the beginning of the course, before the lab session, students were familiarized with the syntax of Python, variables, user input and selection statements. The session begun
100
with students answering a pre-test (see Appendix A), which included three questions about selection, loops and methods, and ended with a similar post-test. The results from these sessions are presented in Laakso et al. (2008). The final exam was divided into two parts (see Appendices B and C). The first part included five code reading exercises which were solved on paper. The exercises included selection statements, explaining the meaning of each line in a program, and what the program does, the number of short questions about syntactical features in Python, and explaining what certain code fragments do and writing down their output. When students returned the first part, they got three more coding exercises which were solved with computers. The coding exercises included writing a program that counts the average of an array, a program that asks a number from user and counts factorial of the number, and program that reads a file, and counts the line and word count inside the file. Each of the five questions in the first part of the exam was worth 6 points, while three coding exercises in the second part were worth 10 points each. Thus, the maximum score in the final exam was 60 points.
4.3
Participants
The participants were students from the high school of Kupittaa, a school that focuses on teaching information technology and media. There were two instances of the course in the fall 2007: in the first course there were 12 students and in the second there were 8 students, totalling 20 students in the non-ViLLE group; however, since there were two students, who took the course independently (i.e. they did not participate in lectures or other teaching, but merely took the final exam), and three students who dropped out from the course, the total number in non-ViLLE group becomes 15 (N=15). In the 2008 course the student count was 7 (the ViLLE group), because one student dropped out. The selection of the ViLLE group was randomized. The course was the first programming course in the curriculum for each student.
4.4
Procedure
All lessons in the programming courses were held in a computer lab. Each topic was first introduced by the teacher. After the introduction students solved exercises with the help of code examples and background theory. The teacher also did live-coding by explaining all his actions during the coding process to further clarify things. The courses were identical in the following aspects: Both were taught by the same teacher. All materials were identical. Final exams were identical. Hence, the only difference was that in the 2008 course students did visualization exercises with ViLLE throughout the course. When each programming concept was introduced, a number of ViLLE-exercises covering the concept were prepared for the students in the ViLLE group. The non-ViLLE group had similar program code examples included in the web material, but they could not visualize them. Hence, the time used in studying different programming topics was the same for both groups.
Proc. 12th Australasian Computing Education Conference (ACE 2010), Brisbane, Australia
The starting level of students was measured with the pre-test (see section 4.2). Student performance was measured by comparing the final exam scores between the ViLLE and non-ViLLE groups. The results between the groups were analyzed with a two-tailed t-test. Levene’s test was used to calculate variances for all statistics to determine if the data holds equal or non-equal variances.
5
Results
In this section we present the results on the research question ”is there any difference in learning when ViLLE is used throughout the course”. In addition, correlations between previous math and computer science (CS) knowledge and success in reading and writing exercises are presented.
5.1
Previous knowledge
Participants’ previous programming knowledge was determined by reviewing their earlier success in CS and math studies, and by comparing their scores in the pretest of the computer lab session. CS and math grades are presented in Table 1. The table includes averages (on the scale of 4 to 10), standard deviations (in parentheses) and p-values of the t-test between groups. Non-ViLLE group (N=9)
ViLLE group
p-value
Math
6.56 (1.82)
7.53 (1.35), N=5
0.278
CS
7.83 (1.15)
8.54 (1.10), N=6
0.254
Table 1: Participants' Math and CS grades In math studies the grades are presented for the three first advanced math courses, and naturally for only those students who took these courses (because of this the table does not include all students). Similarly, CS studies reported in the table include two first introductory courses. The courses were the same for all the students. As seen as the table, no statistically significant differences were found between the groups. The results of the pre-test in the computer lab session were analyzed similarly (see Table 2). The ViLLE group performed better in the absolute scale (10.83 vs. 7.79 on the scale of 0 to 30), but no statistically significant differences were found (p-value 0.430). In both groups there was on student who could not participate in the pretest, but did the final exam (thus the N-values). Based on the results we can conclude that there were no significant differences between the groups’ programming knowledge before taking the course. Non-ViLLE group (N=14)
ViLLE group (N=6)
p-value
Q1
5.35 (2.53)
6.50 (3.89)
0.529
Q2
1.64 (2.50)
2.16 (3.92)
0.721
Q2
0.79 (0.80)
2.17 (3.87)
0.425
Total
7.79 (4.34)
10.83 (8.38)
0.430
Table 2: Pre-test results
5.2
Final exam scores
Learning effects on the course were measured with final exam results. The exam consisted of five code reading (Q1-Q5) and three code writing (QW1 – QW3) exercises (see section 4.2 for details). Results are presented in Table 3. Non-ViLLE group (N=15)
ViLLE (N=7)
group
p-value
Q1
3.73 (2.12)
4.43 (2.15)
0.484
Q2
3.13 (1.19)
4.14 (1.46)
0.099
Q3
2.67 (1.59)
4.07 (1.74)
0.075
Q4
4.73 (1.44)
6.00 (0.00)
0.004
Q5
1.27 (1.67)
3.00 (2.16)
0.052
Reading total
15.53 (5.58)
21.64 (6.34)
0.033
QW1
3.20 (2.24)
6.29 (3.73)
0.077
QW2
4.67 (2.92)
8.00 (2.52)
0.017
QW3
2.93 (3.17)
3.86 (4.26)
0.574
Writing total
10.80 (7.03)
18.14 (9.06)
0.050
Exam Total
26.33 (11.84)
39.79 (14.11)
0.030
Table 3: Final exam results As seen on Table 3, ViLLE group performed statistically significantly better in Q4 (t (20) = -2,301), in total of reading questions (t (20) = -2,294), total of writing questions (t (20) = -2,084) and in combined total score (t (20) = -2,339); moreover, the difference in QW2 was almost significant. Since the Q4 was a question about function calls, ViLLE’s visualization of functions seemed to be especially helpful. In absolute scale and by looking the p-values of different questions, it seems that only in Q1 and QW3 groups performed somewhat similarly. Q1 was about ifstatement, a topic already presented in the course before the lab session. That might be one reason why students got good results from a similar assignment in the pre-test (see table 2). QW3 was about reading a file, which is not possible to visualize in ViLLE, and thus the topic was taught similarly to both groups. In all other questions the trend was favouring the ViLLE group.
5.3
Correlations between math and CS grades and total scores
Finally, we wanted to examine correlations between students’ grades and the scores of reading and writing sections on the final exam. Math and CS grades had medium correlation with reading exercises (0.699, p < 0.01 and 0.557, p < 0.05, respectively) and strong correlation with writing exercises (0.781, p < 0.01 and 0.725, p < 0.01). Since the CS course grades were from introductory courses, and did not include any programming, we suggest that the grades actually depict more about students’ motivation than actual programming knowledge. The pre-test results (see section 5.1) support this.The quite low averages indicate that students’ programming skills were rather poor before taking the course. Another interesting aspect is the strong correlation between reading and writing exercise points in the final exam (0.776, p < 0.001). This seems to be in line with the 101
CRPIT Volume 103 - Computing Education 2010
findings by Lopez et al. (2008) which state that there is a strong correlation between students’ tracing and writing skills.
6
Discussion
The results show that the group that used ViLLE throughout the course got statistically significantly better results from the final exam in total scores, reading total, writing total, and in question 4 in the reading exercises. Hence, ViLLE seems to be beneficial in tracing program code. Since the question 4 was about functions, ViLLE seems the most helpful when tracing the execution between the main program and subprograms. Remarkably, all students in the ViLLE group got full points from the question. Moreover, there was a trend favoring the treatment group in absolute scale in all questions, although in Q1 and QW3 the groups performed quite similarly. Based on the results, ViLLE also seems to help in developing program writing skills. Cronbach’s alpha value 0.866 calculated for the questions in the final exam indicate high reliability. It is hard to estimate how other factors influenced the results. Although the materials in the courses were identical and the courses were taught by the same teacher, the teacher might have had more experience in teaching the course in the spring. Moreover, the group sizes were quite small, and it is impossible to isolate all the factors that influence the learning in a six-week course. One confounding factor might be the randomization of groups; although the ViLLE group was selected randomly, the courses were taught in different semesters. However, since the difference between the non-ViLLE and ViLLE groups was so substantial in total points, and all our previous studies indicate that ViLLE has a positive effect on learning, we can conclude that ViLLE is beneficial when learning basic programming skills. It seems that the biggest advantage of ViLLE is the possibility to offer lots of program code reading exercises to students. Students get direct feedback on their success from the tool. This is especially helpful in mass courses where the teacher does not have enough time to address each student individually, but also applicable in courses with fewer students; the teacher can not always help all students that need guidance, no matter how few there are. The feedback given by the tool helps students understand some concepts by themselves and the teacher is freed from having to repeatedly answer basic questions. Even if the feedback from a tool is not as good as personal feedback from the teacher, students still get useful information on the events occurring in the program. Moreover, they can retake examples as many times as they see necessary – thus, the tool can be very helpful in ensuring that all the concepts taught are sufficiently rehearsed.
7
Conclusions
We conducted a study on the effects of course-long use of a program visualization tool in a high school in Finland. The results indicate that the students who used the tool throughout the course got significantly better results on their final exam. The difference was significant in all total scores, which indicates that program visualization is a
102
highly beneficial method of teaching basic programming concepts. This confirms our earlier findings from controlled two hour sessions. Moreover, we could confirm our other earlier finding that ViLLE is especially useful when tracing the execution of function calls. In future we plan to retake a similar study at the university level, and study the effects of new features (mainly code sorting and coding exercises) of ViLLE.
8
References
Ben-Bassat Levy, R., Ben-Ari, M. and Uronen, P.A. (2003): The Jeliot 2000 program animation system. Computers & Education, 40(1): 15-21. Brown, M.H. and Sedgewick, R. (1984): Progress report: Brown university instructional computing laboratory. SIGCSE Bull. 16(1): 91-101. Carlisle, M. C., Wilson, T. A., Humphries, J. W., and Hadfield, S. M. (2005): RAPTOR: a visual programming environment for teaching algorithmic problem solving. Proc. of the 36th SIGCSE Technical Symposium on Computer Science Education (St. Louis, Missouri, USA, February 23 - 27, 2005). SIGCSE '05. ACM, New York, NY, 176-180. Crescenzi, P. and Nocentini, C. (2007): Fully integrating algorithm visualization into a cs2 course: a two-year experience. Proc. of the 12th Annual SIGCSE Conference on innovation and Technology in Computer Science Education (Dundee, Scotland, June 25 - 27, 2007). ITiCSE '07. ACM, New York, NY, 296-300. Dougiamas, M. and Taylor, P. (2003): Moodle: Using Learning Communities to Create an Open Source Course Management System. Proc. of World Conference on Educational Multimedia, Hypermedia and Telecommunications, Lassner & C. McNaught (Eds.), Chesapeake, VA: AACE, 171-178. Kaila, E., Laakso, M.-J., Rajala, T. & Salakoski, T. (2009a): Evaluation of Learner Engagement in Program Visualization. To appear in 12th IASTED International Conference on Computers and Advanced Technology in Education (CATE 2009), November 22 – 24, 2009, St. Thomas, US Virgin Islands. Kaila, E., Rajala, T., Laakso, M.-J. & Salakoski, T. (2009): Effects, Experiences and Feedback from Studies of a Program Visualization Tool. Informatics in Education, 8(1): 17-34. Kannusmäki, O., A. Moreno, N. Myller and E. Sutinen. (2004): What a Novice Wants: Students Using Program Visualization in Distance Programming Courses. Proc. of the Third Program Visualization Workshop: 126133. Laakso, M.-J., Rajala, T., Kaila, E. and Salakoski, T. (2008): The Impact of Prior Experience In Using A Visualization Tool On Learning To Program. Proceedings of CELDA 2008, Freiburg, Germany, 129-136. Laakso, M.-J., Salakoski, T., Grandell, L., Qiu, X., Korhonen, A. and Malmi, L. (2005): Multi-perspective study of novice learners adopting the visual algorithm simulation exercise system TRAKLA2. Informatics in Education, 4(1): 49-68.
Proc. 12th Australasian Computing Education Conference (ACE 2010), Brisbane, Australia
Laakso, M.-J., Myller, N. and Korhonen, A. (2009): Comparing learning performance of students using algorithm visualizations collaboratively on different engagement levels. Journal of Educational Technology & Society, 12(2): 267-282. Lehtonen, T. (2005): Javala – Addictive E-Learning of the Java Programming Language. Proc. of Kolin Kolistelut / Koli Calling – Fifth Annual Baltic Conference on Computer Science Education, Joensuu, Finland, 41-48. Lister, R., Adams, S., Fitzgerald, S., Fone, W., Hamer, J., Lindholm, M., McCartney, R., Moström, J.E., Sanders, K., Seppälä, O., Simon, B. and Thomas, L. (2004): A Multi-National Study of Reading and Tracing Skills in Novice Programmers. SIGCSE Bulletin, 36(4): 119150. Lopez, M., Whalley, J., Robbins, P. and Lister, R. (2008): Relationships between reading, tracing and writing skills in introductory programming. Proc. of the fourth international workshop on Computing education research, Sydney, Australia, 101-112. Malmi, L., Karavirta, V., Korhonen, A., Nikander, J., Seppälä, O., and Silvasti, P. (2004): Visual Algorithm Simulation Exercise System with Automatic Assessment: TRAKLA2. Informatics in Education, 3(2): 267-288. McCracken, M., Almstrum, V., Diaz, D., Guzdial, M., Hagan, D., Kolikant, Y., Laxer, C., Thomas, L., Utting, I. and Wilusz, T. (2001): A Multi-National, MultiInstitutional Study of Assessment of Programming Skills of First-year CS Students. ACM SIGCSE Bulletin, 33(4): 125-140. Moreno, A., Myller, N., Sutinen, E. and Ben-Ari, M. (2004): Visualizing Programs with Jeliot 3. Proc. of the
Working Conference on Advanced Visual Interfaces (AVI 2004), Gallipoli (Lecce), Italy. ACM Press, New York: 373-380. Naps, T.L., Rößling, G., Almstrum, V., Dann, W., Fleischer, R., Hundhausen, C., Korhonen, A., Malmi, L., McNally, M., Rodger, S. and Velásquez-Iturbide, J. Á. (2002): Exploring the Role of Visualization and Engagement in Computer Science Education. Working Group Reports from ITiCSE on Innovation and Technology in Computer Science Education, 35(2): 131-152. Petre, M. (1995): Why Looking Isn’t Always Seeing: Readership Skills and Graphical Programming. Communications of the ACM, 38(6): 33-44. Rajala, T., Laakso, M.-J., Kaila, E. and Salakoski, T. (2008): Effectiveness of Program Visualization: A Case Study with the ViLLE Tool. Journal of Information Technology Education: Innovations in Practice. 7: IIP 15-32. Rajala, T., Kaila, E., Laakso, M.-J. & Salakoski, T. (2009): Effects of Collaboration in Program Visualization. Technology Enhanced Learning Conference 2009 (TELearn 2009), Taipei, Taiwan. Stasko, J.T. (1997). Using student-built algorithm animations as learning aids. SIGCSE Bull. 29(1): 2529. Tenenberg, J., Fincher, S., Blaha, K., Bouvier, D., Chen, T.-Y., Chinn, D., Cooper, S., Eckerdal, A., Johnson, H., McCartney, R. and Monge, A. (2005): Students designing software: a multi-national, multi-institutional study. Informatics in Education, 4(1): 143-162.
103
CRPIT Volume 103 - Computing Education 2010
Appendix A: Pre-test The pre-test consisted of three assignments: in each assignment a block of program code was presented, and the students were asked to either write down the output (assignments 2 and 3) or variable values in different states of execution (assignment1).
Assignment 1:
Assignment 2:
Assignment 3:
104
Proc. 12th Australasian Computing Education Conference (ACE 2010), Brisbane, Australia
Appendix B: Final exam, part 1 f)
Q1: What are the values of variables a, b, c and d after the execution of this program?
What is the output of this program? i = 2 while i < 10: if i % 2 == 0:
a = 0
i = i + 1
b = 5
break
c = 7
print i
d = 10
i = i + 1 if c < d and a < c: a = a + b b = c - 1
Q4: a)
What does this function do? def first(nmbr1,nmbr2):
d = d - a
if nmbr1 b and d > c): a = a + 2
b)
What does this function do? def second(nmbr1,nmbr2,nmbr3):
b = b + 3
if nmbr1 < nmbr2 and nmbr1 < nmbr3:
d = d – c
return nmbr1
else:
elif nmbr2 < nmbr1 and nmbr2 < nmbr3:
a = b
return nmbr2
b = c
else:
c = d
return nmbr3
d = d * 2
Q2: Add comments to each line of the following program. Finally, explain what the whole program does. list = [0,0,0,0,0] i = 0 while i < len(list):
c)
When using the functions declared in a) and b), what is the output of this line? print second(first(3,2),first(2,2),7)
Q5: Function foo() is declared and called in program. What is the output of the program?
try: list[i] = input('Give a number: ')
Function:
i = i + 1
def foo(a, b):
except Exception:
result = 0
print 'That is not a number!'
while a < b:
result = list[0]
a = a + 1
for j in list:
print a + b
if j < result:
result = result + a
result = j
return result
print result
Program: Q3:
first = foo(2,4)
a)
What command is used to include functions square() and pow() from module math?
second = foo(5,3) if first < second: print foo(first, second)
b)
What is the value of variable a after this statement is executed: a = len(‘exam’) + (2 * len(‘answer’))?
c)
What is the output of this program?
else: print foo(second, first)
list = [‘one’,’five’,’eight’,’seven’,’ten’] print list[4] + list[1]
d)
What is the output of this program? s = {‘three’ : 3,’five’ : 5, ‘four’ : 4, ‘two’ : 2} print s[‘four’] 0 s[‘two’]
e)
What is the output of this program? i = 2 while i < 10: if i % 2 == 0: i = i + 1 continue print i i = i + 1
105
CRPIT Volume 103 - Computing Education 2010
Appendix C: Final exam, part 2 Q1: Define function average(), which gets a list as a parameter and calculates and returns the average of the values in the list. Example of usage: list = [2,3,3,4,7] print “The average is:”, average(list)
The output of the example above would be: The average is 3.8
Q2: Write a program that asks for a number and prints out the factorial of that number. Use exception handling to ensure that a number is given. Factorial of e.g. number 5 is calculated like this: 5 * 4 * 3 * 2 * 1 = 120. Example run: Give a number: 6 The factorial of number 6 is 720
Q3: Write a program that reads a file and prints out the number of rows and words in that file. For example, for a file: This is a file There is more text here And even more here
The output would be: There are 3 rows and 13 words in the file.
Create a file test.txt to test your program. The words can be calculated with split a string around spaces.
106
split()
function, which can be used to