Effects of interaural time differences in fine structure and envelope on lateral discrimination in electric hearinga)
Piotr Majdakb), Bernhard Laback Acoustics Research Institute, Austrian Academy of Sciences, Reichsratsstrasse 17, A-1010 Wien, Austria, Europe
Wolf-Dieter Baumgartner ENT-Department, Vienna University Hospital, Währinger Gürtel 18-20, A-1097 Wien, Austria
This article may be downloaded for personal use only. Any other use requires prior permission of the author and the American Institute of Physics.
a)
Portions of this work were previously presented at the 28th Midwinter Research Meeting of the Association for Research in Otolaryngology, New Orleans 2005 and at the Conference on Implantable Auditory Prostheses, Asilomar 2005
b)
Electronic mail:
[email protected]
Majdak et al. (2006), J. Acoust. Soc. Am. 120, 2190-2201 Bilateral cochlear implant (CI) listeners currently use stimulation strategies which encode interaural time differences (ITD) in the temporal envelope but which do not transmit ITD in the fine structure, due to the constant phase in the electric pulse train. To determine the utility of encoding ITD in the fine structure, ITD-based lateralization was investigated with four CI listeners and four normal hearing (NH) subjects listening to a simulation of electric stimulation. Lateralization discrimination was tested at different pulse rates for various combinations of independently controlled fine structure ITD and envelope ITD. Results for electric hearing show that the fine structure ITD had the strongest impact on lateralization at lower pulse rates, with significant effects for pulse rates up to 800 pulses per second. At higher pulse rates, lateralization discrimination depended solely on the envelope ITD. The data suggest that bilateral CI listeners benefit from transmitting fine structure ITD at lower pulse rates. However, there were strong inter-individual differences: the better performing CI listeners performed comparably to the NH listeners. PACS numbers: 43.66.Pn, 43.66.Ts, 43.66.Qp, 43.66.Mk
For personal use only
2
Majdak et al. (2006), J. Acoust. Soc. Am. 120, 2190-2201
I. INTRODUCTION An important cue for the localization of sound sources is the interaural time difference (ITD). It is well established that ITD information in unmodulated signals can only be processed up to about 1500 Hz (Zwislocki and Feldman, 1956; for reviews see Blauert, 1997, and Wightman and Kistler, 1997). At higher frequencies a slow modulation of the carrier transmits the ITD information (e.g. Bernstein, 2001). Using modulated signals, like speech, at least two different types of ITD can be defined: ITD in the envelope (ITD ENV) and ITD in the fine structure (ITD FS). Signals with equal ITD ENV and ITD FS can be considered as a special case in that the whole waveform of one channel is delayed relative to the other channel. This case is most often found in natural signals and is referred to as waveform delay (WD). Several studies have examined ITD perception in cochlear implant (CI) listeners. Lawson et al. (1998) showed that lateralization discrimination using ITD only is possible. Using a pulse rate of 480 pulses per second (pps) they obtained a just noticeable difference (JND) of 150 µs. More detailed studies were performed by van Hoesel and Clark (1997), van Hoesel et al. (2002), and van Hoesel and Tyler (2003). In general, the performance was much worse than that of normal hearing (NH) listeners and had high inter-subject variability. For unmodulated stimuli the JNDs increased for higher pulse rates and could not be determined at a pulse rate of 800 pps. However, when using low-frequency amplitude-modulated stimuli at this pulse rate JNDs were on the order of JNDs for unmodulated stimuli with carrier pulse rate equal to that of the lowfrequency modulation. Unfortunately, they did not separate the relative contribution of ITD ENV
For personal use only
3
Majdak et al. (2006), J. Acoust. Soc. Am. 120, 2190-2201 and ITD FS, which may be important for amplitude-modulated stimuli like speech. Laback et al. (2004) investigated the effects of ITD ENV manipulation (the ITD FS was random and uncontrolled) in electric hearing by presenting acoustic stimuli via unsynchronized speech processors. They showed that JNDs differed between NH subjects (19 µs) and CI listeners (259 µs and 384 µs, best JNDs for CI listener S2 and S1, respectively) and depended on the type of stimulus (lowest for click trains, highest for speech or noise bursts). Current cochlear implant systems use a variety of stimulation strategies to transmit the acoustic information, an overview of which is given in Wilson (2004). Almost all strategies were designed for monaural use and do not include any binaural synchronization: the electric stimulation is controlled by two independently running speech processors. As a result, the ITD information is coded in the envelope only. The strategies have one other aspect in common: according to the specification, they use a constant stimulation pulse rate at both ears. Due to the lack of synchronization between the two ears, the stimulation pulses have an interaural delay, which can be regarded as an ITD FS. This depends on the switch-on delay between the processors and has a random value between 0 µs and the interpulse interval (IPI). If CI listeners are sensitive to ITD FS, it will interact with other lateralization cues like ITD ENV or interaural level differences. Due to the manufacturing tolerances, the time bases deviate between the speech processors at the two ears, resulting in different IPI. Therefore, the pulse rates can not be assumed to be equal at both ears. This leads to a dynamically changing ITD FS, which varies between 0 and the IPI. The period of this “ITD beat” increases with decreasing deviation in the pulse rates. If
For personal use only
4
Majdak et al. (2006), J. Acoust. Soc. Am. 120, 2190-2201 subjects are sensitive to ITD FS, the dynamically changing ITD FS will result in a movement of the auditory image. It was shown in a recent study (Laback et al. 2005) that ITD FS contributes to lateralization discrimination for lower pulse rates. In this case, a controlled ITD FS may support the effect of ITD ENV and improve the lateralization of sound sources. Coding ITD FS information also may be advantageous for speech perception in noise (Licklider, 1948; Hirsh, 1950; Dirks and Wilson, 1969; Bronkhorst and Plomp, 1988; Hawley, et al., 1999) or speech segregation (Drennan et al., 2003; Culling et al., 2004). One study, performed with anesthetized cats, indicates that ITD FS in a low-frequency carrier may be a much stronger cue than ITD ENV in an amplitude-modulated high-frequency carrier: Smith and Delgutte (2005) showed that the neuronal tuning curves in the inferior colliculus are sharper for ITD FS in a low-frequency stimulus (tested up to 320 pps) than for ITD ENV in a high- frequency carrier (tested 1000 pps carrier and modulation frequencies up to 160 Hz). The goal of this study is to systematically investigate the effects of fine structure ITD manipulation on lateralization discrimination (LD) in electric stimulation using amplitudemodulated stimuli. It was expected that CI listeners would be sensitive to ITD FS at lower pulse rates. In addition, the same experiments were performed with normal hearing (NH) subjects using a simulation of electric stimulation to compare their performance with that of the CI listeners. The results allow the assessment of the need for the synchronization of speech processors, taking some synchronization methods into account.
For personal use only
5
Majdak et al. (2006), J. Acoust. Soc. Am. 120, 2190-2201
II. METHODS A. Subjects and Apparatus Four NH subjects participated in this study, of whom one (NH3) was female. All subjects were between the ages of 25 and 35 years old and had no indication of hearing abnormalities. Two of them were the authors of this study (NH2, NH4). Four cochlear implant (CI) listeners were tested. Three of them were implanted bilaterally with the C40+ implant system manufactured by MED-EL Corp. This system provides pulsatile, nonsimultanous biphasic current pulses on up to 12 electrodes with a minimum phase duration of 26.7 µs. One CI listener (CI2) used the C40+ in the left ear and an older implant, the C40, in his right ear. The C40 provides current pulses on up to 8 electrodes with a minimum phase duration of 40 µs. Clinical data of CI listeners can be found in Table 1. The subjects were selected from a total of seven CI listeners invited for participation in the study. These four listeners fulfilled the selection criterion, as defined by the ability to reproducibly perform left/right discrimination on the basis of waveform ITD in a pulse train with a pulse rate of 100 pps in a reasonable amount of time. A personal computer system was used to control electric and acoustic stimulation. Each implant was controlled by a Research Interface Box (RIB), manufactured at the University of Technology Innsbruck, Austria. The two RIBs were synchronized, providing an interaural accuracy of stimulation timing better than 2.5 µs. Prior to the experiment, the stimuli were verified using a pair of dummy implants (Detektorbox, MED-EL). The stimuli for acoustic stimulation were output via a 24-bit stereo A/D-D/A converter (ADDA 2402, Digital Audio
For personal use only
6
Majdak et al. (2006), J. Acoust. Soc. Am. 120, 2190-2201 Denmark) using a sampling rate of 96 kHz per channel. The analog signals were sent through a headphone amplifier (HB6, TDT) and an attenuator (PA4, TDT) and presented to the subjects via a circumaural headphone (K501, AKG). Calibration of the headphone signals was performed using a sound level meter (2260, Brüel & Kjær) connected to an artificial ear (4153, Brüel & Kjær). Subject
CI1 CI2 CI3 CI8
Aetiology
Meningitis Skull trauma Meningitis Osteogenesis imperfekta
Age at implant
Deafness duration
L
R
L
R
14 yr 54 yr 21 yr 41 yr
14 yr 48 yr 21 yr 39 yr
5.5 mo 21 yr 2 mo 3 yr
1.5 mo 25 yr 2 mo 12 yr
binaural electric stimulation experience 6 yr 4 yr 1 mo 2 mo
Table 1: Clinical data of CI listeners.
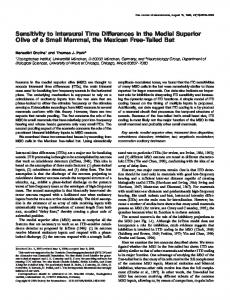
B. Stimuli The stimuli were amplitude-modulated pulse trains which were designed as pulse trains multiplied by a predefined envelope. ITD FS and ITD ENV were introduced by delaying the temporal position of the pulses and of the envelope, respectively, at one ear relative to the other ear. The following ITD conditions were specified: ITD in envelope only (ENV), ITD in fine structure only (FS), no ITD at all, which is the reference condition (REF), and the identical ITD in both the envelope and the fine structure, referred to as waveform delay (WD). The envelope consisted of 4 trapezoids with durations of 60 ms, each repeated at a period of 80 ms, resulting in 20 ms gaps between two successive trapezoids and a total stimulus duration of 300 ms (Figure 1). The trapezoid period of 80 ms yields an amplitude modulation frequency of 12.5 Hz. Since the envelope modulation is trapezoidal, the modulation spectrum contains multiples of the 12.5 Hz as well. There were several reasons for selecting a relatively For personal use only
7
Majdak et al. (2006), J. Acoust. Soc. Am. 120, 2190-2201 20ms 20ms 20ms
IPI
80ms
Figure 1: A schematic representation of the stimulus used in this study. For readability purposes the fine structure characteristics was shown in one trapezoid only. The ramps slope down to the absolute threshold of each subject. Between the trapezoids the amplitude was set to zero. In acoustic stimuli, pulses with positive amplitude are applied.
slow modulation rate. Although sensitivity to ITD increases with growing modulation frequency up to approximately 125 Hz (Henning, 1974; Bernstein, 2001) values in that range interfere with the lower limit of the pulse rates used here (100 pps). Even modulation rates as low as tens of Hertz reduce the information available in the fine structure. Furthermore, pulse trains with modulation rates on the order of 12.5 Hz more closely resemble real-world signals than pulse trains modulated with higher rates. In particular, speech has a modulation spectrum peak of approximately 5 Hz (Greenberg et al., 2003). Considering these aspects, these values of modulation frequency lead to signals providing sufficient ITD information in both the fine structure and the envelope. Finally, the rise and release time of each trapezoid was set to 20 ms. This value was chosen to emphasize the onset and the offset effects, which are assumed to enhance sensitivity to ITD ENV. The level of the first and last pulse of each trapezoid was set at the subject's absolute threshold, which was determined in pretests (see section “Pretests”). For personal use only
8
Majdak et al. (2006), J. Acoust. Soc. Am. 120, 2190-2201 Between the trapezoids, the amplitude was set to zero. The acoustic amplitudes were interpolated logarithmically and the electric currents were interpolated linearly. Both van Hoesel (2003) and Laback et al. (2005) found that subjects differed strongly in their sensitivity to ITD as a function of pulse rate. In the two studies the sensitivity was generally highest at lowest pulse rates tested, which were 50 pps and 100 pps, respectively. On the other hand, current stimulation strategies use pulse rates up to about 1600 pps (Wilson, 2004), thus, testing these pulse rates is important for real world applications. Consequently, the pulse rates to be tested must be selected individually for each subject: three to four pulse rates between 100 pps and 1600 pps, corresponding to IPI between 10 ms and 625 µs, were chosen for each subject on the basis of lateralization discrimination pretests described Sec. II D. In the case of electric stimulation, the pulse trains were composed of biphasic current pulses. Each phase of a pulse had a duration of 26.7 µs and 40 µs for the C40+ and the C40 devices, respectively. An interaurally pitch-matched electrode pair, selected in pretests (see section “Pretests”), was used for all experiments. To allow a direct comparison of the results from NH subjects with those from CI subjects, the electric stimulation was simulated in the NH subjects using a method developed by McKay and Carlyon (1999) and further successfully applied by Carlyon et al. (2002). Pulse trains were composed of monophasic pulses with a duration of 10.4 µs, corresponding to one sampling interval at a sampling rate of 96 kHz. The pulse trains were passed through a digital eighth-order Butterworth filter with a geometric center frequency of 4590 Hz and -3 dB bandwidth of 1500 Hz.
For personal use only
9
Majdak et al. (2006), J. Acoust. Soc. Am. 120, 2190-2201 Due to the filtering of amplitude-modulated pulse trains, a possible naming clash might have been introduced. In the NH literature, the “fine structure” of the acoustic stimulus refers to the carrier frequency, which is 4590 Hz in our case. Following this definition, every filtered pulse has an “envelope”, which is the envelope of the impulse response of the bandpass filter. Furthermore, the envelope of the pulse train appears as a second order envelope. The carrier frequency arises from the filtering procedure, which it is not the object of interest in this study. Thus, the definitions from the CI literature have been adopted to the acoustic signals. In reference to acoustic signals, the term “fine structure” defines the total impulse response of the bandpass filter, not the carrier only, and “envelope” refers to the slow trapezoidal amplitude modulation of the filtered pulse trains. Keeping in mind that the acoustic stimuli represent a simulation of electric stimulation, the same terms can be used to describe electric and acoustic stimulation effects. Given that the sound pressure level (SPL) depends on the pulse rate, stimulation amplitudes were adjusted to maintain a constant SPL of 59 dB, measured at the headphones, at all rates for all NH subjects. Despite the filtering of the pulse trains, some artifacts like harmonic distortions or intermodulation at the basilar membrane can cause stimulation outside the desired frequency band. To prevent these artifacts from being heard, a binaurally uncorrelated pink noise with a spectrum level of 15.2 dB SPL at 4.6 kHz was continuously played throughout the testing. Eight ITD FS values were chosen for each pulse rate, which corresponded to values from 0µs up to seven-eighths of the IPI in steps of eighth IPI. These values covered the range of ITD FS which would occur in a setup of unsynchronized speech processors and included ITDs exceeding the natural head-width delay for lower pulse rates. The investigations on effects of For personal use only
10
Majdak et al. (2006), J. Acoust. Soc. Am. 120, 2190-2201 ITD ENV were secondary in this study; thus, only two values were used. The intended values of 400 µs and 625 µs represent large ITD values with respect to the head size, and correspond to ITD ENV cues as they occur in real-world situations. Unfortunately, in the lateralization pretests the CI listeners showed no sensitivity at 400 µs and very low sensitivity at 625 µs. Thus, intending to produce as much effect as possible, larger ITD ENV values were chosen for the CI listeners: 625 µs and 800 µs.
C. Pretests In the experiments with CI users, pretests were performed to determine a binaurally loudness balanced, pitch-matched electrode pair for each listener. The pretests used pulse trains of 300 ms duration with zero ITD, 100 pps pulse rate, no amplitude modulation, and consisted of a manual up/down procedure to estimate each listener's threshold (THR), comfortable level (CL), and maximum comfortable level (MCL); a balancing procedure to iteratively determine levels of binaurally equal loudness for each electrode pair; a monaural pitch estimation procedure to reduce the number of candidates for pitch matching for both ears; and a pitch ranking procedure to determine the pitch discriminability for the pair candidates and finally select one pitch matched pair. To determine the THR, CL, and MCL for each electrode the perceived loudness was indicated by the subjects by pointing to the appropriate position on a continuous scale, ranging from “not audible” to “just uncomfortably loud”. The CL corresponded to the subject's response “comfortable”. The same procedure was then applied to determine the binaural CL, i.e., the comfortable level when both ears were stimulated simultaneously. Starting at 80% of the
For personal use only
11
Majdak et al. (2006), J. Acoust. Soc. Am. 120, 2190-2201 monaural CLs, levels were varied simultaneously in equal steps at the two ears. Subjects were instructed to attend to the overall loudness in the binaural case rather than to “hear out” a left-ear or right-ear contribution. Following the initial adjustment of the binaural CL, centralization of the perceived stimulus was checked and monaural levels were adjusted if necessary. All subjects required a reduction of current levels in the binaural condition relative to the monaural conditions to achieve the same loudness. A magnitude estimation procedure was applied to obtain an estimate of the perceived pitch across the electrodes at both ears, similar to the procedures applied by Busby et al. (1994) and Collins et al. (1997). Stimuli were presented randomly between both ears and at each of the electrodes 1-8, using the binaural CLs determined before. Subjects were instructed to assign numbers according to the perceived pitch of each stimulus. No restrictions on the range and type of numbers were given. Each stimulus was presented ten times. The distribution of pitch judgments across the electrodes and the two ears allowed selection of about 16 interaural electrode pairs supposed to elicit similar pitch sensation at the two ears. These pairs were evaluated further in the pitch-ranking task. An automated procedure was applied to obtain interaurally loudness-balanced levels for each of the electrode pairs used further in the pitch-ranking task. The members of each electrode pair were presented in two subsequent intervals. By pressing one of two buttons the subjects adjusted the relative level of the signals between the two ears in steps corresponding to the smallest amplitude changes realizable by the implants to arrive at an interaurally matched loudness. The sum of the two levels within a trial was held constant and corresponded to the sum of the binaural CLs determined for the respective electrodes. The level difference at the For personal use only
12
Majdak et al. (2006), J. Acoust. Soc. Am. 120, 2190-2201 beginning of each run was randomly roved. The mean value resulting from four runs was defined as the loudness-balanced levels for the members of the respective electrode pair. In the pitch-ranking procedure the members of each of the electrode pairs were directly compared with respect to the perceived pitch difference, using a two-interval, two-alternative forced-choice (2-AFC) procedure. The pair members were presented randomly either in the first or second observation interval. Subjects were required to indicate which of the two stimuli sounded higher in pitch while concentrating on pitch rather than on other attributes such as timbre or loudness. Electrode pairs with an average discriminability across 25 repetitions whithin the range of chance (50 ± 18%) were considered as pitch-matched. For subjects with more than one pitch-matched electrode pair, the pair at medial tonotopic position was chosen. The selected electrode pairs were (left/right): 4/1 (CI1), 2/3 (CI2), 4/3 (CI3), and 7/5 (CI8). Using the automated loudness balancing procedure described above, the levels for each pulse rate were determined with the goal of obtaining a binaurally balanced, comfortable loudness level for the selected pitch-matched electrode pair. Table 2 depicts the subjectdependent stimulation currents for each pulse rate. Pulse rate in pps 100 150 200 400 600 800 938 1600
Stimulation current left/right in uA CI1 CI2 CI3 CI8 358/1045 355/1045 478/486 362/1031 470/401 393/909 478/524 376/586 440/470 376/586 371/532 501/424 347/370 -
Table 2: Stimulation levels for each CI listener as parameter of pulse rate. “-” shows not tested pulse rates.
For personal use only
13
Majdak et al. (2006), J. Acoust. Soc. Am. 120, 2190-2201
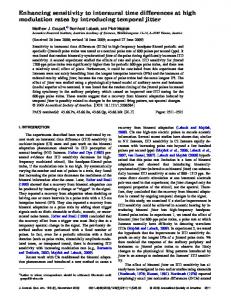
D. Procedure A two-interval, 2-AFC procedure was used in the lateralization discrimination tests. The first interval contained a reference stimulus with zero ITD, evoking a centralized auditory image. The second interval contained the target stimulus with the ITD tested. The subjects were requested to indicate whether the second stimulus was perceived to the left or to the right of the first one by pressing an appropriate button. All stimuli were repeated at least 60 times, in a balanced format with 30 targets on the left and 30 targets on the right. Thus, a subject with no ITD sensitivity could get 50 % responses correct by guessing. A score of 100 % correct responses would indicate that all stimuli were discriminated, with lateralization corresponding to the ear receiving the leading signal. In contrast, a score of 0 % implies perfect discrimination as well, but with lateralization at the ear receiving the delayed signal1. To avoid biasing the subjects towards a particular manner of responding, no feedback was given. To simplify the interpretation of the results, scores ranging from 0 % to 100 % were mapped to a range from -100 % to +100 %, referred to as “lateralization discrimination” (LD). Lateralization discrimination of 0 % means that the target could not be discriminated from the reference stimulus with respect to the lateral position and represents 50 % correct responses. Lateralization discrimination pretests were performed to select, for each listener, the pulse rates to be used in the main experiment. Discarding conditions with very low sensitivity to ITD kept the test time as short as possible. In the pretests, one ITD value of 625 µs was presented in three different ITD conditions: ENV, FS and WD. The results for each CI listener are shown in 1)
Lateralization to the “wrong” side was possible due to ambiguous ITD information in the fine structure in cases where the ITD exceeded 0.5 IPI
For personal use only
14
Majdak et al. (2006), J. Acoust. Soc. Am. 120, 2190-2201 Figure 2. Based upon these results and the availability of the subjects three to four pulse rates were chosen for each subject to be tested in main experiments (CI1: 200, 400, 1600 pps; CI2: 100, 150, 200, 400 pps; CI3: 400, 800, 1600 pps; CI8: 400, 800, 938 pps). The NH subjects were
Lateralization discrimination in %
tested at 400, 600, 800 and 938 pps.
C I1
80
ENV FS W D
C I2
60
C I3
C I8
80 60
40
40
20
20
0
0 -2 0
-2 0 100
400
800
1200
1600
100
400
800
1200
1600
100
400
800
1200
1600
100
400
800
1200
1600
Pulse Rate in pps
Figure 2: Pretest results as lateralization discrimination (LD) for different pulse rates and four CI listeners.
L a te r a liz a tio n d is c r im in a tio n ( L D ) in %
Conditions: ENV: ITD ENV=625µs; FS: ITD FS=625µs; WD: ITD FS=ITD ENV=625µs
80
C I1 , 4 0 0 p p s
C I1 , 1 6 0 0 p p s
80
60
60
40
40
20
20
0
0
-2 0
-2 0
-4 0
EN V=0µs EN V=625µs EN V=800µs
C I1 , 2 0 0 p p s
-6 0 -8 0 0
1000
2000
3000
4000
5000
0
500
1000
1500
2000
2500
0
100
200
300
400
500
-4 0 -6 0 -8 0
600
IT D F S in µ s
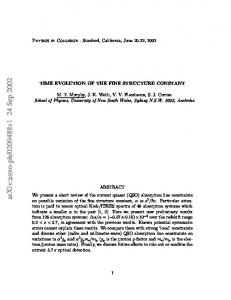
Figure 3: Lateralization discrimination for CI1 and different pulse rates. To point out the periodicity of the ITD FS the data points for the ITD FS = IPI are copies of the data points for ITD FS = 0µs. Note the different scaling of the X axes.
For personal use only
15
Majdak et al. (2006), J. Acoust. Soc. Am. 120, 2190-2201
L a t e r a l i z a t io n d i s c r i m i n a t i o n ( L D ) in %
80
C I2 , 1 0 0 p p s
C I2 , 1 5 0 p p s
80
60
60
40
40
20
20
0
0
-2 0
-2 0
-4 0
-4 0
-6 0
-6 0
-8 0
-8 0 0
2000
4000
80
6000
8000
10000
0
1500
3000
C I2 , 2 0 0 p p s
4500
6000
C I2 , 4 0 0 p p s
80
60
60
40
40
20
20
0
0
-2 0
-2 0
-4 0
-4 0
EN V=0µs EN V=625µs EN V=800µs
-6 0 -8 0 0
1000
2000
3000
4000
5000
0
500
1000
1500
2000
-6 0 -8 0 2500
I T D F S in µ s Figure 4: Lateralization discrimination for CI2 and different pulse rates. All other conventions are as in Fig. 3.
For personal use only
16
L a te r a liz a tio n d is c r im in a tio n ( L D ) in %
Majdak et al. (2006), J. Acoust. Soc. Am. 120, 2190-2201
80
80
C I3 , 8 0 0 p p s
60
60
40
40
20
20
0
0
-2 0
-2 0
-4 0 -6 0
C I3 , 4 0 0 p p s
-8 0 0
500
1000
1500
-4 0
E N V =0µs E N V =625µs E N V =800µs 2000
2500
0
250
500
C I3 , 1 6 0 0 p p s
-6 0 -8 0
750
1000
1250
0
200
400
600
IT D F S in µ s
Figure 5: Lateralization discrimination for CI3 and different pulse rates. All other conventions are as in Fig. 3.
For personal use only
17
L a te r a liz a tio n d is c r im in a tio n ( L D ) in %
Majdak et al. (2006), J. Acoust. Soc. Am. 120, 2190-2201
80
C I8 , 8 0 0 p p s
C I8 , 9 3 8 p p s
80
60
60
40
40
20
20
0
0
-2 0
-2 0
-4 0 -6 0
C I8 , 4 0 0 p p s
-8 0 0
500
1000
1500
-4 0
EN V=0µs EN V=625µs EN V=800µs 2000
2500
0
250
500
750
1000
1250
0
200
400
600
-6 0 -8 0 800
1000
IT D F S in µ s
Figure 6: Lateralization discrimination for CI8 and different pulse rates. All other conventions are as in Fig. 3.
III. RESULTS The lateralization discrimination (LD) data of the individual CI listeners are shown in Figure 3 (CI1), Figure 4 (CI2), Figure 5 (CI3) and Figure 6 (CI8). The results of the NH subjects were more homogeneous; as a result, the mean scores of all four NH listeners are provided in Figure 7. For all listeners there was a common pattern of LD as a function of ITD FS. At the lowest pulse rates (different for each subject) in the conditions ITD ENV = 0 µs, LD increased monotonically with ITD FS for ITD FS ≤ 0.25 IPI with a maximum at about 0.25 IPI. For ITD at approximately 0.5 IPI, LD was at chance (= 0 %), confirming the ambiguity in the lateralization task using ITD FS only. As ITD FS exceeded 0.5 IPI, the magnitude of LD as a function of ITD FS was similar to that for ITD FS < 0.5 IPI but with the opposite sign. This indicates that LD upon ITD FS is periodic and that stimuli with ITD FS > 0.5 IPI effectively represent stimuli with negative ITD FS. At the highest pulse rates tested (different for each subject) the dependence of LD on ITD FS disappeared. Introducing a non-zero ITD ENV resulted in a lateralization shift
For personal use only
18
Majdak et al. (2006), J. Acoust. Soc. Am. 120, 2190-2201 towards the ear receiving the stimulus with the leading envelope. This effect seems to increase
L a t e r a liz a t io n d is c r im in a t io n ( L D ) in %
with increasing pulse rate. 80
80
60
60
40
40
20
20
0
0
-2 0
-2 0
-4 0
-4 0
-6 0
N H , 400 pps
-6 0
N H , 600 pps
-8 0
-8 0 0
500
1000
1500
2000
2500
0
500
1000
1500
N H , 938 pps
80
80
60
60
40
40
20
20
0
0
-2 0
-2 0
-4 0 -6 0
E N V =0µs E N V =400µs E N V =625µs
N H , 800 pps
-8 0 0
250
500
750
1000
1250
0
200
400
600
800
-4 0 -6 0 -8 0
1000
I T D F S in µ s Figure 7: Average lateralization discrimination for all NH subjects and different pulse rates. To point out the periodicity of the ITD FS the data points for the ITD FS = IPI are copies of the data points for ITD FS = 0µs. The bars shows the standard deviation. Note the different scaling of the X axes.
Although most trends were easily distinguishable by visual inspection, a statistical analysis was used to determine the significance of the trends. The statistical method employed was multidimensional contingency table analysis (Lienert 1978; Agresti 1984, 1996) implemented in “stats” package of R (R Development Core Team, 2004). This is a useful method for intersubject comparisons of results obtained by a 2-AFC task, for which the variance analysis is not
For personal use only
19
Majdak et al. (2006), J. Acoust. Soc. Am. 120, 2190-2201 available1, although it is an unusual method in psychoacoustics. A general description of this method would exceed the scope of this paper. Thus, only a summary of the tests and models applied in the context of the data analysis is provided. The significance of the differences between two conditions was tested by obtaining the two-tailed probability p of the Pearson 2 statistic for the null hypothesis that the logarithmic odds ratios2 for both conditions are equivalent (Agresti 1984). Log-linear models were fitted to determine the interactions between different factors. The goodness-of-fit of a model to the data is described by the G², df and p-values. In these cases, the significance of an effect is given by the significance of the corresponding model parameter. In cases of fitted data, the calculation of odds ratios was done using estimated response frequencies, according to Agresti (1984, pp. 47-69). Some conditions were tested with a higher number of repetitions (> 60) due to differences in the availability of subjects. Thus, the investigations of marginal associations, collapsing3 the data over the variable tested with different number of repetitions, were done using regularization of
1)
Note that the lateralization data could not be modeled by means of JNDs since the functions are non-monotonic.
2)
The odds ratio is the ratio of the probabilities of obtaining a correct response for one condition compared to another condition. An odds ratio of 1 shows that there is no difference in the correct responses between the two conditions. The significance of the difference between the two conditions can be calculated using the logarithmic odds ratios and their corresponding confidence intervals. In multi-factorial design, logarithmic odds ratios directly correspond to the interaction terms in the log-linear models allowing investigation of interactions between factors.
3)
Agresti (1984) uses the term “to collapse” to describe the process of averaging a factor in a data pool. This process is also known as marginalization by a factor.
For personal use only
20
Majdak et al. (2006), J. Acoust. Soc. Am. 120, 2190-2201 the data to the smallest common number of repetitions (= 60). To increase the test power, pulse rate and ITD ENV were treated as ordinal factors. The statistical analysis is structured as follows: in the first section (Groups of Subjects) the differences between subjects will be analyzed and a classification will be done to show the homogeneity in the results of the CI listeners and how it compares to the results of the NH listeners. The next section (Interaural Synchronization) considers effects of interaural synchronization on lateralization discrimination and shows some improvements which can be achieved by specific coding of the ITD. In the last section (Effects of ITD ENV) the effects of ITD ENV will be analyzed in relation to the factors pulse rate and subject.
A. Groups of Subjects The pulse rate of 400 pps and ITD ENV of 0 µs and 625 µs were used for the analysis of differences between subjects, since they were the only values available for all subjects. Using these data, the odds ratios for the categorical factor subject were calculated and analyzed. The subjects were clustered according to the type of stimulation and the analysis was performed on each group separately. The results showed that the group of NH subjects was homogeneous 2 2 3=0.07, p=0.995 and the group of CI listeners was heterogeneous 3=20.0, p0.001 .
Therefore, further analyses were performed on the NH listeners as a group and for each CI listener individually. However, the better performing CI listeners (CI3 and CI8) performed sufficiently similar to the NH subjects that they could have been clustered with the NH subjects to form a larger homogeneous group 25=1.34, p=0.93 .
For personal use only
21
Majdak et al. (2006), J. Acoust. Soc. Am. 120, 2190-2201
B. Interaural synchronization To address the question of the need for interaural pulse synchronization, the dependence of LD on ITD FS was investigated. If a subject lateralizes the stimuli for ITD FS < 0.5 IPI to one side and for ITD FS > 0.5 IPI to the opposite side, that implies that LD depends on ITD FS. Therefore, the data for all conditions fulfilling ITD ENV = 0 µs were grouped as follows: the first group contained all LDs for 0 < ITD FS < 0.5 IPI and the second group all LDs for 0.5 IPI < ITD FS < IPI. Results for ITD FS = 0 and 0.5 IPI were discarded as there is no lateralization information, and they should be at chance rate. It was hypothesized that if there is a significant difference between the direction of LD for both ITD FS groups, then LD depends on ITD FS, thus indicating the necessity of interaural pulse synchronization. For the NH listeners the data pool (subject × ITD FS group × pulse rate × response) was collapsed across subjects because of the homogeneity of their performance. A log-linear model was fitted to this data pool with the result that only the saturated model1 could give an accurate fit, showing a strong interaction between the factors pulse rate and ITD FS group. Thus, the dependency on ITD FS was investigated for each pulse rate separately, analyzing the odds ratios in partial contingency tables with fixed pulse rate. For the NH subjects 600 pps was the highest pulse rate with significant sensitivity on ITD FS. For the CI listeners the data were analyzed separately for each subject in the same way as for the NH listeners: odds ratios in partial contingency tables were analyzed for each pulse rate. The better performing CI listeners (CI3, 1)
According to Agresti (1984) a saturated model contains all interactions of all factors. In this model, no factor may be averaged and the data must be analyzed for each level of each factor separately.
For personal use only
22
Majdak et al. (2006), J. Acoust. Soc. Am. 120, 2190-2201 CI8) showed significant sensitivity to ITD FS for pulse rates up to 800 pps, while for the poorer performing CI listeners (CI1, CI2) a significant sensitivity could be found only for pulse rates up to 200 pps. Detailed results of the analysis are shown in Table 3. Pulse rate in pps 100 150 200 400 600 800 938 1600
NH χ² 711.9 77.89 2.186 0.1361 -
p