11696 • The Journal of Neuroscience, September 1, 2010 • 30(35):11696 –11702
Behavioral/Systems/Cognitive
Population Coding of Interaural Time Differences in Gerbils and Barn Owls Nicholas A. Lesica,1,2 Andrea Lingner,1 and Benedikt Grothe1,2 1
Division of Neurobiology, Department Biology II, Ludwig-Maximilians-University Munich, 82152 Martinsried, Germany, and 2Bernstein Center for Computational Neuroscience, 81377 Munich, Germany
Interaural time differences (ITDs) are the primary cue for the localization of low-frequency sound sources in the azimuthal plane. For decades, it was assumed that the coding of ITDs in the mammalian brain was similar to that in the avian brain, where information is sparsely distributed across individual neurons, but recent studies have suggested otherwise. In this study, we characterized the representation of ITDs in adult male and female gerbils. First, we performed behavioral experiments to determine the acuity with which gerbils can use ITDs to localize sounds. Next, we used different decoders to infer ITDs from the activity of a population of neurons in central nucleus of the inferior colliculus. These results show that ITDs are not represented in a distributed manner, but rather in the summed activity of the entire population. To contrast these results with those from a population where the representation of ITDs is known to be sparsely distributed, we performed the same analysis on activity from the external nucleus of the inferior colliculus of adult male and female barn owls. Together, our results support the idea that, unlike the avian brain, the mammalian brain represents ITDs in the overall activity of a homogenous population of neurons within each hemisphere.
Introduction For both birds and mammals, interaural time differences (ITDs), the differences in the arrival time of sounds at the two ears, are an important cue for the localization of low-frequency sounds in the azimuthal plane. The first detailed model of how ITDs might be used to create a representation of space within the brain was presented by Jeffress (1948). The Jeffress model specifies the anatomical framework used to both create ITD sensitivity and form a representation of space. In the Jeffress model, an array of binaural coincidence detector cells tuned to different preferred ITDs via axonal “delay lines” form a topographic map of space. Because each cell is a sharply tuned filter, and the preferred ITDs span the range of ITDs that correspond to all possible azimuthal locations, the representation of space in the Jeffress model is sparse: for a single sound source, only a small subset of cells are active at any given time. In the decades since Jeffress presented his model, it has been shown to be a remarkably accurate description of the circuitry that processes ITDs in barn owls (and, subsequently, other birds); there is clear anatomical evidence for delay lines in the avian coincidence detector, the nucleus laminaris (NL), and physiological studies have revealed a topographic representation of azimuthal space in the auditory midbrain, comprised of a series of sharply tuned cells (for review, see Konishi, 2003). Received Feb. 16, 2010; revised May 13, 2010; accepted June 15, 2010. This work was supported by the Bernstein Center for Computational Neuroscience and the German Science Foundation (Deutsche Forschungsgemeinschaft; GR1205/12-1, LE2522/1-1).We thank Jose-Manuel Alonso for his expert advice on multielectrode recordings and Avinash Bala and Terry Takahashi for providing the barn owl data. Correspondence should be addressed to Nicholas A. Lesica at his current address: Ear Institute, University College London, London, WC1X 8EE, United Kingdom. E-mail:
[email protected]. DOI:10.1523/JNEUROSCI.0846-10.2010 Copyright © 2010 the authors 0270-6474/10/3011696-07$15.00/0
The representation of azimuthal space in the mammalian brain is less clear. Numerous studies have shown that cells in the mammalian brain are sensitive to ITDs, beginning in the brainstem with the binaural coincidence detector, the medial superior olive (MSO), and continuing through the midbrain, thalamus and cortex. Until recently, it was assumed that mammals also process ITDs in a manner similar to that proposed by Jeffress. However, tympanic ears (and, thus, ITD sensitivity) evolved separately in birds and mammals (Clack, 1997), and while there is some evidence for anatomical delay lines in the MSO (Smith et al., 1993; Beckius et al., 1999), they do not appear to account for the observed physiological delays (Karino et al., 2010). Furthermore, apart from an apparent weak gradient of preferred ITDs in the MSO (Yin and Chan, 1990; Oliver et al., 2003), most of the evidence suggests that there is no ITD-based space map in the ascending auditory pathway (Middlebrooks et al., 2002; Grothe, 2003; McAlpine and Grothe, 2003; King and Campbell, 2005; McAlpine, 2005; Joris and Yin, 2007). However, even if the mammalian ascending auditory pathway does not contain delay lines and/or a space map, this suggests only that the anatomical framework for processing ITDs in mammals is different from that in birds; whether the fundamental nature of the representation in mammals is different from that in birds (i.e., whether the representation is sparsely distributed across the population) remains an open question. In this study, we investigate the nature of the representation of ITDs in gerbils, a common mammalian model for the study of ITD tuning, by assessing whether cell identity is important for decoding responses, i.e., when using the responses of a population of neurons to localize a sound, is it necessary to know which spikes came from which cells, or can the responses of all cells simply be summed together? If the representation of ITDs is in
Lesica et al. • Population Coding of ITDs
J. Neurosci., September 1, 2010 • 30(35):11696 –11702 • 11697
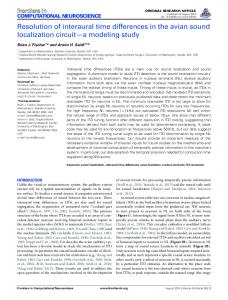
Physiological experiments Gerbils. The surgical procedures for the physiological experiments on gerbils have been described in detail previously (Lesica and Grothe, 2008). All experiments were approved according to the German Tierschutzgesetz (AZ 2112531-40/01 and AZ 211-2531-68/03). Briefly, adult gerbils were anesthetized for surgery with an initial intraperitoneal injection (0.5 ml/100 g of body weight) of a physiological NaCl solution containing ketamine (20%) and xylazine (2%). During recordings, the same solution was infused continuously at a rate of ⬃0.1 ml/h. A small metal rod was mounted on the frontal part of the skull and used to secure the head of the animal in a stereotaxic device. The animal was positioned in a soundattenuated chamber and a craniotomy was Figure 1. Performance of gerbils in a sound localization task. a, A schematic illustration of the sound localization task. 1, The gerbil made over the inferior colliculus (IC), 1.3–2.6 placed its nose in a ring and disrupted a light beam to ensure that its head was facing forward. 2, A sound was emitted from one of two mm lateral from the midline and 0 –1 mm causpeakers. 3, The gerbil went to the speaker from which the sound was emitted to collect a food reward. b, The performance of individual dal from bregma. The dura mater overlying the gerbils in the sound localization task. Each colored line shows the percentage correct at a range of speaker separation angles (and approxcortex was removed, and a multielectrode miimate difference in ITDs) for one gerbil. The inset shows the threshold speaker separation angles (and approximate difference in ITDs) for crodrive (Thomas Recording) was used to adeach gerbil, i.e., the smallest values at which each gerbil’s performance was significantly above chance level. vance 7 independently moveable tungsten microelectrodes (3–5 M⍀ arranged concentrically with an interelectrode spacing of ⬃100 fact distributed across the population, then summing together m) into the inferior colliculus (2– 4 mm below the surface). Recordings the responses of all cells will result in a population response that is were made in the low-frequency lamina of the rostrolateral quadrant of relatively invariant to changes in ITD. In contrast, if ITD is repthe IC, where inputs from the MSO are clustered (Cant and Benson, resented by the overall activity within each hemisphere, then 2006) and cells are likely to be ITD sensitive. Extracellular voltage signals summing the responses from all cells within a given hemisphere were amplified and fed into a computer via an A/D converter (RX5, should result in little or no loss of information. To provide a Tucker Davis Technologies). Voltage signals were analyzed using an ofcontext in which to evaluate the results of our analysis of gerbil fline program MClust (Fraley and Raftery, 2002) to isolate action potenresponses, we also perform a similar analysis on population retials from single units. Only those units with an “isolation distance” ⬎10 were included in this study (Schmitzer-Torbert et al., 2005). Isolation sponses from the barn owl, which is known to represent ITDs in distance assumes that the cluster of action potentials forms a multidia distributed manner. mensional Gaussian in feature space and measures, in terms of the SD of the original cluster, the size of the ellipsoid in feature space that contains Materials and Methods an equal number of action potentials and noise spikes. Our recordings Behavioral experiments yielded an average of 4.2 ⫾ 1.4 single units per recording site (of 7 possible Experiments were performed on adult Mongolian gerbils (Meriones unsingle units per site—multiple single units were never taken from a single guiculatus) in a sound-attenuated chamber in which the walls, ceiling and electrode). Experiments typically lasted ⬃12 h. At the end of each experifloor were covered with foam wedges to suppress echoes. The chamber conment, a lesion was made with the central electrode via current injection (20 tained a circular arena with a small ring in the middle. The ring contained a kHz sinusoid with peak amplitude of 10 A and duration of 90 s) to mark the light barrier for detecting the presence of the animal’s nose. Two movable recording site. All sites were verified to be in the central nucleus of the IC. arms were mounted on the outer rail of the arena. Each arm contained a Recording sites from two representative animals are shown in supplemental loudspeaker (Aurasound, NSW1-205-8A), a custom-made foot-switch, and Figure 1 (available at www.jneurosci.org as supplemental material). a feeder to deliver food pellets. Sounds were generated with a 48 kHz sampling rate by TDT System III The animals were trained to lateralize sounds in a two-alternative hardware (Tucker Davis Technologies). Digitally generated sounds were forced-choice (2AFC) task. A trial began when an animal inserted its nose converted to analog signals (RP2-1), attenuated (PA5), and delivered to in the ring (ensuring that its head was oriented exactly in the middle of speakers (ER2, Etymotic Research) coupled to tubes which were inserted the two speakers), triggering a sound from one of the speakers. The into the ear canals along with microphones. Speakers were calibrated to animal then went to the foot-switch attached to the correct speaker to have a flat frequency response [⫾5 dB SPL (sound pressure level)from obtain a food pellet. After 15 s without a decision, the trial was aborted. 0.1 to 10 kHz] at the beginning of each experiment. At each recording Incorrect decisions were not rewarded. The animal was only allowed to site, a sequence of sounds with various frequencies, intensities, and ITDs begin a new trial after the previous trial was either completed or aborted, were presented to characterize basic response properties. First, 100 ms with an additional waiting period of 20 s after incorrect trials. The sounds pure tones of various intensities and frequencies were presented, sepawere 125 ms bursts of low-frequency noise, with frequencies between 1 rated by 150 ms periods of silence, to determine the frequency response and 1200 Hz. The sounds were presented with a roving level of 72 ⫾ 6 dB area (FRA) (see Fig. 2a). Tones were presented binaurally with zero ITDs, per trial. The speaker separation angle was systematically decreased from and for some cells, also monaurally in the ear contralateral to the record105° to 5.5° (intermediate steps: 60°, 45°, 35°, 30°, 25°, 20°, 15°, 10°, 7°), ing site. The tones had a rise/fall time of 5 ms. Next, 8 repeated presenwith 5 trials at each angle. After 5 trials at 5.5°, the sequence was repeated. tations of a 250 ms segment of “frozen” noise at ITDs ranging from ⫺2 to The entire experimental procedure was computer controlled. Each ani2 ms were presented, separated by 500 ms periods of silence, to compute mal performed one testing session per day for at least 11 d, yielding a total noise delay functions (NDFs) (see Fig. 2b). Two sets of noise were preof at least 64 trials per speaker angle. sented, one in which the noise bursts in the two ears were identical and, To estimate the threshold separation angle (and approximate threshthus, perfectly correlated, and the other in which the noise bursts in the old ⌬ITD) for each animal, the set of points containing the mean percent ipsilateral ear were multiplied by ⫺1, so that the inputs to the two ears correct at each angle tested were fit with a sigmoid. The threshold was were perfectly anti-correlated. The noise segments were filtered to condefined as the angle at which the fit exceeded the significance level (62.5% tain only frequencies between 50 and 5000 Hz and had a rise/fall time of for p ⬍ 0.05 in a 2AFC task with 64 trials; two-tailed binomial test).
Lesica et al. • Population Coding of ITDs
11698 • J. Neurosci., September 1, 2010 • 30(35):11696 –11702
5 ms. The intensity of the noise was 50 dB. Finally the stimulus used for the main decoding analysis was presented: 40 repeated presentations of a 250 ms segment of frozen noise at 9 different ITDs ranging from ⫺135 to 135 s, separated by 500 ms periods of silence. The noise was filtered as described above and its intensity was 50 dB. Barn owls. The surgical procedures for the physiological experiments on owls have been described in detail previously and the data analyzed here have also been analyzed in previous work (Keller and Takahashi, 2000; Bala et al., 2003). Briefly, adult barn owls were anesthetized by intramuscular injections of ketamine (0.05– 0.1 ml/h; 100 mg/ml) and diazepam (0.025– 0.05 ml/h; 5 mg/ml) and given a prophylactic dosage of ampicillin (0.2 ml, i.m.; 250 mg/ml). The owl was placed into a stereotaxic device inside a sound-attenuated chamber that held its head tilted downwardly at a 45° angle. Microelectrodes were inserted into the exterior nucleus of the inferior colliculus (ICx) through a recording well on the skull. The ICx was identified on the basis of response characteristics. At the end of a recording session, the well was closed with dental cement, and the scalp was sutured and covered with a topical antibacterial cream. Typically, a recording session lasted ⬃12–15 h. A bird was typically used for four sessions with a minimum of 10 d between sessions. Sounds were presented over earphones (Sony MDR with custom-built cones that fit into the outer ear canal) after compensating for the filtering properties of the earphones in situ and filtering the signals with the individual bird’s head-related transfer functions (HRTFs) (Tucker Davis Technologies PD1). At each recording site, 20 repeated presentations of a 100 ms segment of random noise were presented at different ITDs, separated by 500 ms periods of silence. The noise was filtered to contain only frequencies between 2 and 9 kHz. The intensity of the noise was 50 dB.
Physiological data analysis
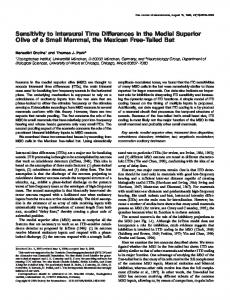
Figure 2. Basic responses properties of cells in the gerbil IC. a, The left column shows the FRAs for two typical cells in the gerbil IC measured from responses to binaural tone bursts with different frequencies and intensities and zero ITDs. The BF for each cell is indicated. The right column shows the FRAs measured from responses to tone bursts presented in the contralateral ear only. Our measure of binaural response type for each cell is indicated. b, The NDFs for the same two cells as in a. Two NDFs are shown, one for which the noise bursts in the two ears were identical and, thus, perfectly correlated (black), and the other for which the noise bursts in the ipsilateral ear were multiplied by ⫺1, so that the inputs to the two ears were perfectly anticorrelated (red). For each cell, the best ITD and our measure of ITD sensitivity type, the correlation coefficient between the two NDFs, are indicated. c, The distributions of basic response properties for our population of cells.
The significance of each cell’s ITD tuning was determined by comparing the decoder performance (see below) on the actual responses to the performance after randomly reassigning the ITD associated with each response. Decoding was performed on 100 different sets of randomized responses and the significance threshold was defined as 2 SDs above the mean percent correct for the randomized sets. The populations of cells analyzed were not restricted to any particular type of ITD tuning, i.e., any cell that exhibited significant tuning was included. For example, the population of gerbil cells contained cells that were sensitive to ITDs in both the envelope and fine structure of the sound waveform. The similarity of tuning curves for each animal was quantified by computing the correlation coefficient between pairs of tuning curves. This analysis was also performed on two sets of simulated tuning curves, one in which all tuning curves were identical, and another in which tuning curves peaks were distributed uniformly. Both sets of tuning curves were defined by spike rates at 9 ITDs evenly spaced between ⫺1 and 1 (arbitrary units). All tuning curves had a width at half max of 2.5. For the identical set, all peaks were at 1. For the other set, peaks were uniformly distributed between ⫺1.5 and 1.5 (i.e., the peaks of some tuning curves were outside the range that was analyzed, as was the case in the physiological data from barn owls). The representation of ITDs in each animal was characterized by decoding responses. Decoding was performed as follows. (1) A single response was
removed from the full set of all repeated presentations at all ITDs. (2) The Euclidean distance between the removed response and each of the remaining responses in the set was computed. (3) The removed response was assigned to the ITD for which its average distance was smallest. This process was repeated for all responses in the full set to obtain an overall percent correct. For the “distributed” decoder, each response was an n-dimensional vector defined by the spike rates of each of the n cells in the population. For the “summed” decoder, each response was a scalar defined by the sum of the spike rates of all the cells in the population. The methods used to assess the role of spike timing and noise correlations on decoder performance are described in supplemental Figures 2 and 3 (available at www.jneurosci.org as supplemental material).
Results Gerbils localize low-frequency sounds in the azimuthal plane with high acuity Before investigating the nature of the representation of ITDs by decoding responses from a particular animal, it is necessary to know the acuity with which that animal can use ITDs to localize
Lesica et al. • Population Coding of ITDs
J. Neurosci., September 1, 2010 • 30(35):11696 –11702 • 11699
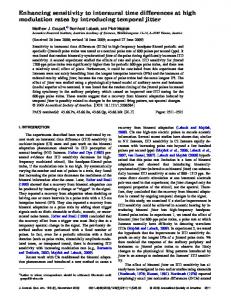
2a. From these FRAs, we extracted two values: the best frequency (BF), which is the frequency at which the cell responded to a binaural tone burst (with zero ITDs) at the lowest intensity, and a measure of binaural type for which we computed the strength of binaural responses relative to contralateral responses (binaural– contralateral)/contralateral, averaged over all frequencies and intensities). For neurons that received excitatory inputs from both ears, as was the case for both of the example cells, this value was greater than zero. The NDFs for the same two cells are shown in Figure 2b. For each cell, we recorded two NDFs, one for which the noise bursts in the two ears were identical and, thus, perfectly correlated (black), and the other for which the noise bursts in the ipsilateral ear were multiplied by ⫺1, so that Figure 3. Responses of cells in the gerbil IC to sounds with different ITDs. The top row shows raster plots of the responses of two the inputs to the two ears were perfectly cells in the gerbil IC (the same cells as in Fig. 2) to 20 repeated presentations of the same noise burst at different ITDs. Each mark on the plot represents one spike. The bottom row shows the spike rate versus ITD tuning curves for the same two cells. Circles and error anti-correlated (red). From these NDFs, we extracted two values: the best ITD, bars indicate the mean and SD of the spike rate across repeated presentations. which is the ITD that evoked the highest spike rate for the correlated noise, and a sounds, so that the decoding can be performed at an appropriate measure of ITD sensitivity type for which we computed the corresolution. Because there have been relatively few studies on the relation coefficient between the two NDFs (Joris, 2003). For neuability of gerbils to localize sounds using ITDs (Heffner and Hefrons with low BFs that were sensitive to ITDs in the fine structure fner, 1988; Maier and Klump, 2006; Maier et al., 2008), we tested of a sound, such as cell 1, the correlation coefficient between the their ability to localize sounds in the horizontal plane using a two NDFs was close to ⫺1, while for neurons with relatively high 2AFC task, the design of which is illustrated in Figure 1a. We BFs that were sensitive to ITDs in the envelope of a sound, such as trained gerbils to place their nose in a ring to disrupt a light beam cell 2, this value was close to 1. and elicit a sound from one of two speakers, which were spaced The distributions of the basic response properties for our popsymmetrically about the midline at various angles. The sounds ulation of cells are shown in Figure 2c. The distribution of BFs were low-frequency noise bursts (⬍1.2 kHz) for which ITD is the ranged from 0.25 kHz to 4.2 kHz, with a peak around 1 kHz. For only cue available for localization (Maki and Furukawa, 2005). the vast majority of cells (53/61, 87%) for which we could comThe ability of individual gerbils to correctly identify the speaker pute our measure of binaural type, the value was greater than that emitted the sound for a range of separation angles is shown zero, suggesting that they received excitatory inputs from both in Figure 1b. Individual threshold separation angles ranged from ears. The distribution of best ITDs was tightly clustered around 7° to 20°, corresponding to a difference in ITD of ⬃11–30 s, 200 ms (mean ⫽ 201 ms, SD ⫽ 37 ms) and a majority of cells with a median value of 14°, or 21 s (approximate ITDs were (78/112, 70%) had best ITDs beyond the physiological limit for derived from the head-related transfer functions in Maki and gerbils of 135 s (Maki and Furukawa, 2005). For our measure of Furukawa (2005)). These values are comparable to the threshold ITD sensitivity type, the distribution ranged from ⫺0.86 to 0.91, difference for ITD in humans (Mills, 1958). but a majority of cells (83/112, 74%) had values less than zero, indicating that they were sensitive primarily to ITDs in the fine Response properties of neurons in the gerbil structure of a sound. inferior colliculus To investigate the representation of ITDs in the gerbil auditory Decoding gerbil and barn owl population responses to a system, we made extracellular single-unit recordings from the hypothetical localization task central nucleus of the IC in anesthetized gerbils using a multielecBased on the behavioral results described above, we also recorded trode array (all recording sites were in the same hemisphere). the responses of each cell to low-frequency frozen noise bursts at Recordings were made in the low-frequency lamina of the rostro9 different ITDs, centered on an ITD ⫽ 0 s, spaced near the lateral quadrant of the IC, where inputs from the MSO are cluslocalization threshold at ⬃34 s. This stimulus was designed to tered (Cant and Benson, 2006) and cells are likely to be ITD test the ability of different decoders to use the population resensitive (see supplemental Fig. 1, available at www.jneurosci.org sponses to perform a hypothetical task: to localize a sound to 1 of as supplemental material, for representative examples of recordthe 9 possible ITDs. The responses of the same two example cells ing sites). Only those cells with significant ITD tuning (see Mato repeated presentations at different ITDs are shown in Figure terials and Methods) were analyzed (n ⫽ 112). 3a. Both cells responded reliably to features of the sound across To characterize the basic response properties of our popularepetitions, with an overall spike rate that increased with increastion of cells, we recorded responses to binaural (for all cells) and ing ITD, as summarized in the tuning curves in Figure 3b. monaural contralateral (for n ⫽ 61 cells) tone bursts with differThe tuning curves for ITDs within the limited range tested for ent frequencies and intensities, and binaural noise bursts with the decoding task are shown for a sample of individual cells in different ITDs. The FRAs for two typical cells are shown in Figure Figure 4a (colored lines; tuning curves normalized to range from
11700 • J. Neurosci., September 1, 2010 • 30(35):11696 –11702
Lesica et al. • Population Coding of ITDs
0 to 1). There was some variability in the tuning curves, but nearly all had a minimum at ⫺135 s and a maximum at 135 s, the lowest and highest ITDs tested. As a basis for comparison with the gerbil, we also analyzed responses to noise bursts at different ITDs from the exterior nucleus of the ICx in anesthetized barn owls (n ⫽ 58 with significant ITD tuning). While there are many important anatomical and physiological differences between the central nucleus of the mammalian IC and the avian ICx, the barn owl ICx responses, in which the representation of ITDs is known to be sparsely distributed across the population (Knudsen and Konishi, 1978; Bala et al., 2003), provide a clear example with which to compare the gerbil responses. The ability of barn owls to localize sounds in the azimuthal plane has been well studied (Knudsen et al., 1979; Knudsen and Konishi, 1979), and it has been shown that this ability relies almost exclusively on sensitivity to ITDs (Poganiatz et al., 2001). In contrast to the gerbil, the tuning curve maxima for the barn owl spanned the entire range of ITDs tested, as shown in Figure 4b. Figure 4, a and b, also shows the sum of the tuning curves for all cells (black). For the gerbil, the summed tuning curve spanned the full dynamic range, indicating that the tuning curves for all cells were similar, but for the barn owl, the summed tuning curve was relatively flat. To facilitate comparison with the gerbil responses, further analysis of the owl responses was performed only on those responses to nine different ITDs, centered on ITD ⫽ 0 ms, spaced near the localization threshold at ⬃5 s (Knudsen Figure 4. Tuning curves and decoder performance for cells in the gerbil IC and barn owl ICx. a, Tuning curves for ITDs within the et al., 1979; Knudsen and Konishi, 1979), limited range tested for the decoding task for cells in the gerbil IC. Each colored line shows the mean spike rate across repeated corresponding to the range denoted by presentations for one cell. Each tuning curve was normalized to have a minimum value of 0 and a maximum value of 1. For clarity, the gray band. Restricting our analysis of only 20 tuning curves are shown. The mean of all tuning curves is shown in black. All cells were recorded in the same hemisphere. the owl responses to this set of ITDs en- b, ITD tuning curves for cells in the barn owl ICx, plotted as in a. The gray band denotes the range of responses that were used for sured that the hypothetical task used for further analysis. c, Histograms of the ITD at which spike rate was maximal (the best ITD within the range of ITDs tested) for cells in decoding responses was of equivalent dif- the gerbil IC and barn owl ICx. d, The distribution of correlation coefficients between pairs of tuning curves for 4 sets of tuning curves: a set of simulated identical tuning curves, a set of simulated tuning curves with peaks uniformly distributed across a range ficulty for each animal. Before decoding the gerbil and owl re- of ITDs, the gerbil tuning curves, and the barn owl tuning curves. e, Performance of distributed and summed decoders for popusponses, we quantified the similarity in lation responses in the gerbil IC and barn owl ICx. Decoding began with a single cell (that which yielded the best performance) and an additional cell was added to each population on each iteration (that which yielded the best performance in combination with the tuning curves for each animal. First, the current population). we determined the ITD at which the spike rate was maximal (the best ITD within the 4d, the correlation coefficient was 1 for all tuning curves in the limited range tested for the decoding task). As shown in Figure 4c, identical set, while for the set in which the peaks were distributed the tuning curve peaks were clustered near the largest ITD tested uniformly, the correlation coefficients were broadly distributed. (⫹135 s) for the gerbil, but distributed relatively uniformly For the gerbil, the correlation coefficients for most pairs of tuning across all ITDs tested for the barn owl. To further examine the curves were clustered near 1, indicating that the tuning curves similarity in the tuning curves for each animal, we computed the were nearly identical, while for the barn owl, the distribution of correlation coefficient between all possible pairs of tuning curves. correlation coefficients was similar to that of the simulated popAs a basis for comparison with the experimental tuning curves, ulation in which the peaks were distributed uniformly. we created two sets of simulated tuning curves, one in which all Finally, to explicitly compare the nature of the representation tuning curves were identical (with the same peak ITD and width), of ITDs in each animal, we measured the performance of two and one in which the peaks were distributed uniformly across all ITDs (see Materials and Methods for details). As shown in Figure different decoders in localizing of a sound to 1 of 9 possible ITDs
Lesica et al. • Population Coding of ITDs
based on observation of the population responses. For a particular response (from one or more cells), the decoder computed its average Euclidean distance from the responses (across repeated presentations) evoked at each ITD, and chose the ITD corresponding to the smallest distance (see Materials and Methods for details). Before using the decoders on population responses, we determined the time scale at which decoder performance was maximal for the responses of single cells for the gerbil (see supplemental Fig. 2, available at www.jneurosci.org as supplemental material), and tested whether decoder performance was influenced by “noise correlations” between cells (i.e., correlations in the trial to trial variability of responses; see supplemental Fig. 3, available at www.jneurosci.org as supplemental material). The results of these analyses suggested that, as for the barn owl (Keller and Takahashi, 2000), information about ITD was confined to the overall spike rate (i.e., considering the timing of individual spikes did not improve decoder performance) and that noise correlations could be ignored (i.e., decoder performance for the joint responses of small groups of cells recorded simultaneously was the same before and after shuffling the order of repeated presentations). Thus, for the remainder of our analysis, we considered only spike rate and combined all cells from different recording sites into one large population. To compare the nature of the representation of ITDs in each animal, we measured the performance of two different decoders. The first decoder (distributed) retained the identity of each cell, while the second (summed) ignored cell identity and summed the responses of all cells. The performance of the two decoders is shown in Figure 4e. To examine the effect of population size, the decoding was done iteratively, with one cell added to each population (that which provided the largest improvement in performance) on each iteration. For the gerbil, the performance of both decoders saturated near the maximum value, but for the barn owl, the performance of the distributed decoder saturated near the maximum value, while the performance of the summed decoder decreased with each additional cell. This result suggests that the representation of ITDs in the gerbil brain is indeed different from that in barn owl brain: when decoding the sparsely distributed population responses in the barn owl, ignoring which cell fired which spikes results in a loss of information, but when decoding the responses from the relatively homogenous population within a single hemisphere in the gerbil, the responses of all cells can be summed together into a single channel.
Discussion Our decoding analysis explicitly shows that the representation of ITDs is not sparsely distributed across the responses of individual neurons in the central nucleus of the inferior colliculus of the gerbil. Because ignoring which cells in the population fired which spikes results in no loss of information about ITDs, we conclude that ITD is coded by the overall activity of the entire population. This result supports one side of the ongoing debate as to whether the mammalian ITD pathway is a “Jeffress-like” system or a “twochannel” system, with ITD represented by the difference in the overall activity in each hemisphere (for opposing views, see McAlpine and Grothe, 2003; Joris and Yin, 2007). The Jeffresslike nature of ITD processing in mammals has been in question for some time for several reasons. (1) The results of the anatomical studies that have looked for delay lines (Smith et al., 1993; Beckius et al., 1999) are ambiguous and recent analysis suggests that any anatomical delays that may be present cannot account for the observed physiological delays (Karino et al., 2010). (2) Apart from a possible weak topographic gradient of best ITDs in
J. Neurosci., September 1, 2010 • 30(35):11696 –11702 • 11701
the MSO (Yin and Chan, 1990; Oliver et al., 2003), there is little evidence for a topographic map of space in the ascending auditory pathway (Middlebrooks et al., 2002; Grothe, 2003; McAlpine and Grothe, 2003; King and Campbell, 2005; McAlpine, 2005; Joris and Yin, 2007). (3) Recent studies have shown that some cells in the mammalian brain have broad ITD tuning curves, with peaks outside the physiological range (McAlpine et al., 2001; Brand et al., 2002; Hancock and Delgutte, 2004; Pecka et al., 2008). (4) Theoretical work (Harper and McAlpine, 2004) has shown that a Jeffress-like system is optimal for animals that use ITDs as a spatial cue for high-frequency sounds, such as barn owls, while a two-channel system is optimal for animals that use ITDs for low-frequency sounds, such as gerbils (this theory also states that barn owls should use a two-channel system for lowfrequency sounds, suggesting that the differences between gerbils and barn owls in our results may be due to the differences in the frequency tuning of the populations studied, though recent experimental evidence indicates that barn owls use a Jeffress-like system for low frequencies as well (Wagner et al., 2007). Our results explicitly show that the representation of ITDs in gerbils is not Jeffress-like, i.e., it is not sparsely distributed across a population of cells with different preferences, and, thus, suggest that the search for anatomical features such as delay lines or space maps that are used to create or organize a Jeffress-like representation in the mammalian brain may be unnecessary. Previous studies of ITD coding in the mammalian IC have shown that the responses of single neurons can be sufficient to explain behavioral performance (Skottun et al., 2001; Shackleton et al., 2003). This result is in apparent conflict with our analysis of responses in the gerbil IC in which a population of cells is required for the decoder to reach the desired level of performance. However, upon closer inspection, both sets of results are fully consistent. The studies cited above showed that for a twoalternative task, a decoder using the responses of a single cell could distinguish a change in ITD of ⬃30 s relative to a specific reference ITD. This is true of many of the cells in our sample as well. For example, a decoder using only the responses of cell 1 in Figure 3 can be used to distinguish between noise bursts with ITDs of ⫺67 s and ⫺34 s with near perfect performance. The task used in our decoding analysis is much more difficult, a 9-alternative task for ITDs that span a relatively wide range, and for this task, a decoder using only the responses of cell 1 in Figure 3 achieves a correct performance level of only 54%. Thus, for a two-alternative task within a specific narrow range of ITDs, a single cell may be sufficient, but for a more difficult task over a wide range of ITDs, the responses of a population of cells are required.
References Bala AD, Spitzer MW, Takahashi TT (2003) Prediction of auditory spatial acuity from neural images on the owl’s auditory space map. Nature 424:771–774. Beckius GE, Batra R, Oliver DL (1999) Axons from anteroventral cochlear nucleus that terminate in medial superior olive of cat: observations related to delay lines. J Neurosci 19:3146 –3161. Brand A, Behrend O, Marquardt T, McAlpine D, Grothe B (2002) Precise inhibition is essential for microsecond interaural time difference coding. Nature 417:543–547. Cant NB, Benson CG (2006) Organization of the inferior colliculus of the gerbil (Meriones unguiculatus): differences in distribution of projections from the cochlear nuclei and the superior olivary complex. J Comp Neurol 495:511–528. Clack JA (1997) The evolution of tetrapod ears and the fossil record. Brain Behav Evol 50:198 –212.
11702 • J. Neurosci., September 1, 2010 • 30(35):11696 –11702 Fraley C, Raftery AE (2002) Model-based clustering, discriminant analysis and density estimation. J Am Stat Assoc 97:611– 631. Grothe B (2003) New roles for synaptic inhibition in sound localization. Nat Rev Neurosci 4:540 –550. Hancock KE, Delgutte B (2004) A physiologically based model of interaural time difference discrimination. J Neurosci 24:7110 –7117. Harper NS, McAlpine D (2004) Optimal neural population coding of an auditory spatial cue. Nature 430:682– 686. Heffner RS, Heffner HE (1988) Sound localization and use of binaural cues by the gerbil (Meriones unguiculatus). Behav Neurosci 102:422– 428. Jeffress LA (1948) A place theory of sound localization. J Comp Physiol Psychol 41:35–39. Joris P, Yin TC (2007) A matter of time: internal delays in binaural processing. Trends Neurosci 30:70 –78. Joris PX (2003) Interaural time sensitivity dominated by cochlea-induced envelope patterns. J Neurosci 23:6345– 6350. Karino S, Smith PH, Yin TCT, Joris PX (2010) Axonal delay lines from bushy cells to the medial superior olive: a reexamination. Assoc Res Otolaryngol Abstr p 776. Keller CH, Takahashi TT (2000) Representation of temporal features of complex sounds by the discharge patterns of neurons in the owl’s inferior colliculus. J Neurophysiol 84:2638 –2650. King AJ, Campbell RA (2005) Cortical processing of sound-source location. Acta Acustica 91:399 – 408. Knudsen EI, Konishi M (1978) A neural map of auditory space in the owl. Science 200:795–797. Knudsen EI, Konishi M (1979) Mechanisms of sound localization in the barn owl (Tyto alba). J Comp Physiol 133:13–21. Knudsen EI, Blasdel GG, Konishi M (1979) Sound localization by the barn owl (Tyto alba) measured with the search coil technique. J Comp Physiol 133:1–11. Konishi M (2003) Coding of auditory space. Annu Rev Neurosci 26:31–55. Lesica NA, Grothe B (2008) Dynamic spectrotemporal feature selectivity in the auditory midbrain. J Neurosci 28:5412–5421. Maier JK, Klump GM (2006) Resolution in azimuth sound localization in the Mongolian gerbil (Meriones unguiculatus). J Acoust Soc Am 119: 1029 –1036. Maier JK, Kindermann T, Grothe B, Klump GM (2008) Effects of omnidirectional noise-exposure during hearing onset and age on auditory spatial resolution in the Mongolian gerbil (Meriones unguiculatus)—a behavioral approach. Brain Res 1220:47–57.
Lesica et al. • Population Coding of ITDs Maki K, Furukawa S (2005) Acoustical cues for sound localization by the Mongolian gerbil, Meriones unguiculatus. J Acoust Soc Am 118:872– 886. McAlpine D (2005) Creating a sense of auditory space. J Physiol 566:21–28. McAlpine D, Grothe B (2003) Sound localization and delay lines— do mammals fit the model? Trends Neurosci 26:347–350. McAlpine D, Jiang D, Palmer AR (2001) A neural code for low-frequency sound localization in mammals. Nat Neurosci 4:396 – 401. Middlebrooks JC, Xu L, Furukawa S, Macpherson EA (2002) Cortical neurons that localize sounds. Neuroscientist 8:73– 83. Mills AW (1958) On the minimum audible angle. J Acoust Soc Am 30:237–246. Oliver DL, Beckius GE, Bishop DC, Loftus WC, Batra R (2003) Topography of interaural temporal disparity coding in projections of medial superior olive to inferior colliculus. J Neurosci 23:7438 –7449. Pecka M, Brand A, Behrend O, Grothe B (2008) Interaural time difference processing in the mammalian medial superior olive: the role of glycinergic inhibition. J Neurosci 28:6914 – 6925. Poganiatz I, Nelken I, Wagner H (2001) Sound-localization experiments with barn owls in virtual space: influence of interaural time difference on head-turning behavior. J Assoc Res Otolaryngol 2:1–21. Schmitzer-Torbert N, Jackson J, Henze D, Harris K, Redish AD (2005) Quantitative measures of cluster quality for use in extracellular recordings. Neuroscience 131:1–11. Shackleton TM, Skottun BC, Arnott RH, Palmer AR (2003) Interaural time difference discrimination thresholds for single neurons in the inferior colliculus of guinea pigs. J Neurosci 23:716 –724. Skottun BC, Shackleton TM, Arnott RH, Palmer AR (2001) The ability of inferior colliculus neurons to signal differences in interaural delay. Proc Natl Acad Sci U S A 98:14050 –14054. Smith PH, Joris PX, Yin TC (1993) Projections of physiologically characterized spherical bushy cell axons from the cochlear nucleus of the cat: evidence for delay lines to the medial superior olive. J Comp Neurol 331:245–260. Wagner H, Asadollahi A, Bremen P, Endler F, Vonderschen K, von Campenhausen M (2007) Distribution of interaural time difference in the barn owl’s inferior colliculus in the low- and high-frequency ranges. J Neurosci 27:4191– 4200. Yin TC, Chan JC (1990) Interaural time sensitivity in medial superior olive of cat. J Neurophysiol 64:465– 488.