IEEE TRANSACTIONS ON PLASMA SCIENCE, VOL. 36, NO. 3, JUNE 2008
809
Effects of Operating Frequency on Luminance Characteristics of Wide-Gap AC Plasma Display Panel Hyun Kim and Heung-Sik Tae, Senior Member, IEEE
Abstract—The three-electrode microdischarge characteristics of ac plasma display panels are analyzed with a wide-sustaindischarge gap of 180 µm. In particular, the luminance and consumed-power variations are examined as parameters of the operating frequency. It is found that the luminance per unit pulse decreases, and simultaneously, the consumed power per unit pulse increases with an increase in the operating frequency. For the wide-gap structure, the sustain voltage increases when increasing the operating frequency, thus causing the power consumption per unit pulse to be increased. However, the luminance per unit pulse decreases when increasing the sustain voltage, even though the power consumption per unit pulse increases with the sustainvoltage increase. As a result, it is observed that the self-erasing discharge between the sustain and address electrodes caused by the short pulsewidth under high frequency affects the luminance and consumed power. Due to the self-erasing discharge, the sustain voltage increases, and the discharge shrinkage phenomenon affecting the luminance characteristics occurs under high frequency that is up to 200 kHz with a wide-sustain-discharge gap of 180 µm. Index Terms—Discharge shrinkage, frequency effect, luminance, luminance per unit pulse, luminous efficiency, self-erasing discharge, wide-sustain gap (180 µm) structure.
I. I NTRODUCTION
T
HE MICRODISCHARGE cell in current ac plasma display panels (PDPs) has three electrodes, which is comprised of two sustain electrodes and one address electrode [1]–[3], where the two sustain electrodes have a coplanartype structure and are positioned perpendicular to the address electrode. As a result of the intensive research efforts in recent years, PDPs now represent a large section of the flat-paneldisplay market due to their high image quality. Nonetheless, the low luminous efficiency of a PDP remains a significant shortcoming when compared with other display devices, such as liquid crystal displays and cathode ray tubes. Thus, to improve the luminous efficiency of PDPs, recent research has been focused on the use of a wide-discharge-gap structure [4]–[8]. Because it is well known that the discharge efficiency can be considerably improved with a wider sustaining discharge gap and positive or quasi-positive column region [4], [5], wideManuscript received August 21, 2007; revised March 3, 2008. This work was supported by the BK21 project. The authors are with the School of Electrical Engineering and Computer Science, Kyungpook National University, Daegu 702-701, Korea (e-mail:
[email protected]). Color versions of one or more of the figures in this paper are available online at http://ieeexplore.ieee.org. Digital Object Identifier 10.1109/TPS.2008.922497
sustain-gap structures ranging from 400 to 700 µm have already been intensively studied [4]–[7]. However, in these structures, as the barrier rib height is fixed at about 100−130 µm, a sustain discharge cannot be directly produced between the two sustain electrodes without first producing a triggering discharge between one of the two sustain electrodes and the address electrode. Accordingly, to sustain this kind of widegap structure properly, a very high sustain voltage or the use of an auxiliary address pulse with sustain pulses is required. However, even though high luminous efficiency is obtained from the large discharge gap (over 400 µm) structure under laboratory conditions, it is hardly applicable to commercial large size PDP due to the difficulties in discharge initialization (reset) and the cost increase due to the high firing voltage of the large gap discharge and auxiliary address pulse. Furthermore, when considering the tendency of the PDP cell size to produce a high image quality, a wide-sustain-gap structure ranging from 400 to 700 µm is too wide to realize a 42-in high-definition (HD) PDP with a cell pitch of 304 × 693 µm or 50-in full HD PDP with a cell pitch of 192 × 576 µm. In this paper, the discharge characteristics of wide-gap microdischarge structure (discharge gap: 180 µm) are examined for the possible use of high efficient microdischarge cell that is suitable for the 42-in HD or 50-in full HD PDPs. The discharge characteristics of the wide-gap PDP, such as the luminance and luminous efficiency, are investigated. In particular, the discharge mode variation on the luminance characteristics is analyzed as a parameter of the operating frequency ranging from 40 to 200 kHz. II. E XPERIMENTAL S ETUP Fig. 1(a) and (b) shows (a) a plane view of a single pixel, including the red, green, and blue cells and (b) a cross-sectional view of a subpixel in a wide-gap PDP cell, as used in the experiment. The X and Y electrodes are covered by a dielectric material with a thickness of 34 µm and using a T-shape. The sustain discharge gap between the two sustain electrodes X and Y is 180 µm, whereas the height of the closed barrier rib is 125 µm. The detailed specifications of the wide-gap PDP are listed in Table I. All the sustain voltages used in this experiment are selected near the minimum sustain voltage to generate just the minimum electric-field intensity that is necessary for maintaining the discharge. Fig. 2 shows the voltage waveforms Vx , Vy , and Vz applied to the sustain electrodes X and Y and address electrode Z,
0093-3813/$25.00 © 2008 IEEE
810
IEEE TRANSACTIONS ON PLASMA SCIENCE, VOL. 36, NO. 3, JUNE 2008
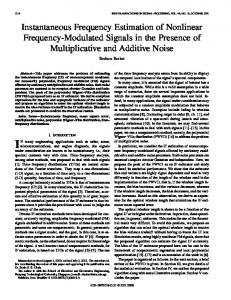
Fig. 3. Variations in luminous efficiencies measured at four different discharge gaps such as 120, 140, 160, and 180 µm at 40 kHz in a 42-in test panel with HD grade.
respectively, at a frequency of 200 kHz. The operating frequency is varied from 40 to 200 kHz with a duty ratio of 100%. The address electrode (Z) remains grounded during the sustain discharge. The luminous efficiency is defined as follows [6]: Luminous Efficiency [lm/W] Fig. 1. (a) Plane view of single pixel, including red, green, and blue cells. (b) Cross-sectional view of subpixel in wide-gap (= 180 µm) PDP.
TABLE I SPECIFICATIONS OF A 42-in WIDE-GAP (= 180 µm) PDP CELL
Fig. 2. Voltage waveforms Vx , Vy , and Vz applied to sustain electrodes X and Y and address electrode Z, respectively, at a frequency of 200 kHz.
=
π × Luminance[cd/m2 ] × Display Area[m2 ] . Consumed Power[W]
III. R ESULTS AND D ISCUSSION Fig. 3 shows the luminous efficiency measured at a sustain frequency of 40 kHz from the 42-in HD ac PDP with a discharge gap between two sustain electrodes, varying from 120 to 180 µm at intervals of 20 µm for the experiment. The luminous efficiency was maximal at a discharge gap of 180 µm. In addition, there was a previous report that the high luminous efficiency could be obtained at about a discharge gap of 180 µm [8]. In our experiment, the barrier rib height was fixed at about 125 µm. Our experimental result has shown that, in the case of the sustain discharge gap larger than the barrier rib height, the luminous efficiency can vary depending on the operating frequency, which has not been reported yet. Even though the effect of the operating frequency on the conventional short-discharge-gap case(discharge gap < barrier rib height) has been previously reported, it is not directly applicable to the wide-gap-discharge characteristics on the operating frequency [9], [10]. Fig. 4 shows the changes in the luminous efficiency, luminance, and power consumption relative to the operating frequency when applying the conventional sustain waveform, as shown in Fig. 2, to the wide-gap (= 180 µm) PDP cell for 3 ms in one TV field (= 16.67 ms). As shown in Fig. 4, the luminous efficiency decreased from 2.75 to 1.46 lm/W when increasing the operating frequency from 40 to 200 kHz. During a sustain period of 3 ms, the applied sustain pulse number was increased from 240 to 1200 with an increase in the operation frequency from 40 to 200 kHz due to the shortening of the pulsewidth (rising/falling time included), as given in Table II. Accordingly, the consumed power was increased in
KIM AND TAE: EFFECTS OF FREQUENCY ON LUMINANCE CHARACTERISTICS OF AC PLASMA DISPLAY PANEL
811
TABLE III DISCHARGE CURRENTS MEASURED PER UNIT PULSE AND VARIATIONS IN SUSTAIN VOLTAGES , DEPENDING ON OPERATION FREQUENCY
Fig. 4. Changes in luminous efficiency, luminance, and consumed power relative to operating frequency when applying conventional sustain waveform to wide-gap (= 180 µm) PDP cell for 3 ms in one TV field (= 16.67 ms). TABLE II VARIOUS SUSTAIN PULSE NUMBERS AND PULSE WIDTHS AT DIFFERENT OPERATING FREQUENCIES DURING THE SUSTAIN PERIOD OF 3 ms, WHICH ARE EMPLOYED IN THIS STUDY
unit pulse was also increased, but the luminance per unit pulse was decreased. Consequently, the luminous efficiency, i.e., luminance per unit power, was decreased with an increase in the operating frequency, as shown in Fig. 5. When the operating frequency was increased from 40 to 200 kHz, the luminance per unit pulse was decreased by about 32.8%, whereas the consumed power per unit pulse was increased by about 26.4}%. As a result, the luminance per unit power was decreased by about 47.0%. As shown in Table III, as the operating frequency was increased from 40 to 200 kHz, the corresponding sustain voltage was increased from 210 to 233 V, and the discharge current per unit pulse was also increased from 2.70 to 3.07 mA, thus resulting in the increase in the consumed power. A. Increase in Consumed Power Due to Self-Erasing Discharge at Higher Operating Frequency
Fig. 5. Changes in luminous efficiency, luminance, and consumed power per unit pulse relative to operating frequency.
proportion to the operating frequency. On the other hand, the luminance was not increased in proportion to the number of the applied sustain pulses. The resultant luminous efficiency was decreased as the operating frequency was increased, as shown in Fig. 4. The result illustrates that, for the widegap (= 180 µm) structure greater than the barrier rib height (= 125 µm), the luminous efficiency strongly depends on the operating frequency. In this case, the increase in the operating frequency means both the reduction of the applied pulsewidth and the increase in the applied pulse number during the same sustain period. Fig. 5 shows the changes in the luminance and consumed power per unit pulse with respect to the operating frequency. As the operating frequency was increased, the consumed power per
Fig. 6 shows the changes in IR emission profiles that are relative to the operating frequency, ranging from 40 to 200 kHz when applying the conventional sustain waveform to the widegap (= 180 µm) PDP cells. As shown in Fig. 6, when increasing the operating frequency from 40 to 200 kHz, the sustain voltage increased by 23 from 210 V at 40 kHz to 233 V at 200 kHz. In particular, at an operating frequency greater than 80 kHz, the IR emission waveforms in Fig. 6 indicated the production of self-erasing discharges after the applied sustain voltage fell to the ground level. The production of self-erasing discharge at higher (> 80 kHz) operating frequency for the wide-gap structure would be explained as follows. The width of the sustain pulse was shortened when increasing the operating frequency, thereby reducing the time to accumulate the wall charges that are necessary for the next sustain discharge. That is, for the wide-gap discharge, the short sustain pulse hindered the conversion of lots of priming particles within the cell into the wall charges, thereby resulting in production of the selferasing discharge, owing to the presence of lots of priming particles. The resultant wall-charge loss due to the self-erasing discharge caused an increase in the sustain voltage. During the sustain discharge, the space charges were generated, most of which were converted into wall charges within a few hundred nanoseconds. However, some of the space charge remained alive during an application of the voltage pulse [11]. In addition, there were generally more ions in the discharge space because the electron mobility was much higher than the ion mobility [12]. Thus, the remaining space charges after the discharge extinction were mostly ions. The time required for the wallcharge accumulation of over 90% was at about 4 µs [11]. In Fig. 6(c)–(e), when increasing the operating frequency from 120 to 200 kHz, the pulsewidth was shortened from 3.7 to 2.0 µs, when not including the rising and falling times. At
812
IEEE TRANSACTIONS ON PLASMA SCIENCE, VOL. 36, NO. 3, JUNE 2008
Fig. 6. Changes in IR emission profiles relative to operating frequency, ranging from 40 to 200 kHz when applying conventional sustain waveform to wide-gap (= 180 µm) PDP cell: (a) 40, (b) 80, (c) 120, (d) 160, and (e) 200 kHz.
Fig. 7. (a) Space-temporal IR emission profile during self-erasing discharge measured by ICCD. (b) Electron density profile during self-erasing discharge simulated by a 2-D simulator.
200 kHz, the pulsewidth was about 2 µs, when the rising and falling times were not included. Because this time was too short to accumulate sufficient wall charges for the wide-gap structure, large amounts of space charges, such as ions that had not been converted into wall charges, remained at the falling time of the applied sustain pulse. At the operating frequency of lower than 80 kHz, the pulsewidth was long enough to enable the wall charges to be accumulated sufficiently between the X−Y electrodes, even though the sustain discharge gap is 180 µm. On the other hand, at the operating frequency of higher than 80 kHz, the pulsewidth is too short to accumulate the wall charges sufficiently, such that the space charges remain without being converted into wall charges within the cells. Fig. 7(a) shows the space-temporal IR emission profile produced by the self-erasing discharge between the X−Z elec-
trodes, which was measured by using the image intensified charge-coupled device (ICCD) in a gate mode. In this measurement, the driving conditions in Fig. 2 were given as follows: Vx was falling from the voltage level of 233 V, Vy was rising to the voltage level of 233 V, and the widths of Vx and Vy were 2.5 µs (including the rising/falling time). The ICCD images were taken after the X sustain pulse Vx fell completely from 233 to 0 V while the Y sustain pulse Vy was simultaneously rising from 0 toward 233 V. As shown in Fig. 7(a), the selferasing discharge between the X−Z electrodes began after 120 ns. Fig.7(b) shows the electron density profile induced by the self-erasing discharge simulated by the 2-D simulator. As shown in Fig. 7, when a positive sustain voltage was applied to the X electrode, an adequate amount of the fast electrons was accumulated below the X electrode, yet an insufficient amount of the slow ions accumulated below the Y electrode, leaving lots of ions as residual space charges within the cell. Thus, the remaining space charges (mostly ions) induced a self-erasing discharge between the X−Z electrodes instead of between the X−Y electrodes at a falling time of the applied sustain pulse, because the distance between the X−Z or Y −Z electrode was shorter than that between the X−Y electrode, as shown in Fig. 7. During the self-erasing discharge, i.e., while the negative-going sustain pulse was applied to the X electrode, the X and Z electrodes worked as cathode and anode, respectively. Accordingly, some of the electrons on the upper dielectric layer covering the X electrode were discharged (or erased), whereas the lower dielectric layer covering the Z electrode was charged by the electrons. This phenomenon seems to be similar to the trigger discharge in a long gap (= 700 µm) discharge, as explained by Weber [4]. Consequently, if the space charges were fully converted into wall charges, even under the high frequency condition of widegap structure, the self-erasing discharge produced in the plate
KIM AND TAE: EFFECTS OF FREQUENCY ON LUMINANCE CHARACTERISTICS OF AC PLASMA DISPLAY PANEL
813
TABLE IV COMPARISON OF LUMINANCE PER UNIT PULSE AND LUMINOUS EFFICIENCY RELATIVE TO P ULSE N UMBER AT T WO D IFFERENT O PERATING F REQUENCIES
gap between the X−Z or Y −Z electrodes would be expected to be considerably suppressed, and the resultant sustain voltage is low enough to improve the luminous efficiency of a wide-gap PDP cell at a high operating frequency. In our experiment, the net voltage (wall voltage + applied voltage) for maintaining the discharge in high-frequency condition might not be higher than that in low-frequency condition, which does not accompany with the self-erasing discharge. However, the sustain-voltage increase due to the loss of wall charge by the self-erasing discharge means the increase in the applied voltage, which causes the consumed-power increase. The increase of the consumed power is directly related to the low luminous efficiency, as shown in Figs. 4 and 5. B. Decrease in Luminance per Unit Pulse at High Operating Frequency As mentioned in Section III-A, the decrease in the luminous efficiency with an operating frequency was caused by the luminance reduction per unit pulse plus the consumed-power increase per unit pulse. For the wide-gap structure, the sustain voltage increased when increasing the operating frequency, thus causing the power consumption per unit pulse to be increased. However, the luminance per unit pulse did not increase as much as the consumed power per unit pulse did, even though the power consumption per unit pulse increased with the sustainvoltage increase. As for the luminance characteristic, first of all, the phosphor saturation caused by an increase in the operating frequency could be considered. In general, there might be two possible reasons for the phosphor saturation originated from frequency variation. The first possible reason was the depletion of the phosphor activator due to the stronger discharge, and the second was possibly based on the depletion of the phosphor activator by a continuous application of lots of pulses [13]. Even though the sustain voltage is increased by 23 V when the frequency varies from 40 to 200 kHz (see Table III), it is hard to confirm that the discharge intensity became stronger in proportion to the operating frequency, as shown in Fig. 6. Accordingly, in this case, the luminance decrease per unit pulse with the operating frequency cannot be explained by the phosphor saturation induced by the discharge intensification with the operating frequency. Table IV shows the changes in the luminance per unit pulse relative to the applied pulse number at two different operating frequencies, which are 40 and 200 kHz. In particular, two cases were compared as follows: One case was different pulse numbers (1200 and 240 pulses) under the same operating frequency (200 kHz), and the other was different operating frequencies (200 and 40 kHz) under the same pulse number
Fig. 8. Visible emission profile measures at (a) 40 and (b) 200 kHz in widegap (180 µm) structure.
(240 pulses). In eight subfields, generally, 255 pulses are used to display the full-white image of a 42-in ac PDP. For the same operating frequency under different pulse numbers, the applied pulsewidth was the same, but the applied pulse number was different. As shown in Table IV, the luminance per unit pulse was increased by 0.14 cd/m2 when the pulse number was decreased from 1200 to 240 at the same frequency of 200 kHz. In this case, the continuous pulse application caused a loss of luminance per unit pulse due to the phosphor saturation caused by the depletion of the phosphor activator [14]. For the same pulse number under different operating frequencies, the applied pulse number was the same but the applied pulsewidth was different. In this case, the luminance and luminance per unit pulse at 200 kHz were still lower than those at 40 kHz, although the sustain voltage at 200 kHz was higher than that at 40 kHz. This result implied that the applied pulsewidth instead of the applied pulse number was a very significant factor affecting the luminance characteristics for the wide-gap (= 180 µm) structure. C. Discharge Shrinkage Phenomenon at High Operating Frequency For the analysis of this phenomenon, two kinds of visible emission profiles are introduced in Fig. 8(a) and (b), which show the visible emission profiles of the single pixels measured at 40 and 200 kHz, respectively. The intensity of the visible emission was expressed by the gray level, as shown in Fig. 8. At 40 kHz, the entire phosphor layer in the discharge cell was effectively excited. However, at 200 kHz, the visible emissions were shrunk along the address electrode (Z), as shown in
814
Fig. 9. (a) IR emission profile during main sustain discharge measured by ICCD. (b) Electron density profile during main discharge simulated by a 2-D simulator.
Fig. 8(b), so that the phosphor layers covering all the regions except the address electrode were not effectively excited by the vacuum ultraviolet. Thereby, the luminance loss phenomenon occurred with the operating frequency. Similar discharge formation was reported in the case when the discharge gap was over 200 µm in a low frequency [8]. The visible emission shrinkage on Z electrode at high frequency does not mean that the Z electrode is entirely isolated from the main discharge at low frequency. The small portion of the plate gap discharge between X(Y )–Z, causing the discharge shrinkage, could be overlapped with the surface discharge at low-frequency condition. However, the portion of the plate gap discharge is intensified at high frequency by the self-erasing discharge; thereby, the visible emission shrinkage by the discharge shrinkage occurs at high-frequency condition. The high intensity at the inner boundary of the cell in Fig. 8(a) and (b) is based on the emission by the phosphor layer formed on the side surface of the barrier rib [15]. Fig. 9(a) and (b) shows (a) the IR emission profiles of the main discharge measured by the ICCD at 200 kHz and (b) the electron density profile of sustain discharge by the 2-D simulation. Like the visible emission profiles in Fig. 8(b), the ICCD image in Fig. 9(a) also shows the discharge shrinkage along the address electrode at 200 kHz in the wide-dischargegap structure. In addition, the 2-D simulation in Fig. 9(b) shows that the electron density was maximal at the arrowed region, which means that the main discharge was attracted toward the address electrode (Z). In general, the glow discharge between the cathode and anode electrodes shows the maximal electron density near the cathode (i.e., near the cathode sheath region) [2], [16]. That is, when the X electrode is a cathode and the Y electrode is an anode, as shown in Fig. 9(b), the cathode sheath should be just below the dielectric layer covering the X electrode, so that the electron density should show the maximal distribution around the cathode sheath. However, the electron density distribution shown in Fig. 9 confirmed that the Z electrode, as well as the X electrode, was working as a cathode electrode. This phenomenon is due to the charged electrons on the lower dielectric layer covering the Z electrode. As mentioned in Fig. 7 in Section III-A, during the self-erasing
IEEE TRANSACTIONS ON PLASMA SCIENCE, VOL. 36, NO. 3, JUNE 2008
discharge, the X and Z electrodes work as the cathode and anode electrodes, respectively. Consequently, the electrons on the upper dielectric layer covering the X electrode were discharged (or erased), whereas the lower dielectric layer covering the Z electrode was charged by electrons. Because some of the wall charges (i.e., electrons) on the X electrode were erased, the X electrode did not work fully as a cathode electrode in the consecutive discharge, whereas, the consecutive sustain discharge was attracted toward the Z electrode due to the electrons above the address electrode. The discharge shrinkage phenomenon on Z electrode at high frequency does not mean that the Z electrode is entirely isolated from the main discharge at low frequency. The small portion of the plate gap discharge between X(Y )–Z could be overlapped with the surface discharge at low-frequency condition. However, the portion of the plate gap discharge is intensified at high frequency by the self-erasing discharge; thereby, the discharge shrinkage occurs. As a result, in the case of the wide-gap discharge with high frequency, the wall-charge redistribution by the self-erasing discharge between the X−Z or Y −Z electrodes results in discharge shrinkage along the address electrode, thereby causing the decrease of luminance. IV. C ONCLUSION The changes in the luminance and consumed power of a wide-gap (= 180 µm) microdischarge cell were examined as functions of the operating frequency, ranging from 40 to 200 kHz. It was found that the luminance decreased and the consumed power increased when increasing the operating frequency. The increase in the consumed power is attributed to the increase in the sustain voltage when increasing the operating frequency. This phenomenon was due to the self-erasing discharge between the sustain and address electrodes caused by the short pulsewidth under the high-frequency condition. The short sustain pulse hindered the conversion of lots of priming particles within the cell into wall charges, thereby resulting in producing the self-erasing discharge, owing to the presence of lots of priming particles. In addition, the decrease in the luminance is attributed to the discharge shrinkage along the address electrode caused by the self-erasing discharge. As a result, the luminous efficiency of the wide-gap structure was observed to be decreased with an increase in the operating frequency. When the self-erasing discharge produced in the plate gap can be suppressed completely, i.e., the space charges can be fully converted into the wall charges, the luminous efficiency of the wide-gap structure can be improved considerably even under a high frequency of 200 kHz. R EFERENCES [1] G. Veronis and U. S. Inan, “Cell geometry designs for efficient plasma display panels,” J. Appl. Phys., vol. 92, no. 9, pp. 4897–4905, Nov. 2002. [2] J. H. Seo, W. J. Chung, C. K. Yoon, J. K. Kim, and K.-W. Whang, “Twodimensional modeling of a surface type alternating current plasma display panel cell: Discharge dynamics and address voltage effects,” IEEE Trans. Plasma Sci., vol. 29, no. 5, pp. 824–831, Oct. 2001. [3] S.-H. Jang, K. D. Cho, H.-S. Tae, K. C. Choi, and S.-H. Lee, “Improvement of luminance and luminous efficiency using address voltage pulse during sustain-period of AC-PDP,” IEEE Trans. Electron Devices, vol. 48, no. 9, pp. 1903–1910, Sep. 2001.
KIM AND TAE: EFFECTS OF FREQUENCY ON LUMINANCE CHARACTERISTICS OF AC PLASMA DISPLAY PANEL
[4] L. F. Weber, “Positive column AC plasma display,” in Proc. IDRC Dig., 2003, pp. 119–124. [5] J. Ouyang, T. Callegari, B. Caillier, and J. P. Boeuf, “Large-gap AC coplanar plasma display cells: Macro-cell experiments and 3-D simulations,” IEEE Trans. Plasma Sci., vol. 31, no. 3, pp. 422–428, Jun. 2003. [6] H. Kim and H.-S. Tae, “Firing and sustaining discharge characteristics in alternating current microdischarge cell with three electrodes,” IEEE Trans. Plasma Sci., vol. 32, no. 2, pp. 488–492, Apr. 2004. [7] J. Y. Kim, H. Kim, H.-S. Tae, J. H. Seo, and S.-H. Lee, “Effect of voltage distribution among three electrodes on microdischarge characteristics in AC-PDP with long discharge path,” IEEE Trans. Plasma Sci., vol. 34, no. 6, pp. 2579–2587, Dec. 2006. [8] K. C. Choi, N. H. Shin, K. S. Lee, B. J. Shin, and S.-E. Lee, “Study of various coplanar gaps discharges in ac plasma display panel,” IEEE Trans. Plasma Sci., vol. 34, no. 2, pp. 385–389, Apr. 2006. [9] T. Minami, T. Shiga, S. Mikoshiba, and G. Oversluizen, “High-frequency drive of high-Xe-content PDPs for high efficiency and low-voltage performance,” J. Soc. Inf. Disp., vol. 12, no. 2, pp. 191–197, 2004. [10] S. Mikoshiba, “Low voltage driving of high Xe pressure PDPs,” in Proc. ASID Dig., 2006, pp. 97–102. [11] K. C. Choi, B.-J. Rhee, and H.-N. Lee, “Characteristics of charged and metastable species in micro-discharges of AC-plasma display panel,” IEEE Trans. Plasma Sci., vol. 31, no. 3, pp. 329–332, Jun. 2003. [12] W. J. Chung, B. J. Shin, T. J. Kim, H. S. Bae, J. H. Seo, and K.-W. Whang, “Mechanism of high luminous efficient discharges with high pressure and high Xe-content in AC PDP,” IEEE Trans. Plasma Sci., vol. 31, no. 5, pp. 1038–1043, Oct. 2003. [13] R. Raue, M. Shiiki, H. Matsukiyo, H. Toyama, and H. Yamamoto, “Saturation of ZnS:Ag,AI under cathode-ray excitation,” J. Appl. Phys., vol. 75, no. 1, pp. 481–488, Jan. 1994. [14] S. Mikoshiba, S. Shirai, S. Shinada, and M. Fukushima, “Saturation of Zn2 SiO4 :Mn luminescence under intense VUV excitation,” J. Appl. Phys., vol. 50, no. 2, pp. 1088–1090, Feb. 1979. [15] S. Harada, A. Iwata, and H. Uchiike, “Improvement in luminous efficiency and proposal of new gray scale control method by using TB-separated PDP,” Electron. Commun. Jpn., vol. 89, no. 1, pt. 2, pp. 32–40, Jan. 2006. [16] A. Shvydky, V. N. Khudik, C. E. Theodosiou, and V. P. Nagorny, “Dynamic positive column in long-gap barrier discharges,” J. Appl. Phys., vol. 99, no. 1, p. 013 303, Jan. 2006.
815
Hyun Kim received the B.S., M.S., and Ph.D. degrees in electronic engineering from Kyungpook National University, Daegu, Korea, in 1999, 2002, and 2007, respectively. He was with Samsung SDI, Suwon, Korea, from 2004 to 2007, where his work focused on the design of microdischarge cell and driving waveform in ac PDP. Since August 2007, he has been a Postdoctoral Fellow with the School of Electrical Engineering and Computer Science, Kyungpook National University. Dr. Kim is a member of the Society for Information Display and the Korean Information Display Society.
Heung-Sik Tae (M’00–SM’05) received the B.S., M.S., and Ph.D. degrees in electrical engineering from the Seoul National University, Seoul, Korea, in 1986, 1988, and 1994, respectively. Since 1995, he has been a Professor with the School of Electrical Engineering and Computer Science, Kyungpook National University, Daegu, Korea. His research interests include the optical characterization and driving waveform of plasma display panels, the design of millimeter wave guiding structures, and electromagnetic wave propagation using metamaterial. Dr. Tae is a member of the Society for Information Display. He has been serving as an Editor for the IEEE TRANSACTIONS ON ELECTRON DEVICES section on display technology since 2005.