Article
Effects of Operating Parameters on Measurements of Biochemical Oxygen Demand Using a Mediatorless Microbial Fuel Cell Biosensor Min-Chi Hsieh 1 , Chiu-Yu Cheng 1, *, Man-Hai Liu 2 and Ying-Chien Chung 1, * Received: 8 November 2015; Accepted: 23 December 2015; Published: 28 December 2015 Academic Editor: Vittorio M.N. Passaro 1 2
*
Department of Biological Science and Technology, China University of Science and Technology, Taipei 11581, Taiwan;
[email protected] Department of Food Science, China University of Science and Technology, Taipei 11581, Taiwan;
[email protected] Correspondence:
[email protected] (C.-Y.C.);
[email protected] (Y.-C.C.); Tel.: +88-622-782-1862 (Y.-C.C.); Fax: +88-627-865-456 (Y.-C.C.)
Abstract: The conventional Biochemical Oxygen Demand (BOD) method takes five days to analyze samples. A microbial fuel cell (MFC) may be an alternate tool for rapid BOD determination in water. However, a MFC biosensor for continuous BOD measurements of water samples is still unavailable. In this study, a MFC biosensor inoculated with known mixed cultures was used to determine the BOD concentration. Effects of important parameters on establishing a calibration curve between the BOD concentration and output signal from the MFC were evaluated. The results indicate monosaccharides were good fuel, and methionine, phenylalanine, and ethanol were poor fuels for electricity generation by the MFC. Ions in the influent did not significantly affect the MFC performance. CN´ in the influent could alleviate the effect of antagonistic electron acceptors on the MFC performance. The regression equation for BOD concentration and current density of the biosensor was y = 0.0145x + 0.3317. It was adopted to measure accurately and continuously the BOD concentration in actual water samples at an acceptable error margin. These results clearly show the developed MFC biosensor has great potential as an alternative BOD sensing device for online measurements of wastewater BOD. Keywords: biochemical oxygen demand; biosensor; microbial fuel cell; wastewater
1. Introduction BOD is an international regulatory environment index for monitoring biodegradable organic pollutants in water. In industries, continuous monitoring of organic loads is very important in order to comply with regulatory requirements. Thus, a rapid method for online or in situ analysis of organic loads is a desirable option, as opposed to a five-day test using the conventional BOD method [1]. Since the conventional test is time-consuming and requires extensive training to achieve reproducible results, it is not suitable for active intervention, environmental monitoring, or process control [1]. Some alternative techniques have been developed to overcome the disadvantages of the conventional BOD method. In the past years, several researchers have developed biosensors based on dissolved oxygen (DO) probes and immobilized cells for use as the biological recognition element [2]. Such systems generally give a good relationship between the output signal and BOD concentration, but may suffer from unstable operation [3]. A microbial fuel cell (MFC) is a device that uses microorganisms as catalysts to generate electricity from organic or inorganic fuels. It thus provides a potential approach for the generation of renewable energy or for powering of electronic sensors [3–5]. It can be operated with or without mediators by
Sensors 2016, 16, 35; doi:10.3390/s16010035
www.mdpi.com/journal/sensors
Sensors 2016, 16, 35
2 of 10
using an electrochemically active bacterium or a microbial consortium. Considering the operating convenience and cost, the mediatorless MFC is appropriate for developing a BOD biosensor [6]. The MFC biosensor is a promising method for applications in BOD measurements because it has broad substrate versatility, good operating stability, and high result reproducibility [5]. Although some studies related to MFC-type BOD biosensors have been presented, MFC biosensors inoculated with mixed cultures of unknown strains require continuous maintenance after construction of the MFC [7]. Requirement of another MFC biosensor with similar performance makes construction difficult because the composition of the mixed culture is unknown. This problem is probably where the greatest uncertainty in MFC design lies. Such uncertainty significantly limits the commercial application of MFC biosensors. Hence, Hsieh and Chung developed a MFC biosensor inoculated with known mixed cultures. They were able to use the established system to measure BOD concentrations in various wastewater samples in batch mode [7,8]. In a fixed MFC infrastructure, parameters affecting the MFC performance include fuel type, coexisting ions, electron acceptors, liquid retention time (LRT) in the anode, and gas retention time (GRT) in the cathode [9,10]. In earlier studies, a glucose–glutamate BOD standard solution has been used often to evaluate MFC performance in measuring BOD in wastewater samples. However, such studies focused on evaluating compounds such as carbohydrates, proteins, and lipids as BOD mode substrates are limited. Theoretically, a high BOD concentration leads to a high signal output. However, this is only true to a certain extent. Under anaerobic, anoxic, and microaerophilic conditions, microbes utilize organic substrates through different metabolic pathways, following Monod growth kinetics, and producing different electric outputs [11,12]. Hence, it is important to understand the effect of various fuels on the MFC performance in measuring BOD concentration in water samples [3]. Some ions such as Na+ , K+ , Ca2+ , Mg2+ , Cl´ , and NH4 + exist at much higher concentrations than that of H+ in wastewater, thus potentially affecting the function of traditional ion-exchange membranes in MFCs [5,13]. Influent wastewater containing Fe2+ , Mn2+ , Zn2+ , Cu2+ , and Cr6+ ions may be toxic to microbes in the MFC and may thereby impair the MFC performance. Thus, evaluating the effects of coexisting ions on MFC operations is necessary. Although the MFC-type BOD biosensor has been shown to have long-term operational stability [8], the signal produced from MFC biosensor is significantly reduced when electron acceptors with high redox potential (oxygen, nitrate, nitrite, or sulfate) are present in the influent [14]. To measure accurately the BOD concentration in samples, acceptors in the influent should be removed from the influent wastewater. Azide, cyanide, and rotenone, known respiratory inhibitors, may reduce interference from electron acceptors when added to the influent [15]. In our previous research, a mediatorless MFC biosensor inoculated with a known bacterial mixture was developed for rapid measurement of BOD in “batch” mode. An operating procedure for the MFC biosensor that includes inoculation, immobilization, startup, and operation was established and tested [7]. In this study, a similar mediatorless MFC biosensor inoculated with a known bacterial mixture was constructed to measure BOD concentrations in various wastewater samples. The effects of important operating parameters on establishing reliable calibration curves between BOD concentration and output signals were evaluated. These parameters included influent fuel types, coexisting ions in the influent, electron acceptors in the influent, LRT in the anode, and GRT in the cathode. The amended method was successfully demonstrated. Our results could increase the commercial value of a MFC-type BOD biosensor. 2. Materials and Methods 2.1. MFC The dual chamber mediatorless MFC constructed used a BOD biosensor, as previously described [7]. The surface area of the electrodes and the membrane used in the reactor were 0.0098 and 0.0072 m2 , respectively. The MFC biosensor for BOD measurement was inoculated with Thermincola
Sensors 2016, 16, 35
3 of 10
carboxydiphila, Pseudomonas aeruginosa, Ochrobactrum intermedium, Shewanella frigidimarina, Citrobacter freundii, and Clostridium acetobutylicum, which were isolated from the original MFC biosensor. All bacteria were cultured in Luria-Bertani (LB) medium until 1.0 OD600 and then the mixed cultures were added as inoculum. The cell number for T. carboxydiphila, P. aeruginosa, O. intermedium, S. frigidimarina, C. freundii, and C. acetobutylicum in the mixture was 8.2 ˆ 108 , 3.5 ˆ 109 , 2.0 ˆ 109 , 6.8 ˆ 108 , 2.5 ˆ 109 , and 1.5 ˆ 109 CFU/mL, respectively. The immobilization process has been previously described [7]. A short description was as follows: 500 mL mixed cultures were put in a serum bottle and recycled by pump into the MFC at 10-day retention time under anaerobic condition. When the potential reached a steady state (after approximately 32 days of operation), the biofilm in the anode of the MFC was considered stable or mature. The anode compartment was kept anoxic by purging with nitrogen gas, unless stated otherwise. The MFC influent was usually fed at 4 h LRT. Air was purged at 6 min GRT into the cathode compartment to supply O2 needed for the electrochemical reaction, unless stated otherwise. The catholyte contained 100 mM phosphate-buffered saline (PBS) and 100 mM NaCl solution. The MFCs were placed in a temperature-controlled chamber maintained at 35 ˝ C. The external resistance of MFCs was set at 5000 Ω, obtained from the result of the previous polarization experiments [7]. The potential between the anode and cathode was continuously measured by using a multimeter (Model 2700, Keithley Instruments Inc., Cleveland, OH, USA). 2.2. Operating Properties of the MFC Biosensor A 100 mg/L BOD solution containing 75.8 mg/L glucose and 75.8 mg/L glutamic acid (GGA) was used as the standard feed solution. Different liquid retention times in the anode chamber (1–6 h) and gas retention times in the cathode chamber (0–12 min) were adopted to examine the MFC performance. MFCs were fed with different types of substrates, each at 100 mg/L (carbohydrates: glucose, fructose, sucrose, lactose, and maltose; amino acids: glutamine, glycine, isoleucine, methionine, and phenylalanine; acids: acetic acid, propionic acid, and butyric acid; alcohols: ethanol and glycerol) and were operated at 4 h LRT and 6 min GRT to identify distinct metabolic pathways. To reduce the meddling of previous substrate residue, all data were collected after a time period of three times the hydraulic retention time. Additionally, selected substrates with 100 mg/L BOD5 were fed to the MFC to test the MFC performance under anaerobic conditions and to establish the calibration curve. A 100 mg/L GGA solution (as BOD5 ) containing various ions (Fe2+ , Mn2+ , Zn2+ , Cu2+ , Cr6+ , or Cl´ ) at different concentrations were continuously introduced into the MFC to evaluate the effects of coexisting ions in the influent on BOD measurement using the MFC biosensor. The composition of the simulated wastewater containing 100 mg/L GGA solution (as BOD5 ) and electron acceptors (nitrate, nitrite, and sulfate) or metabolic inhibitors (rotenone, KCN, and NaN3 ) at various concentrations was continuously introduced to the MFC to understand their effects on BOD measurement using the MFC biosensor. BOD concentrations in three types of real wastewater (river water, seawater, and domestic wastewater) were measured by using the MFC biosensor and through the BOD5 standard method (five-day BOD test). 2.3. Analysis Data from the multimeter were recorded by a personal computer through a data acquisition system (Testpoint, Capital Equipment Co., Richmond, VA, USA). The potential difference (voltage) and current were recorded under various operating conditions to evaluate the MFC performance. The measured voltage was converted to current according to the relationship, voltage = current ˆ resistance. Current density is the electric current per unit total surface area of the anode. Biochemical oxygen demand analysis adopted the standard BOD method 5210 B. All experiments were conducted by using three separate MFCs. All sample analyses were carried out in triplicate, and mean values were reported.
Sensors 2016, 16, 35
Sensors 2016, 16, 35 resistance. Current density is the electric current per unit total surface area of the anode. Biochemical oxygen demand analysis adopted the standard BOD method 5210 B. All experiments were by using three separate MFCs. All sample analyses were carried out in triplicate, and 3. Resultsconducted and Discussion mean values were reported.
4 of 10
3.1. Effect of Retention Time on MFC Performance 3. Results and Discussion
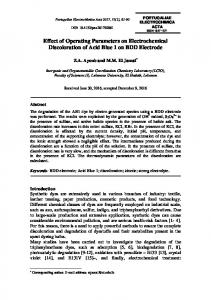
During continuous operation, liquid retention time in the system often determines the degradation 3.1. Effect of Retention Time on MFC Performance efficiency of pollutants. For a MFC system, the degradation efficiency of pollutants may affect electricity During continuous operation, in the system often which determines the increase generation. Generally, a low LRT means aliquid highretention organic time loading to the reactor, should degradation efficiency of pollutants. For a MFC system, the degradation efficiency of pollutants may the voltage. However, a low LRT often results in the insufficient contact between substrates and affect electricity generation. Generally, a low LRT means a high organic loading to the reactor, microbes inwhich the anode which may led to the of the voltage. Thus, to obtain the should compartment, increase the voltage. However, a low LRT decrease often results in the insufficient contact between substrates and microbes in the anode compartment, which may led to the decrease of the as LRTs optimized LRT is decisive. Figure 1a indicates that the current density of the MFC increases voltage. Thus, to obtain the optimized LRT is decisive. Figure 1a indicates that the current density of increase, leveling off when the LRT is higher than 4 h. In a MFC system, oxygen is the electron acceptor the MFC increases as LRTs increase, leveling off when the LRT is higher than 4 h. In a MFC system, in the cathode. Hence, supply of sufficient oxygen favors generation andfavors enhances the oxygen is the the electron acceptor in the cathode. Hence, the electricity supply of sufficient oxygen signal output from generation the MFC. and Figure 1b indicates relationship the1bcurrent density of the electricity enhances the signalthe output from the between MFC. Figure indicates the relationship between the current density of the that MFC the andoptimal GRT in the cathode. indicate MFC and GRT in the cathode. The results indicate GRT rangeThe in results the MFC cathode was that the optimal GRT range in the MFC cathode was 2–6 min. With too short a retention time (GRT: 2–6 min. With too short a retention time (GRT: 0 min) or with insufficient oxygen (GRT: 8–12 min), the 0 min) or with insufficient oxygen (GRT: 8–12 min), the current generation of MFC is reduced. Thus, current generation of MFC is reduced. Thus,were the LRT and GRT for4 MFC were respectively the LRT and GRT for MFC operation respectively set at h and operation 6 min in subsequent set at 4 h and 6 min in subsequent experiments. experiments. 2.5
2.5
(b)
2
2 Current density (mA/m2 )
C urrent density (m A /m2 )
(a)
1.5
1
0.5
1.5
1
0.5
0 0
1
2
3
4
5
6
Liquid retention time (h)
7
0 0
1
2
3
4
5
6
7
8
9
10 11 12 13
Gas retention time (min)
Figure of 1. Effects of (a) retention Liquid retention (GRT: 6 min); Gasretention retention time (LRT: 4 h)4 on Figure 1. Effects (a) Liquid time time (GRT: 6 min); (b)(b)Gas time (LRT: h) the on the MFC MFC performance (GGA concentration: 100 mg/L as BOD5). performance (GGA concentration: 100 mg/L as BOD5 ).
3.2. Effect of Substrates on MFC Performance
3.2. Effect of Substrates on MFC Theoretically, a highPerformance BOD concentration in the influent leads to a higher voltage generated by the MFC; however, this is only true to a certain extent. Since microbes in the MFC anode utilize
Theoretically, a high BOD concentration in the influent leads to a higher voltage generated by organic substrates through various metabolic pathways, electrical outputs may vary even at the the MFC; however, this is[12]. only a certain extent.in Since microbes inappeared the MFC anode utilize same concentration Giltrue et al. to showed that microbes their developed MFC to utilize glucose orthrough acetate better [16]; thus, they were often used in the MFC outputs as model fuels. organic substrates various metabolic pathways, electrical may vary even at the same FigureGil 2 shows effects that of different substrates at a developed concentrationMFC of 100appeared mg/L on thetocurrent concentration [12]. et al. the showed microbes in their utilize glucose density of the MFC in continuous feeding mode. Results indicate that monosaccharides and or acetate better [16]; thus, they were often used in the MFC as model fuels. disaccharides were better substrates for electricity generation in the MFC than were amino acids, Figureorganic 2 shows the effects of different substrates at a 2concentration 100 mg/L on the current acids, or alcohols. The current density of 0.9 mA/m was thus used asof a baseline. An output density of the MFC in continuous feeding mode. Results indicate that monosaccharides and disaccharides were better substrates for electricity generation in the MFC than were amino acids, organic acids, or alcohols. The current density of 0.9 mA/m2 was thus used as a baseline. An output higher than 0.9 mA/m2 by the MFC is due to carbohydrate degradation, while lower current generation is due to degradation of other compounds (Figure 2). For carbohydrates, the current generation from the MFC fed with monosaccharides was higher than that of the MFC fed with disaccharides. Additionally, a stable current density was observed after 1–10 min (Figure 2a). The electricity generated from the MFC depended on the structures of the various amino acids. Among the tested amino acids, methionine and phenylalanine were relatively poorly degraded; therefore, they produced only 0.4–0.5 mA/m2 stable current density (Figure 2b). Figure 2c indicates that ethanol was the substrate that was the most difficult metabolize; hence, a stable current density was observed only
2
1
1.5
0.75
Current density (mA/m2 )
Current density (mA/m2)
higher than 0.9 mA/m2 by the MFC is due to carbohydrate degradation, while lower current generation is due to degradation of other compounds (Figure 2). For carbohydrates, the current generation from the MFC fed with monosaccharides was higher than that of the MFC fed with disaccharides. Additionally, a stable current density was observed after 1–10 min (Figure 2a). The electricity generated from the MFC depended on the structures of the various amino acids. Among Sensors 2016, 16, 35 5 of 10 the tested amino acids, methionine and phenylalanine were relatively poorly degraded; therefore, they produced only 0.4–0.5 mA/m2 stable current density (Figure 2b). Figure 2c indicates that ethanol was the substrate that was the most difficult metabolize; hence, a stable current density was after 15 min. In the following experiments, the BOD measurements were conducted after an average observed only after 15 min. In the following experiments, the BOD measurements were conducted of 5 minafter of operation. an average of 5 min of operation.
1 Glucose Fructose Sucrose Lactose Maltose
0.5 (a)
0.5
4
8
12
16
20
24
28
32
36
40
44
48
Isoleucine Methionine
(b)
0 0
Glutamate Glycine
0.25
Phenylalanine
0
52
0
4
8
12 16
Time (min)
20 24 28 32 Time (min)
36 40 44
48 52
2
Current density (mA/m )
1
0.75
0.5 Acetic acid Propionic acid
0.25
Butyric acid Ethanol Glycerol
(c) 0 0
4
8
12
16
20
24
28
32
36
40
44
48
52
Time (min)
2. Effects of different substrates on MFC the MFC performance.(a)(a)Carbohydrates; Carbohydrates; (b) Figure 2.Figure Effects of different substrates on the performance. (b)Amino Amino acids; acids; (c) Acids and alcohols (substrate concentration: 100 mg/L; LRT: 4 h; GRT: 6 min; n = 3). (c) Acids and alcohols (substrate concentration: 100 mg/L; LRT: 4 h; GRT: 6 min; n = 3).
To establish the calibration curve between the signal output and BOD5 concentration, the
To establish the calibration curve signal and BOD the substrate substrate concentration should be between convertedthe to the BODoutput 5 concentration through the BOD standard 5 concentration, method should 5210 B. Figure 3a indicates of the MFCthrough during continuous of themethod concentration be converted tothe thecurrent BOD5density concentration the BODfeeding standard selected organic compounds at 100 mg/L BOD 5 concentration. The results indicate the variation of 5210 B. Figure 3a indicates the current density of the MFC during continuous feeding of the selected the current generation by the MFC due to the degradation of different organic compounds, even at organic compounds at 100 mg/L BOD5 concentration. The results indicate the variation of the current the same BOD concentration. A MFC fed with 100 mg/L GGA solution generated 1.880 ± 0.012 generation by2, the to the degradation of different organic compounds, even at the same 2) mA/m but MFC MFCs due fed with glycine (1.908 ± 0.021 mA/m2) and acetic acid (1.910 ± 0.013 mA/m 2 BOD concentration. MFC fed(pwith 100When mg/L GGA solution generated 1.880 ˘ 0.012 mA/m , but generated moreAelectricity < 0.05). MFCs were fed with sucrose, isoleucine, methionine, 2 ) and and ethanol as fuels, lower generation wasacetic observed. MFCs fed with glycine (1.908 ˘ current 0.021 mA/m acid (1.910 ˘ 0.013 mA/m2 ) generated more decrease may be attributed to with the degradation of organic compounds through differentas fuels, electricity (pThis < 0.05). When MFCs were fed sucrose, isoleucine, methionine, and ethanol metabolic pathways [17]. To offset the bias of the current generation from different fuels, different lower current generation was observed. BOD5 concentrations of glucose, methionine, acetic acid, and glycerol were used to establish the This decrease may be attributed to the degradation of organic compounds through different metabolic pathways [17]. To offset the bias of the current generation from different fuels, different BOD5 concentrations of glucose, methionine, acetic acid, and glycerol were used to establish the calibration curve. Figure 3b illustrates the relationship between the BOD5 concentration and the current density of the MFC biosensor in continuous feeding mode. A good linear relationship could be observed at BOD5 concentrations ranging from 5 to 235 mg/L. The regression equation for the BOD concentration and the current density of the MFC biosensor was determined to be y = 0.0145x + 0.3317 (r2 = 0.9961). In their studies, Chang et al. [4], who used a dual-chamber MFC, and Kumlanghan et al. [18], who used a large MFC (1.1 L), also observed linear relationships when inlet BOD concentrations were in the range of 20–100 mg/L and 1–25 g/L, respectively. In comparison with the previous systems, our continuous monitoring system showed some competitive advantages because of our lower limit of detection. The regression equation was thus applied in calculating the BOD5 concentration of different water samples.
BOD concentration and the current density of the MFC biosensor was determined to be y = 0.0145x + 0.3317 (r2 = 0.9961). In their studies, Chang et al. [4], who used a dual-chamber MFC, and Kumlanghan et al. [18], who used a large MFC (1.1 L), also observed linear relationships when inlet BOD concentrations were in the range of 20–100 mg/L and 1–25 g/L, respectively. In comparison with the previous systems, our continuous monitoring system showed some competitive advantages because Sensors 2016, 16, 35 of our lower limit of detection. The regression equation was thus applied in calculating the 6 of 10 BOD5 concentration of different water samples. 5 (b)
4.5
Current density (mA/m2 )
4
y = 0.0145x + 0.3317 2
R = 0.9961
3.5 3 2.5 2
Glucose
1.5
Methionine
1
Acetic acid Glycerol
0.5 0 0
20
40
60
80
100 120 140 160 180 200 220 240 260 BOD concentration (mg/l)
3. (a) Effects of different substrates theMFC MFCperformance performance (substrate concentration: 100 mg/L Figure 3.Figure (a) Effects of different substrates onon the (substrate concentration: 100 mg/L as BOD5; LRT: 4 h; GRT: 6 min); (b) Relationship between BOD5 concentration and voltage output of as BOD5 ; LRT: 4 h; GRT: 6 min); (b) Relationship between BOD5 concentration and voltage output of the MFC biosensor (substrate concentration: 5–235 mg/L as BOD5; LRT: 4 h; GRT: 6 min). the MFC biosensor (substrate concentration: 5–235 mg/L as BOD5 ; LRT: 4 h; GRT: 6 min).
3.3. Effect of Coexisting Ions on MFC Performance
3.3. Effect of Coexisting on MFCmembranes Performance The use of Ions ion-exchange to separate the anode and cathode in the MFC is well The flow of electrons must be accompanied by an equal flow of protons or hydroxide Theknown use of[3].ion-exchange membranes to separate the anode and cathode in the MFC is well ions through the ion-exchange membrane. Thus, electron-transfer efficiency is an important factor known [3]. The flow of electrons must be accompanied by an equal flow of protons or hydroxide ions in the control of MFC performance [19]. Actual water samples such as river water, seawater, and through domestic the ion-exchange Thus, electron-transfer is an wastewatermembrane. contain various ions, and the presenceefficiency of these ions in important the samplesfactor may in the control of MFC performance [19]. Actual water as river water, seawater, and domestic interfere with electron transfer in the MFC andsamples may affectsuch the activity of microbes in the anode [20]. The difference in current between the controlions and the anolyte containing metal with wastewater contain various ions, generation and the presence of these in the samples maythe interfere 2+, Zn2+, and Cu2+ was insignificant (p > 0.05) when the ion concentration in the anode Fe2+, Mn electron ions transfer in the MFC and may affect the activity of microbes in the anode [20]. was below 5 mg/L. However, when Cr6+ concentrations in the anolyte were higher than 3 mg/L, the The difference in current generation between the control and the anolyte containing the metal reduction of current density was significant and the responses had relative values of 93%–95% of 2+ , Zn2+ , and Cu2+ was insignificant (p > 0.05) when the ion concentration in the anode ions Fe2+that , Mn of the control (Figure 4a). Bachate et al. demonstrated that the toxicity of Cr6+ to microbes is due was below 5 mg/L. However, Cr6+favorable concentrations in the anolyte were higher than[21]. 3 mg/L, the to its higher solubility in when water and permeability through biological membranes In addition, Cr6+ can act as was an electron acceptor in the the anode underhad anaerobic conditions. reasons of that reduction of current density significant and responses relative values These of 93%–95% may explain currentetdensity of the MFC that dropped. The effects of 6+ chloride ions onisthe of the control (Figurewhy 4a).the Bachate al. demonstrated the toxicity of Cr to microbes due to its responses of the MFC biosensor current generation were also investigated. The average Cl− higher solubility in water and favorable permeability through biological membranes [21]. In addition, concentration in seawater was approximately 20 g/L [22]. Figure 4(b) shows that the responses of the Cr6+ canMFC act as an electron acceptor in the anode under anaerobic conditions. These reasons may biosensor are insignificantly influenced by the increasing Cl− concentration (0–20 g/L). Thus, explain why the current of thebiosensor MFC dropped. The effects of chloride ions on ondifferent the responses these results suggestdensity that the MFC has great potential for BOD measurements of the MFC biosensor currentseawater. generation also investigated. Thetoaverage Cl´ concentration in water bodies, including Thiswere advantage may be attributed the characteristics of the bacterial mixtures inoculated in the anode, which effectively degrade complex organic compounds seawater was approximately 20 g/L [22]. Figure 4b shows that the responses of the MFC biosensor are and survive in toxic conditions [7]. insignificantly influenced by the increasing Cl´ concentration (0–20 g/L). Thus, these results suggest that the MFC biosensor has great potential for BOD measurements on different water bodies, including seawater. This advantage may be attributed to the characteristics of the bacterial mixtures inoculated in the anode, which effectively degrade complex organic compounds and survive in toxic conditions [7]. Sensors 2016, 16, 35
6+ Cr 6+ concentration;(b) − concentration Figure 4. Effects (b) Cl Cl´ on on the the MFCMFC performance (GGA (GGA Figure 4. Effects of (a)ofCr(a) concentration; concentration performance concentration: 100 mg/L as BOD 5; LRT:44h; h; GRT: 6 min). concentration: 100 mg/L as BOD ; LRT: GRT: 6 min). 5
3.4. Effects of Metabolic Inhibitors Previous research has shown that the signal from MFC-type BOD biosensors is significantly reduced when electron acceptors with high redox potential are present in the influent [14]. Wastewater samples from rivers, domestic wastewater, seawater, or industrial wastewater generally contain oxygen gas (O2), nitrate (NO3-), nitrite (NO2−), and even sulfate SO42– [23]. Thus,
Sensors 2016, 16, 35
7 of 10
3.4. Effects of Metabolic Inhibitors Previous research has shown that the signal from MFC-type BOD biosensors is significantly reduced when electron acceptors with high redox potential are present in the influent [14]. Wastewater samples from rivers, domestic wastewater, seawater, or industrial wastewater generally contain oxygen gas (O2 ), nitrate (NO3 ´ ), nitrite (NO2 ´ ), and even sulfate SO4 2´ [23]. Thus, electron acceptors in the influent to the MFC biosensor should be removed to enable accurate measurement of the BOD concentration in these samples. Figure 5a shows the effect of respiratory inhibitors (cyanide, azide, and rotenone) on preventing interference from oxygen gas. In the experiment, the tested influent contained 100 mg/l GGA BOD5 solution with 4.5 mg/L DO (without nitrogen purge) or 100 mg/L GGA BOD5 solution under anaerobic conditions (data not shown). Results indicate that the anaerobic control generated 2.061 ˘ 0.018 mA/m2 of current density (data not shown) and that the current density of the tested influent decreased to an average of 1.922 ˘ 0.024 mA/m2 . With continuous addition of respiratory inhibitors at different concentrations to the MFC, the current density of the tested influent gradually increased and leveled off at the current density of the anaerobic control (2.061 ˘ 0.018 mA/m2 ). The appropriate respiratory inhibitors were rotenone (0.5 mg/L), cyanide (1.0 mg/L), and azide (2.0 mg/L). Figure 5b shows the effect of electron acceptors (NO3 ´ , NO2 ´ , SO4 2´ ) in the MFC influent on the performance. In the experiment, the tested influent contained 100 mg/L GGA BOD5 , 4.5 mg/L DO, and different concentrations of electron acceptors. Results indicate that nitrate in the influent reduced most strongly the current generation by the MFC, followed by nitrite and sulfate. The concentrations of NO3 ´ , NO2 ´ , and SO4 2´ in inhibiting current generation were 100, 500, and 700 µM, respectively. Different concentrations of cyanide (CN´ ) were continuously added to the MFC biosensor to examine the interference of coexisting electron acceptors and to evaluate the MFC performance. In the experiment, the tested influent contained 100 mg/L GGA BOD5 , 4.5 mg/L DO (without nitrogen purge), and different electron acceptors. NO3 ´ , NO2 ´ , and SO4 2´ were fed at 500, 700, and 1000 µM, respectively. Figure 6 shows the improvement in the current generation by the MFC with electron acceptors due to different CN´ concentrations. Results indicate that the current from the MFC increased with CN´ concentration. The current density returned to the level (i.e., 2.061 mA/m2 ) under anaerobic conditions (control) upon addition of CN´ to a 1–2 mg/L final concentration. Azide, cyanide, or rotenone inhibit nitrate reductase, nitrite reductase, or NADH dehydrogenase [17,24,25], thus improving the electron transfer from the anode to the cathode in the MFC. Therefore, the MFC biosensor canSensors measure 2016, BOD 16, 35 5 concentrations in various water samples even when they contain electron acceptors. 2.5
2.2 Cyanide
(b)
(a)
Azide 2.0
2.0
1.0
2.1
3.0 3.0
2
0.5
0.5
1.9
2
4.0
1.0
2.0
1.0
Current density (mA/m2)
Current density (mA/m2 )
Rotenone
1.5
1 Nitrate
0.5
Nitrite Sulfate
0
1.8 0
1
2
3
4
5
6
7
8
9
Time (min)
10 11 12 13 14 15 16
0
100
200
300
400
500
600
700
800
900
1000
Concentration (µM)
Figure 5. Effect of Respiratory (a) Respiratory inhibitors (cyanide, azide, rotenone); (b) Electron acceptors Figure 5. Effect of (a) inhibitors (cyanide, azide, rotenone); (b) Electron acceptors (nitrate, (nitrate, and in theon influent on performance the MFC performance (GGA concentration: 100as mg/L nitrite, andnitrite, sulfate) in sulfate) the influent the MFC (GGA concentration: 100 mg/L BOD5 ; as BOD5; LRT: 4 h; GRT: 6 min; n = 3). LRT: 4 h; GRT: 6 min; n = 3).
0
1.8 0
1
2
3
4
5
6
7
8
9
0
10 11 12 13 14 15 16
100
200
300
Time (min)
400
500
600
700
800
900
1000
Concentration (µM)
Figure 5. Effect of (a) Respiratory inhibitors (cyanide, azide, rotenone); (b) Electron acceptors (nitrate, nitrite, and sulfate) in the influent on the MFC performance (GGA concentration: 100 mg/L Sensors 2016, 16, 35 8 of 10 as BOD5; LRT: 4 h; GRT: 6 min; n = 3).
Figure 6. Effect of cyanide concentration in the on influent on performance. the MFC performance. (GGA Figure 6. Effect of cyanide concentration in the influent the MFC (GGA concentration: oxygen gas concentration: mg/L; concentration: nitrate concentration: 500 μM; 1005 ;mg/L as BOD 100concentration: mg/L as BOD oxygen gas5;concentration: 4.5 mg/L;4.5nitrate 500 µM; nitrite nitrite concentration: 700 μM; sulfate concentration: 1000 μM; LRT: 4 h; GRT: 6 min). concentration: 700 µM; sulfate concentration: 1000 µM; LRT: 4 h; GRT: 6 min).
Continuous BOD Measurementon onWastewater Wastewater Using Using the 3.5.3.5. Continuous BOD Measurement the MFC MFCBiosensor Biosensor Different water bodies usually contain organics, trace metals, toxic compounds, and electron Different water bodies usually contain organics, trace metals, toxic compounds, and electron acceptors. These coexisting compounds may affect BOD measurements by the MFC biosensor. Thus, acceptors. These coexisting compounds may affect BOD measurements by the MFC biosensor. Thus, it it is crucial to evaluate the feasibility of using a MFC biosensor for continuous BOD measurements is crucial to evaluate the feasibility of using a MFC biosensor for continuous BOD measurements on on different actual wastewater samples. In this study, wastewater samples were fed to the MFC different actual In this wastewater samples were fed to thetoMFC biosensor biosensor at wastewater 4 h LRT, 6 samples. min GRT, and study, 2 mg/L CN− was simultaneously added reduce the ´ at 4interference h LRT, 6 min GRT, andelectron 2 mg/L CN was simultaneously added to reduce the interference of of coexisting acceptors. coexisting electron acceptors.the results of BOD concentrations in actual wastewater samples either Table 1 summarizes Table 1 summarizes resultsthe of MFC BOD biosensor concentrations in actual wastewater samples either continuously measured the by using or measured through the BOD 5 standard continuously measured using the MFC biosensor or measured through BOD5had standard method. MFC biosensorby measurements of BOD concentration in river water and the seawater low method. MFC(−3.33 biosensor measurements of BOD concentration in rivermethod. water and seawater had deviations to 2.00%) relative to those from the BOD5 standard Furthermore, BODlow concentration measurements on domestic wastewater MFC biosensor mg/L) were deviations (´3.33 to 2.00%) relative to those from the using BOD5the standard method. (