19th European Signal Processing Conference (EUSIPCO 2011)
Barcelona, Spain, August 29 - September 2, 2011
EFFICIENT BLIND SPEECH SEPARATION SUITABLE FOR EMBEDDED DEVICES Kazunobu Kondo1,2 , Yu Takahashi1 , Seiichi Hashimoto1 , Hiroshi Saruwatari3 , Takanori Nishino4 , and Kazuya Takeda2 1 Corporate
Research & Development Center, Yamaha Corporation, 203, Matsunokijima, 438-0192, Iwata, Japan School of Information Science, Nagoya University, Chikusa-ku Furou-cho, 464-8603, Nagoya, Japan 3 Graduate School of Information Science, Nara Institute of Science and Technology, 8916-5, Takayama-cho, 630-0192, Ikoma, Nara, Japan 4 Graduate School of Engineering, Mie University, 1515, Kurimamachiya-cho, 514-0102, Tsu, Japan E-mail: {tashin,yuu-t,hasimoto}@beat.yamaha.co.jp,
[email protected],
[email protected],
[email protected]
2 Graduate
ABSTRACT A blind speech separation method with a low computational complexity is proposed. This method consists of a combination of independent component analysis with frequency band selection, and a frame-wise spectral softmask method based on an inter-channel power ratio of tentative separated signals in the frequency domain. The softmask cancels the transfer function between sources and separated signals. A theoretical analysis is given. Performance and effectiveness are evaluated via source separation simulations and a computational estimate, and experimental results show the significantly improved performance of the proposed method. The segmental signal-to-noise ratio achieves 7 [dB] and 3 [dB], and the cepstral distortion achieves 1 [dB] and 2.5 [dB], in anechoic and reverberant conditions, respectively. Moreover, there can be a reduction of over 80% in computational complexity compared with unmodified FDICA. 1. INTRODUCTION In recent years, sophisticated mobile devices with microphones, such as smart-phones and digital cameras, have become ubiquitous. The improvement of sound quality for these devices used in noisy environments is widely anticipated. In addition, the blind source separation (BSS) technique has received much attention in many industries for speech enhancement applications. Independent component analysis (ICA) is one of the most researched fields of the BSS method, with many studies aimed at fast convergence [3], engineering research [11], etc. In particular, frequency domain ICA (FDICA) [10] is expected to achieve significant sound quality improvement for speech enhancement applications because practical environments are generally reverberant; however, it requires large computational complexity. The time-frequency mask (TFM) method is another current BSS research field, and one of the most common methods in an underdetermined case is DUET [12]. DUET achieves significant separation performance using sparse signal decomposition and timefrequency clustering (TFC). There are many TFM studies [12, 5, 2], and these methods must store long-interval observed signals for TFC. This means that the TFM method based on TFC requires considerable computational resources. In this paper, we propose a BSS method based on FDICA which uses fewer computational resources, because lower battery power consumption is needed for longer operating time using current processors. Processors with higher performance and lower power consumption will be common in the near future; thus, it may not seem so important to reduce the computational resources which are required. However, sophisticated mobile devices with many extended and rich functions, for example the user interface, must work concurrently with basic functions such as sound input. Consequently, lower power consumption would still be better for basic functions. This implies the necessity and importance of using less computation to perform FDICA to improve sound quality.
© EURASIP, 2011 - ISSN 2076-1465
In general, FDICA stores observed signals to estimate higher order statistics (HOS); moreover, the time length of the stored signal must be long, for example over a few seconds. This leads to large memory consumption to perform FDICA. Meanwhile, HOS must be estimated from separated signals. In addition, the separated signals are different in every iteration because the separation matrix is updated in every iteration. This means that the separation process for the long-term observed signals must work in every iteration. Consequently, this leads to intrinsically large computational complexity. In this paper, we introduce a lower computation BSS method based on FDICA with band selection and a frame-wise spectral softmask. The sound source, e.g., a speech signal, consists of a set of some predominant frequency bands such as formants; therefore, it is natural to assume that limited frequency bands are important for source separation performance and learning FDICA. The semi-blind source separation (semi-BSS) based on the similar concept has been proposed by one of the authors [6]. In the semi-BSS method, the band selection process contributes to the reduction of computational complexity. The conventional method [6] achieves practical separation performance; however, the amplitude of the separated signal with null-beamformer (NBF) is attenuated according to the lower frequency because the phase difference also becomes small in the low frequency region. This attenuation always appears in the microphone-array signal processing of NBF, and this is due to the degradation of the output signal. Therefore, in this paper, we focus on the substitutional separation matrix process without considering the band selection process. The rest of the paper is organized as follows. In Section 2, we briefly introduce the conventional method [6]. In Section 3, we propose the frame-wise spectral softmask. In Section 4, we show our experimental results and evaluate the proposed method. Section 5 presents our conclusions and describes future work. 2. OUTLINE OF CONVENTIONAL SEMI-BSS METHOD In this section, we briefly explain the conventional semi-BSS method [6]. One of the authors has already proposed the semi-BSS method with low computational complexity [6]. In this method, the target signal is assumed to arrive from a known direction; and thus this means ‘semi-blind’. First, a separation matrix initialization method with the known direction of the target signal was proposed. This method contributes a smaller number of iterations. Second, a band selection method was proposed which contributes to smaller memory consumption, and a NBF was used as the substitutional separation matrix for the non-selected bands. Because NBF is one of the most common beamformer methods used to block sound sources, and the FDICA separation matrix corresponds to the coefficients of the beamformer [7]. The proposed semi-BSS method achieves significantly improved efficiency of computation and practical performance.
2319
3.2 Frequency band selection In this paper, we use the conventional method [6] for band selection because the purpose of the proposed method is to reduce the degradation of the separated signals as mentioned in Section 1 and 2. First, the spatial covariance matrix Rx (k) is calculated as follows: Rx (k) = El [X(k, l)XH (k, l)],
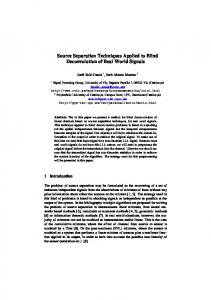
Figure 1: Block diagram of mixing and separation. As mentioned in Section 1, in this paper, we will focus on the substitutional separation matrix of the second method to improve the degradation of the separated signals, and thus we will explain the second method, band selection, briefly. Some bands are selected by the magnitude of the determinant of a spatial covariance matrix, and the selection occurs according to the largest magnitude. Following band selection, the FDICA separation matrix is obtained for the selected bands using the general FDICA algorithm. The source directions of arrival (DOA) are estimated from the FDICA separation matrix, and the permutation is solved by the estimated DOA [7]. The estimated DOA of all the selected bands are averaged, and for non-selected bands, the NBF coefficients, consisting of the averaged DOA, are used as the substitutional separation matrix. For the selected bands, the scaling ambiguity is solved using the projection method [4]. Following the completion of the separation matrices for all frequency bands, the separation process obtains the separated signals from the observed signals. As mentioned in Section 1, the output signals of NBF are attenuated in the low frequency region; therefore, the separated signals might be degraded. 3. PROPOSED METHOD In this section, we formulate the signal model, and we propose the spectral softmask method for separation of the non-selected bands in order to improve the separated signal quality. In this paper, we assume there are two source signals and two microphones. 3.1 Signal model The observed signals in the time domain are transformed into the frequency domain by Short Time Fourier Transform (STFT). The convolutive model describing the signal propagation and mixing is formulated in the frequency domain as follows: X(k, l) = A(k)S(k, l),
(1)
where X(k, l) = [X1 (k, l), X2 (k, l)]T is an observed signal vector at the microphones, S(k, l) = [S1 (k, l), S2 (k, l)]T is a source signal vector, A(k) is a mixing matrix, k is a frequency bin index, l is a frame index, and (·)T denotes the transpose operator. In this case, the left half of Figure 1 shows the block diagram of propagation, and indices k and l are omitted to simplify the diagram. In Fig. 1, the source signals are located at direction θi (k) (i corresponds to the source number) on each frequency band, because in the reverberant condition the source direction deviates on each frequency band. τiS and Ai (k) are a delay and a gain corresponding to the distance between the source position and the center of the microphone position. In addition, τi j (k) is the delay of each microphone ( j corresponds to the microphone number) on the frequency band k. Therefore, the mixing matrix A(k) is formulated as follows: [ ] A (k)e− jω (k)(τ1S +τ11 (k)) A2 (k)e− jω (k)(τ2S +τ21 (k)) A(k) = 1 , (2) A1 (k)e− jω (k)(τ1S +τ12 (k)) A2 (k)e− jω (k)(τ2S +τ22 (k)) where ω (k) is an angular frequency that is equivalent to 2π (kFs /N), Fs is the sampling frequency, and N is the size of the FFT.
(3)
where El is the expectation operator over frame l and (·)H is the Hermitian operator. If there is an only one source in one of frequency bands, the rank of Rx (k) is not full, and the determinant of Rx (k) becomes zero. Therefore, we assume that the determinant of Rx (k) shows degree of the number of source signals. In addition, the number of bands might be determined by system specifications which will be developed. Accordingly, the selection is performed according to the largest magnitude of the determinant of Rx (k) until the number of bands selected reaches the designated number. 3.3 Learning separation matrix on selected bands Following STFT and band selection, the separation matrix W(k) is obtained using the general FDICA algorithm on the selected bands. A separated signal vector Y(k, l) = [Y1 (k, l),Y2 (k, l)]T is formulated as follows: Y(k, l) = W(k)X(k, l). (4) In this paper, we use an iterative FDICA algorithm [8] as follows: { } W p+1 (k) = W p (k) − η · off-diag El [ϕ (k, l)YH (k, l)] W p (k), (5) where p is an iteration number, η is a step-size and off-diag(·) denotes the operator which all diagonal elements are set to zero. ϕ (k, l) ≡ [ϕ1 (k, l), ϕ2 (k, l)]T denotes the nonlinear function vector. Each function is ϕm (k, l) ≡ sgn(Re{Ym (k, l)}) + j sgn(Im{Ym (k, l)}), and Re{·}, Im{·} denote the real and imaginary parts, respectively. The function sgn(·) is used to obtain the sign of each value. 3.4 DOA estimation from separation matrix As mentioned in Section 2, the DOA of the source signals are estimated from the separation matrix, and the permutation is solved by the estimated DOA [7]. The separation matrix is represented by each element as follows: [ ] [ ] w11 (k) w12 (k) w1 (k) W(k) ≡ = , (6) w21 (k) w22 (k) w2 (k) where wi (k) ≡ [wi1 (k) wi2 (k)]. From the standpoint of array signal processing, we calculate the directivity pattern for each frequency band from wi (k), and estimate the DOA of the source signals as follows: ψˆ i (k) = arg min{wTi (k)κ (k, ψ )}, (7) ψ
where κ (k, ψ ) = [1, e jρ (k,ψ ) ] (ρ (k, ψ ) ≡ 2π (kFs /N)(d/c) sin(ψ )) is a steering vector, ψ is a steering direction, d is the distance between the microphones, and c is the velocity of sound. ψˆ i (k) is the directional null, and this corresponds to the source direction on each frequency band. Therefore, we solve the permutation problem using the same method in [7], and a collected source direction θˆi (k) is averaged over the selected bands to obtain the estimated DOA of the source signal, θˆi , as follows: 1 θˆi = ∑ θˆi (k), Nb k∈Ξ
(8)
where Nb is the number of bands, and Ξ is a set of the selected bands.
2320
In the reverberant condition, the direction of the direct sound is deviated by the reflected sound, however the deviation is small enough because in general the direct sound is stronger enough than the reflected sound. Therefore, we assume that the estimated direction θˆi is approximately equivalent to the source direction θi ; thus τi j (k) ≈ τˆi j can be an appropriate assumption. Y2NBF (k, l) is calculated by the same way, and consequently we obtain the approximate relationship as follows: YiNBF (k, l) ≈ Ai (k)Si (k, l){e− jω (τˆ11 +τˆ22 ) − e− jω (τˆ12 +τˆ21 ) }.
(13)
In the lower frequency region, ω (k) is smaller than in the higher frequency region, and thus the amplitude of the delay section of Eq. (13) takes a smaller value due to the lower frequency. This is a reason of the degradation of the separated signals caused by the conventional method as mentioned in Section 2.
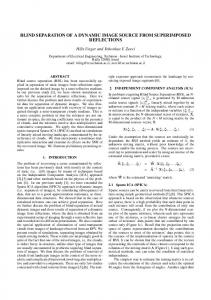
Figure 2: Block diagram of proposed method.
3.5.3 Inter-channel separated signal mask First, we consider a cost function as follows:
3.5 Frame-wise spectral softmask
min El {(Ai (k)Si (k, l) − αi Xi (k, l))2 }
3.5.1 Motivation and strategy
αi
In the conventional method [6], the NBF is used as the substitutional separation matrix for the non-selected bands. However, phase difference is very small in the low frequency region; thus the performance of the NBF becomes very poor. In particular, this leads to extreme degradation in mobile devices because the distance between microphones is small. In contrast to the poor performance of the NBF, the frame-wise softmask can still be obtained. Therefore, for the non-selected bands, we applied the frame-wise spectral softmask instead of the NBF. A block diagram of the proposed method is shown in Fig. 2. 3.5.2 Tentative separation and analysis We consider the delay (d/c) sin(θˆi ) from the DOA obtained in Section 3.4, and this is applied to the NBF to obtain tentative separated signals. As mentioned in Section 3.1, propagation was assumed to be from the source position to the center of the microphone position. Therefore, the propagation delay τiS can be omitted without a loss of generality if we assume that the distance between the microphones is small enough. In this case, the direction only depends on the delay τi j (k). In addition, the distance between the source position and the microphone position can be reflected as the gain Ai (k). Therefore, the observed signal X j (k, l) can be written as follows: X j (k) = A1 (k)S1 (k, l)e− jω (k)τ1 j (k) + A2 (k)S2 (k, l)e− jω (k)τ2 j (k) . (9) In this case, we consider tentative signal separation. The right half of Figure 1 shows the block diagram of the tentative separation, and this process corresponds to NBF. The output signals of the NBF are formulated as follows: Y1NBF (k, l) = X1 (k, l)e− jω (k)τˆ22 − X2 (k, l)e− jω (k)τˆ21 , Y2NBF (k, l) = −X1 (k, l)e− jω (k)τˆ12 + X2 (k, l)e− jω (k)τˆ11 ,
(10)
where we consider the estimated delay for each channel as follows:
τˆ11 = −(d/c) sin(θˆ1 )/2, τˆ21 = (d/c) sin(θˆ2 )/2,
τˆ12 = (d/c) sin(θˆ1 )/2, τˆ22 = −(d/c) sin(θˆ2 )/2.
(11)
Substituting Eq. (9) into Eq. (10), we obtain the relationship between the source signals S1 (k, l), S2 (k, l) and the tentative separated signal Y1NBF (k, l) as follows: Y1NBF (k, l) = X1 (k, l)e− jω (k)τˆ22 − X2 (k, l)e− jω (k)τˆ21 = A1 (k)S1 (k, l)e− jω (k)(τ11 (k)+τˆ22 ) + A2 (k)S2 (k, l)e− jω (k)(τ21 (k)+τˆ22 ) − A1 (k)S1 (k, l)e− jω (k)(τ12 (k)+τˆ21 ) − A2 (k)S2 (k, l)e− jω (k)(τ22 (k)+τˆ21 ) . (12)
(14)
where El is the expectation operator and αi is a mask function. To minimize the cost function Eq. (14), the differentials of αi is considered and the independence between each source signal is also considered; the independence and the expectation utilize that cross correlation terms between each source signal become zero. Therefore, we obtain the Wiener solution and it is approximated by the tentative separated signals in Eq. (13) as follows:
αi = ≈
El {A2i (k)|Si (k, l)|2 } 2 El {A1 (k)|S1 (k, l)|2 } + El {A22 (k)|S2 (k, l)|2 } El {|YiNBF (k, l)|2 } . NBF El {|Y1 (k, l)|2 } + El {|Y2NBF (k, l)|2 }
(15)
In this paper, we consider the shortest expectation to reduce the computational complexity and the frame-wise softmask Mi (k, l) is obtained as follows: Mi (k, l) =
|YiNBF (k, l)|2 . NBF |Y1 (k, l)|2 + |Y2NBF (k, l)|2
(16)
The obtained softmask varies frame by frame, and thus it can trace temporal changes in each speech source signal. Finally, the output separated signals are obtained as follows: W(k)X(k, l) (FDICA) [ ] Y(k, l) = . (17) M1 (k, l)X1 (k, l) (Softmask) M2 (k, l)X2 (k, l) 4. EXPERIMENTAL RESULTS AND ESTIMATION OF COMPUTATIONAL COMPLEXITY In this section, we estimate the computational complexity required, and show the performance of the proposed method using a source separation simulation, in order to evaluate the efficiency and effectiveness of the proposed method. 4.1 Estimation of computational complexity We estimate the number of operations (multiplication, addition as floating operations) based on Eq. (5) to evaluate the efficiency of the proposed method. The parameters of FDICA are shown in Table 3, and the estimate of the computational complexity is shown in Table 1. The number of bands for the estimate is 64 which is determined from the experimental results in Section 4.4. The unit ‘MOPs’ means the number of mega operations. In Table 1, the proposed method shows an over 80% improvement in the required computational complexity compared with unmodified FDICA, and is almost equivalent to the conventional method [6].
2321
Table 1: Computational complexity FDICA 287 (100%)
number of operations [MOPs]
conventional 46 (16%)
Table 3: FDICA parameters proposed 48 (17%)
FFT Size FFT Shift Learning Time Iteration Step Size Initial Matrix Permutation Solver Scaling Solver
Table 2: Signals for simulation Anechoic Samp. Freq. Rev. Time Voice type Location pair
Reverberant 8 [kHz] − 500 [msec] Male(2), Female(2) {-45,45}, {-90,0}, {-45,0} [deg]
4.2 Simulation conditions The speech signals are recorded with two omni-directional microphones (SHURE SM93) and the distance between them is 3.6 cm. The recorded conditions are shown in Table 2 and Fig. 3. The voice signals are played back via loudspeakers and recorded individually, and the mixed signals are obtained when the simulation is performed. The parameters of FDICA are shown in Table 3. The number of bands ranges from 384 to 32 because these numbers are roughly the ratio of integers, 3/4, 1/2, · · · , 1/16, for the number of frequency bands 513. As mentioned in Section 1, FDICA must store the observed signals whose lengths are longer than a few seconds. Additionally, the separated signals to estimate HOS are different in every iteration, because the separation matrix is updated in every iteration. These are the primary reasons that the computational complexity required for FDICA is high; therefore, the smaller number of selections contribute to a lower computational complexity, which results in smaller memory consumption. Although the classical FDICA algorithm is used in this paper, it can be replaced with the state-of-the-art method. In that case, the proposed method, which consists of band selection and the framewise softmask for the non-selected bands, can be applied to any state-of-the-art FDICA methods; therefore, the proposed method is an improvement of the FDICA method without a loss of generality. 4.3 Evaluation measure The performance of the proposed method is evaluated by the segmental signal-to-noise ratio (SNRseg ) [1] and cepstral distortion (CD) [9]. SNRseg is very common method for evaluating noise suppression, high-efficiency coding such as MP3, etc. In general, SNRseg is known to have better correlation with the perception of noisy speech by humans than the entire interval SNR [1]. The proposed method is based on the spectral softmask method, and thus the degradation of the separated signals can be estimated. Therefore, SNRseg is appropriate for evaluating the proposed method. CD
Figure 3: Recording conditions.
1024 [sample] 256 [sample] 3 [sec] max.200 [times] 0.01 Identity DOA [7] Projection method [4]
is another measure of the degree of distortion via the cepstrum domain, and this can evaluate distortion of a spectral envelope. When we evaluate the proposed method, each frequency domain signal is transformed into the time domain signal via inverse STFT. As mentioned in Table 3, the projection method [4] is used to solve the scaling ambiguity of FDICA, and this means that each separated signal corresponds to one of the observed signals. Therefore, we evaluate the performance between one of the observed signals and the separated signal. Each term of the right side in Eq. (9) corresponds to one of the observed signal. The observed signal in the time domain is formulated as follows: x1 (n) = x11 (n) + x21 (n), x2 (n) = x12 (n) + x22 (n),
(18)
where each separated signal in the time domain is yi (n), and i is the source number. In this case, SNRseg is defined as follows: SNRseg ≡
1 1 2∑ N ls i
∑ x2 (m, ls )
m ii , ∑ ∑m {xii (m, ls )−yi (m, ls )}2
(19)
ls
where xi j (m, l) and yi (m, l) are the observed signal and the separated signal in the time domain of frame ls and time m in the frame, j is the microphone number, Nls is the number of frames, and the obtained SNRseg for each channel are averaged. We calculate CD from the speech components, and it is defined as follows: 20 1 CD ≡ ∑ 2 i Nlc log 10
{
∑ lc
v u u t
B
∑ 2(Cx (m,l ) (ν , lc )−Cy (m,l ) (ν , lc
ν =1
ii
c
i
c
))2
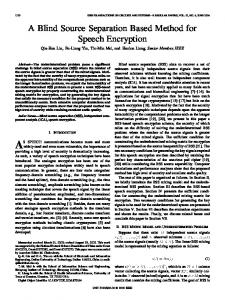
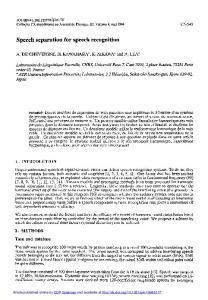
(20) where C(·) (ν , lc ) is the ν th cepstral coefficient of the signal (·) in frame lc , Nlc is the number of frames. The obtained CD values for each channel are averaged (‘1/2’ means an average for two channels). B is the number of dimensions of the cepstrum used in the evaluation; we set B = 20. A small CD value indicates that the sound quality of the separated signal is high. 4.4 Simulation result of source separation Figure 4 shows the performance of the proposed method, the x-axis shows the number of bands, and the y-axis shows SNRseg and CD. The y-axis of CD has been flipped because the lower value of CD means the better sound quality. ‘CONV’ denotes the conventional method [6] and ‘PROP’ denotes the proposed method. ‘A’ and ‘R’ denote anechoic and reverberant conditions. Figure 4 shows that the proposed method is significantly better than the conventional method, and that as the number of bands falls, we can confirm that SNRseg is improved and CD is degraded using the proposed method. This means that the proposed method has a trade-off, and that 64 can be the best number of bands to select. Figure 5 shows the performance comparison of BSS. The xaxis shows SNRseg , and the y-axis shows CD. Again, the y-axis is turned over because CD improves with a smaller value. ‘PROP’, ’FDICA’ and ’DUET’ denote the proposed method, FDICA and
2322
} ,
5. CONCLUSION CONV, A
PROP, A
CONV, R
PROP, R
A blind source separation method involving lower computational complexity was proposed. This method is based on FDICA with band selection and the frame-wise spectral softmask derived from the tentative separated signals. A theoretical analysis of the tentative separated signals was given, and the proposed frame-wise spectral softmask was only generated by the power of the tentative separated signals. The efficiency of the proposed method is evaluated using the computational estimate, which shows that only a small amount of additional computation is required compared to the conventional method. The effectiveness was evaluated via source separation simulations in the anechoic and reverberant conditions, and the sound quality of the proposed method is much better than the conventional method and partially better than FDICA and DUET. The proposed method required dramatically lower computational complexity (80% lower) than the unmodified FDICA method with the number of selected bands as 64 (1/8 of the total number of frequency bands), while significantly improving performance over the conventional method. Although the proposed method is practical enough, future works will include analysis and evaluation in noisy, more typical, environments.
Segmental SNR [dB]
10
5
0
−5 384
256
192 128 Number of selected bands
64
32
(a) Segmental SNR CONV, A
PROP, A
CONV, R
PROP, R
Cepstral Distortion [dB]
0 2 4
REFERENCES
6
[1] J. Deller, J. Proakis, and J. Hansen. Discrete-Time Processing of Speech Signals. Macmillan, New York, 1993. [2] N. Duong, E. Vincent, and R. Gribonval. Under-determined convolutive blind source separation using spatial covariance models. Proc. of ICASSP2010, pages 9–12, March 2010. [3] A. Hyv¨arinen, J. Karhunen, and E. Oja. Independent Component Analysis. Wiley, New York, 2001. [4] S. Ikeda and N. Murata. A method of ica in time-frequency domain. Proc. of ICA 1999, pages 365–371, Jan 1999. [5] Y. Izumi, N. Ono, and S. Sagayama. Sparseness-based 2ch bss using the em algorithm in reverberant environment. Proc. of WASPAA 2007, pages 147–150, Oct 2007. [6] K. Kondo, M. Yamada, and H. Kenmochi. A semi-blind source separation method with a less amount of computation suitable for tiny dsp modules. Proc. of Ineterspeech 2009, pages 1339–1342, Sep 2009. [7] S. Kurita, H. Saruwatari, S. Kajita, K. Takeda, and F. Itakura. Evaluation of blind signal separation method using directivity pattern under reverberant conditions. Proc. of ICASSP2000, 5:3140–3143, June 2000. [8] N. Murata and S. Ikeda. An on-line algorithm for blind source separation on speech signals. Proc. of NOLTA 1998, pages 923–926, Sep 1998. [9] L. Rabiner and B. Juang. Fundamentals of Speech Recognition. Prentice-Hall, New Jersey, 1993. [10] P. Smaragdis. Blind separation of convolved mixtures in the frequency domain. Neurocomputing, 22:21–34, Nov 1998. [11] Y. Takahashi, T. Takatani, H. Saruwatari, and K. Shikano. Blind spatial subtraction array with independent component analysis for hands-free speech recognition. Proc. of IWAENC 2006, Sep 2006. [12] O. Yilmaz and S. Rickard. Blind separation of speech mixtures via time-frequency masking. IEEE Trans. on Signal Processing, 52(7):1830–1847, July 2004.
8 384
256
192 128 Number of selected bands
64
32
(b) Cepstral distortion Figure 4: Performance of proposed method.
DUET, respectively, while ‘A’ and ‘R’ denote anechoic and reverberant conditions. In this comparison, the number of bands is 64. In this experiment, we only use the time difference to perform DUET because source powers are set equivalent to each other. In Fig. 5, the upper right corner shows better performance, and the lower left corner shows worse performance. Therefore, we can confirm that the sound quality of the proposed method is better than FDICA for SNRseg and better than DUET for CD. This tendency is shown in both anechoic and reverberant conditions. Consequently, the degradation of the conventional method is significantly improved using the proposed method from Fig. 4. The proposed method is partially better than FDICA and DUET. In addition, as mentioned in Section 4.1, the efficiency of the proposed method was confirmed by the computational estimate. Therefore, from these results, coexistence of the effectiveness and efficiency of the proposed method is confirmed.
Cepstral Distortion [dB]
0 1 2 3 4 5 6 0
PROP,A PROP,R FDICA,A FDICA,R DUET,A DUET,R 1
2
3 4 Segmental SNR [dB]
5
6
7
Figure 5: Performance comparison.
2323