1
1569171372
Demo Abstract: Efficient Building Management with IP-based Wireless Sensor Network Rostislav Spinar1, Panneer Muthukumaran1, Rodolfo de Paz1, Dirk Pesch1, Weiping Song2, Shafique Ahmad Chaudhry2, Cormac J. Sreenan2, Essa Jafer3, Brendan O’Flynn3, James O’Donnell4, Andrea Costa4, Marcus Keane4 {rostislav.spinar, panneer.muthukumaran, rodolfo.depaz, dirk.pesch}@cit.ie, {w.song, s.chaudhry, cjs}@cs.ucc.ie, {essa.jafer, brendan.oflynn}@tyndall.ie, {jtod15, andre.costa.phd}@gmail.com,
[email protected] 1
Centre for Adaptive Wireless Systems, Cork Institute of Technology , Ireland Mobile Internet Systems Lab, Department of Computer Science, University College Cork, Ireland 3 Tyndall National Institute, Lee Maltings, Cork, Ireland 4 Informatics Research Unit for Sustainable Engineering, National University of Ireland, Galway
2
Abstract—Existing Building/Energy Management Systems (BMS/EMS) fail to convey holistic performance to the building manager. A 20% reduction in energy consumption can be achieved by efficiently operated buildings compared with current practice. However, in the majority of buildings, occupant comfort and energy consumption analysis is primarily restricted by available sensor and meter data. Installation of a continuous monitoring process can significantly improve the building systems’ performance. We present WSN-BMDS, an IP-based wireless sensor network building monitoring and diagnostic system. The main focus of WSN-BMDS is to obtain much higher degree of information about the building operation then current BMSs are able to provide. Our system integrates a heterogeneous set of wireless sensor nodes with IEEE 802.11 backbone routers and the Global Sensor Network (GSN) web server. Sensing data is stored in a database at the back office via UDP protocol and can be access over the Internet using GSN. Through this demonstration, we show that WSN-BMDS provides accurate measurements of air-temperature, air-humidity, light, and energy consumption for particular rooms in our target building. Our interactive graphical user interface provides a user-friendly environment showing live network topology, monitor network statistics, and run-time management actions on the network. We also demonstrate actuation by changing the artificial light level in one of the rooms.
to facilitate this assessment. The system has been developed by the WISEN Emnets project [4] and deployed as a part of the BuildWise project in the Environmental Research Institute (ERI) [5] building in Cork. The WSN-BMDS test-bed is a 3tiered framework with the following components: 1. IEEE 802.15.4 sensor nodes forming 6LoWPAN network For sensing purposes, we use Tyndall [6] and TMote Sky [7] sensor nodes. The Tyndall board is equipped with an Atmega1281 MCU and EM2420 radio chip and the TMote Sky features a MSP430 MCU with CC2420 radio chip. Both platforms include sensors for monitoring air-temperature, airhumidity and light. Moreover, we utilize recently developed sensor boards for the Tyndall platform that incorporates electricity meters as well as the interface for controlling (on/off) an AC load. Both platforms run the recently released b6LoWPAN stack [9]. 2. IEEE 802.11 gateways as 6lowPAN/IPv6 routers Soekris embedded PC boards [10] with Atheros CM9 Wi-Fi cards and a single IEEE802.15.4 node form a backbone network spanning all three floors of the ERI building.
Index Terms— Wireless sensor networks, network management, policy-based management, building management systems
3. User-end PC for presenting network variables The network data is gathered from the first and ground floor to the local PC in the basement. The sensor readings are processed and stored by the GSN. An interactive network monitoring and management system described in section III.
I. SYSTEM ARCHITECTURE
II. NODE LOCATIONS
Enhanced understanding of building operation is required to achieve improved performance, with a 20% reduction of energy consumption achievable by efficiently operated buildings compared with typical practice [1]. Currently, building managers rely heavily on the BMS/EMS to acquire performance related information. The BuildWise project [2] has identified that the level of information available with existing BMS\EMS is insufficient to perform the required performance based assessment of building operation [3]. This assessment is essential in order to reduce building energy consumption, operational costs, and to comply with European Legislation (Directive 2006/32/EC). We strive to fill this gap by deploying the WSN-BMDS as a base technology platform
In order to demonstrate the inefficiencies in building operation three main zones within the ERI building have been chosen according to the needs of the BuildWise project.
© Rostislav Spinar et al., 2009
- Seminar Room and Break-Out Space on the first floor (nodes 1, 2, 3) with a room where the manifold for this space is located (node 4) - Open Office space on the first floor (nodes 8, 9, 10) with a room where the manifold for this space is located (node 7) - Immunology lab on the ground floor (nodes 11, 12)
2
1569171372
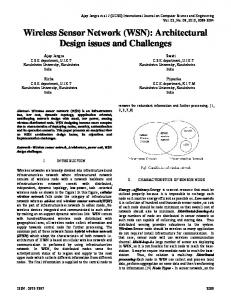
Fig. 1: The WSN-BMDS deployed in the ERI, spans three floors of the ERI building.
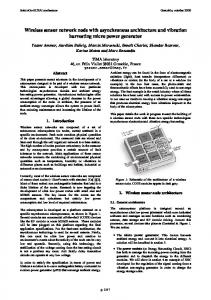
Fig. 2. Management console
Nodes 5, 6, 13 are intermediate nodes maintaining connectivity to the gateway. Moreover, node 5 provides data sets from a room where no wired sensors are located as this room was created later by partitioning one bigger space into two smaller rooms. Nodes 6 and 13 also provide a data calibration measure since they are located on top of wired sensors of the current BMS.
V. DEMONSTRATION
III. NETWORK MONITORING AND MANAGEMENT Network management of our testbed is essential to keep the WSN-BMDS always operational. EmNets [4] Management Protocol (EMP), runs as the management data collection and dissemination protocol. EMP not only collects node and network level management information, it can also be used to execute management operations on the sensor nodes. Our interactive graphical user interface provides a userfriendly environment to view live network topology, monitor network statistics, and run management actions on the network. Fig.1. is a snapshot of the deployed sensor network topology. Users, by just navigating the topology map, can get the basic node information e.g. node ID, node’s IP address, and sensed variables. Fig.2. shows the detailed information related to the sensor nodes under various categories. Run-time network probing is also supported to collect network management information and network statistics.
We will demonstrate the operation of the WSN-BMDS system as deployed in the ERI building, which presents a base line for research in the area of wireless sensor and actuator networks for wireless building performance management. The demonstration will provide a real-time view and historical measurements of air-temperature, air-humidity, light, and energy consumption from wireless sensors. Through the system, users will be encouraged to control the lighting level in a room with immediate feedback using USB cameras recently deployed in the ERI. The possibility to connect directly to any node within the network using IP-compatible applications such as ping or netcat will be also demonstrated. VI. CONCLUSION AND FUTURE WORK We show how the WSN-BMDS can facilitate the objectives of the BuildWise project towards a comprehensive understanding of complex building management and control operations. The system will also provide an experimental facility to conduct research in indoor wireless sensor and actuator networks. More specifically, we make a contribution to the recently released b6lowPAN stack by interfacing it with our new IEEE802.15.4 compatible MeshMAC [8]. Please refer to: http://erideployment.ucc.ie:8080/ for the current status of this demonstration. REFERENCES [1]
IV. DATA STORAGE AND PRESENTATION Accurate measurements from wireless sensors along with an appropriate interface to integrate these measurements into the current BMS are essential parts required by the BuildWise project. Therefore, we have chosen to make use of the Global Sensor Network GSN middleware [11] which acts as a local database as well as provides XML-based interface for applications such as BMS. Furthermore, GSN also provides a Web-based interface to view real-time as well as historical sensor data.
© Rostislav Spinar et al., 2009
James O'Donnell, Marcus Keane and Vladimir Bazjanac, Specification of an Information Delivery Tool to Support Optimal Holistic Environmental and Energy Management in Buildings in ‘SimBuild 2008’ IBPSA-USA. Berkeley, CA, USA. [2] BuildWise Project Website http://zuse.ucc.ie/buildwise [3] Martin Keller, James O’Donnell, Karsten Menzel, Marcus Keane, Ufuk Gokce Integrating the Specification, Acquisition and Processing of Building Performance Information, in Tsinghua science and technology [4] EmNetS Project: http://www.cs.ucc.ie/emnets/ [5] Environmental Research Institute building http://zuse.ucc.ie/buildwise/eri/e_overview.html [6] Tyndall Platform http://www.tyndall.ie/mai/25mm.htm [7] TMote Sky Platform http://www.sentilla.com/moteiv-transition.html [8] P. Muthukumaran, R. Spinar, K. Murray, D. Pesch, “Enabling Low Power Multi-hop Personal Area Sensor Networks”, in Proc. of 10th WPMC, Jaipur, India, December 2007 [9] b6lowPAN Project Website http://smote.cs.berkeley.edu:8000/tracenv/wiki/b6loWPAN [10] Soekris Embedded Boards: http://www.soekris.com/net4826.htm [11] GSN Middleware http://gsn.sourceforge.net