Proceedings of the World Congress on Engineering 2010 Vol I WCE 2010, June 30 - July 2, 2010, London, U.K.
Efficient Chaotic Permutations for Image Encryption Algorithms Abir Awad1 , Abdelhakim Saadane2
Abstract—Many chaos-based encryption methods have been presented and discussed in the last two decades. In order to reach higher performance, these methods take advantage of the more and more complex behavior of chaotic signals. This paper contributes in this issue by comparing the performance of the well known piecewise linear chaotic map (PWLCM) with that of PWLCM perturbed by a new technique. Both chaotic maps are then used to control three bit-permutation methods having good inherent cryptographic properties. When applied to image, the proposed chaotic permutation methods controlled by the perturbed map, present higher performance characteristics.
Index Terms—Image encryption, Chaotic map, Perturbation technique, Random permutation method.
I. INTRODUCTION The security of transmitted digital information through a channel, against passive or active attacks, becomes more and more important. Since 1990s, chaos has been widely studied in secure communications. The idea of taking advantage of digital chaotic systems to construct cryptosystems has been extensively investigated and attracts more and more attention [1-3]. Chaotic output signals, which present random statistical properties, are used for both confusion and diffusion operations in a cryptosystem. Diffusion spreads the redundant information in the plain text over the cipher text. As a primary method to achieve diffusion, permutation is widely used in cryptographic algorithms. Bit level permutations particularly, are the core of any encryption algorithm. Based on such bit level permutation, several methods have been proposed in the literature. Few of them however, have performed comparative study between chaos based permutations. This paper proposes to tackle this problem by comparing the performance of three well attractive bit level permutations when they are controlled by two different chaotic signals. The first two bit level permutations called Grp and Cross permutation, are detailed in [4-6]. These permutations are in
fact, permutation instructions developed to efficiently implement arbitrary n-bit permutation in any programmable processors, whether they are general purpose microprocessors or application-specific cryptography processors. The third one, called hereafter Socek permutation, has been developed by Socek and al. and is well described in [7]. Proposed to enhance a previous algorithm, this permutation uses a 1-D piecewise linear chaotic map (PWLCM) instead of the original 1-D chaotic Logistic map thereby improving the statistical properties of the generated secret bits. In what follows, we propose to control theses methods with perturbed chaotic generators. In order to be used in all applications, chaotic sequences must seem absolutely random. To this end, the perturbing orbit technique presented in [8] is used. Designed to generate chaotic signals with desired statistical properties and verifying NIST statistical tests, this technique has already been used in [9] to control a cryptographic algorithm. Digital images are used to test the proposed approaches. Indeed, it is well known that images are different from texts in many aspects, such as high redundancy and correlation. The main obstacle in designing effective image encryption algorithms is that it is rather difficult to diffuse such image data. In most of the natural images, the value of any given pixel can be reasonably predicted from the values of its neighbours. However, we prove that the proposed chaotic permutation methods can be used in order to dissipate the high correlation among pixels and increase the entropy value. This paper is organized as follows. Section 2 describes the perturbed PWLCM chaotic map. Section 3 explains the proposed permutation techniques. The simulation results are presented in section 4 while section 5 is devoted to the conclusion. II. PERTURBED PWLCM MAP A piecewise linear chaotic map (PWLCM) is a map composed of multiple linear segments. x(n) F[x(n 1 )]
Manuscript received March 18, 2010. This work is made within the framework of the research project “ACSCOM”, “Apport du Chaos dans la Sécurité des systèmes Communicants Optiques et Mobiles” supported by ANRT. 1 Abir Awad is with the Operational Cryptology and Virology Laboratory (C +V)^O, ESIEA-OUEST. Rue Drs Calmette et Guérin, 53003 Laval, Cedex. Phone : + 33-2-43594909; e-mail:
[email protected]. 2 Abdelhakim Saadane is with XLIM – SIC Laboratory, University of Nantes, Christian Pauc street BP 50609 Nantes Cedex 3, France (phone: + 33-2-40683046; e-mail:
[email protected]
ISBN: 978-988-17012-9-9 ISSN: 2078-0958 (Print); ISSN: 2078-0966 (Online)
1 x(n 1 )x p 1 [x(n 1 ) p]x 0 . 5 p F[ 1 x(n 1 )]
if 0 x(n 1 ) p
(1)
if p x(n 1 ) 0.5 if 0.5 x(n 1 ) 1
WCE 2010
Proceedings of the World Congress on Engineering 2010 Vol I WCE 2010, June 30 - July 2, 2010, London, U.K.
where the positive control parameter and the initial condition are respectively p є (0; 0.5) and x(i) є (0; 1). Since digital chaotic iterations are constrained in a discrete space with 2N elements, it is obvious that every chaotic orbit will eventually be periodic and will finally go to a cycle with limited length not greater than 2N. Generally, each digital chaotic orbit includes two connected parts: x1, x2,…xl, and xl, xl+1,…xl+n, which are respectively called “transient branch” and “cycle”. Accordingly, l and n+1 are respectively called “transient length” and “cycle period”, and l+n is called “orbit length”. To improve the dynamical degradation, a perturbation based algorithm is used [10]. The cycle length is expanded and so good statistical properties are reached. Here, for computing precision N, each x can be described as: xi ( n ) 0,1
x ( n ) 0. x1 ( n ) x 2 ( n )...xi ( n )... x N ( n )
i 1, 2,..., N
(2)
A suitable candidate for the perturbing signal generator is the maximal length LFSR because its generated sequences have the following advantages: 1) definite cycle length (2k-1) (k is the degree); 2) uniform distribution; 3) delta like autocorrelation function; 4) easy implementation; 5) controllable maximum signal magnitude given by 2-N(2k-1) when used in N-precision system. The perturbing bit sequence can be generated every n clock as follows: Qk1( n) Qk (n ) g 0Q0 (n) g1Q1 (n) ... g k 1Qk 1 (n) with n 0,1, 2,...
(3)
represents ‘exclusive or’, g [ g 0 g1 ... g k 1 ] is the tap sequence of the primitive polynomial generator, and Q0 , Q1 ,..., Qk 1 are the initial register values of which at least
one is non zero. The perturbation begins at n= 0, and the next ones occur periodically every iterations ( is a positive integer), with n= l , l=1,2,…, The perturbed sequence is given by the equation (4): F [ xi ( n 1)] xi ( n ) F [ xi ( n 1)] Q N i ( n )
1 i N k N k 1 i N
(5)
where is a positive integer. The lower bound of the system cycle length is
Tmin 2k 1 .
In this section, we present the studied permutation methods: Grp, Cross and Socek. This paper compares these methods when they are controlled by PWLCM and the perturbed PWLCM chaotic map. The chaotic value x(i) is in the interval [0, 1[ (see eq. (1)). Then, a discretization method is applied to transform it to unsigned integer on 32 bits using the following formulas:
y(i) round( x(i).232 ) ,
(7)
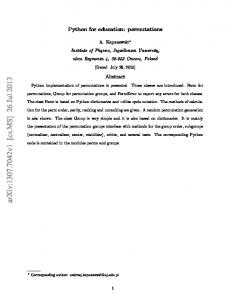
where x(i) is a chaotic real value and y(i) is the discretized one. round function (instead of floor and ceil) insures the minimal degradation of the chaotic map. The advantage of this function is discussed in [11]. The proposed perturbation technique is then applied on the digital chaotic value y(i) that is subsequently used to control the following three permutation methods. A. Grp permutation The Grp permutation method [4-6] is defined as follows: R3=Grp( R1, R2) R1 is the source array or the original block, R2 is the configuration array and R3 is the destination array for the permuted bits. As we said, we propose to control this method by chaotic values. Then, in each iteration, the control array R2 is filled by a chaotic binary suite (8 bits). But, the digital chaotic value y(i) is on 32 bits. Consequently, we need to generate the chaotic value once every four iterations. Then, the 32 chaotic bits are divided into four parts. Thus, each chaotic byte ca be used to control the permutation of a byte from the image (bits of R1). The basic idea of the Grp instruction is to divide the bits in the source R1 into two groups according to the bits in R2. For each bit in R1, we check the corresponding bit in R2. If the bit in R2 is 0, we move this bit from R1 into the first group. Otherwise, we put this bit into the second group (see Fig.1).
(4)
Where F [ xi (n)] represents the ith bit of F [ x(n )] . The perturbation is applied on the last k bits of F [ x(n )] . When n l , no perturbation occurs, so x (n ) F [ x (n 1)] . The system cycle length is given by the following relation T 2k 1 ,
III. CHAOTIC PERMUTATION METHODS
(6)
Fig. 1. The Grp permutation method performed on 8 bits
B. Cross permutation The Cross method is based on the Benes network, which is formed by connecting two butterfly networks of the same size back-to-back [5]. Cross instruction is defined as follows: R3=Cross( m1, m2, R1, R2) R1 is the source array which contains the bits to be permuted, R2 is the configuration array and R3 is the destination array for the permuted bits. Cross instruction
ISBN: 978-988-17012-9-9 ISSN: 2078-0958 (Print); ISSN: 2078-0966 (Online)
WCE 2010
Proceedings of the World Congress on Engineering 2010 Vol I WCE 2010, June 30 - July 2, 2010, London, U.K.
performs two basic operations on the source according to the contents of the configuration array R2 and the values of m1 and m2. Fig. 2 shows an example of Cross instruction working on 8-bit systems. Similarly to Grp technique explained above, we propose to fill the control array R2 by chaotic bits to enhance the security of the permuted images.
PWLCM, are implemented in Matlab. Their performances are then compared through several indicators.
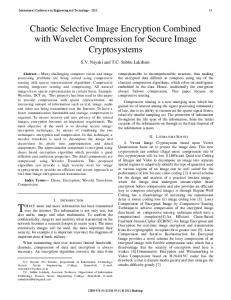
Fig. 4. Mandrill image
Fig. 2. The Cross permutation method performed on 8-bit
C. Socek permutation The permutation method proposed by Socek [7] is a computational approach of degree 8. It permutes the indices of bits of each pixel using the chaotic value. These indices are placed in an array p= [1, 2, 3, 4, 5, 6, 7, 8] and we have then to permute the elements of this array using the chaotic value. Then, the bits are rearranged according to the permuted indices of the new array q. Fig. 3 presents an example of Socek method applied on 8 bits. In this case, the obtained new array of indices is q=[4, 6, 7, 1, 3, 8, 2, 5]. [ b1, b2, b3, b4, b5, b6, b7, b8]
A. Difference between the original and the permuted images Common measures like NPCR (Number of Pixels Change Rate) and UACI (Unified Average Changing Intensity) are used to test the difference between the original image P1 and the permuted one C1. NPCR stands for the number of pixel change rate. Then, if D is a matrix with the same size as images P1 and C1, D (i,j) is determined as follows:
M 1 N 1
D(i, j ) NPCR
i 0 j 0
(9)
100
M N
where M and N are the width and height of P1 and C1. The UACI measures the normalized mean difference rate between the plain image and the permuted one. UACI is defined by the following formula:
[ b4, b6, b7, b1, b3, b8, b2, b5] In this method, a transformation to binary format is not needed. We just use the perturbed digital chaotic value limited by 8! (because we permute 8 bits) to perform the permutation of each original block (byte). In the original method, Socek used PWLCM as control map instead of logistic map. In this paper, we compare the performance of his proposition and the permutation method controlled by the perturbed PWLCM.
(8)
else
NPCR is defined by the following formula:
UACI
Fig. 3. Socek method applied on 8 bits
if P1 (i, j ) C1 (i, j )
1 D(i , j ) 0
1 MxN
M 1 N 1
i 0 j 0
P1 (i, j ) C1 (i, j ) 255
x100 .
(10)
Table I and II summarize the mean values of NPCR and UACI obtained between the original image and the permuted one when the three color components are considered. The permutation methods are controlled respectively by PWLCM (Table I) and the perturbed PWLCM (Table II ). Table I. Mean values of NPCR and UACI between the original image and the permuted one, using PWLCM as control map. PWLCM
IV. SIMULATION RESULTS Experimental results are given in this section to demonstrate the efficiency of the proposed chaotic permutation methods. Mandrill color image (Fig. 4) of size 512*512*3 is used as the plain image. Grp, Cross and Socek methods, controlled by the PWLCM and the perturbed ISBN: 978-988-17012-9-9 ISSN: 2078-0958 (Print); ISSN: 2078-0966 (Online)
Grp
Cross
Socek
NPCR
79.508
87.655
99.569
UACI
19.176
21.685
29.106
WCE 2010
Proceedings of the World Congress on Engineering 2010 Vol I WCE 2010, June 30 - July 2, 2010, London, U.K. Table II. Mean values of NPCR and UACI between the original image and the permuted one, using perturbed PWLCM as control map.
Table III. Mean values of the correlation coefficients of intra-component of original and permuted images, using PWLCM as control map.
Perturbed PWLCM Grp
Cross
Socek method, presents a lower average correlation coefficient of 12% compared to that obtained with PWLCM.
Mandrill image
Correlation NPCR
76.984
80.992
98.520
UACI
18.216
20.025
27.139
First, the comparison of NPCR mean values shows that Socek method is better than Cross and Grp methods whatever the used chaotic map. It can also be seen that the chaotic maps present high performance for the three permutation methods with at least 77% of changed pixels. The comparison of UACI mean values leads to the same conclusion. Socek method is better than Grp and Cross methods and the chaotic maps performance remain similar even if an error rate slightly higher is observed with the original PWLCM.
D( P1 )
cov(P1, C1)
1 MxN
M
1 MxN
M
N
P (i, j )
(11)
1
i 1 j 1
Socek
0.1911
0.0717
0.0259
0.0171
0.0883
0.0308
0.0120
0.0066
0.0948
0.0572
0.0196
0.0152
Mean value
0,1247
0.0532
0.0192
0.0130
Table IV. Mean values of the correlation coefficients of intra-component of permuted images, using perturbed PWLCM as control map.
Correlation Grp
Cross
Socek
Red (R) component Correlation Green (G) component Correlation Blue (B) component Correlation
0.0458
0.0243
0.0155
0.0164
0.0110
0.0055
0.0356
0.0178
0.0138
Mean value
0.0326
0.0177
0.0116
N
[ P (i, j ) E( P (i, j ))] 1
2
1
(12)
i 1 j 1
N
[P(i, j) E(P (i, j))][C (i, j) E(C (i, j))] 1
Cross
Permuted image using perturbed PWLCM to control
To quantify the dependence between two images, Pearson’s correlation coefficient is commonly used. Given by eq. 14, this coefficient is obtained by dividing the covariance between the two images (eq. 13) by the product of their standard deviations (eq. 12 and eq. 11). E in eq.11 is the expected value operator. P1(i,j) and C1(i,j) are respectively the pixels gray values of the first and the second images. M
Grp Red (R) component Correlation Green (G) component Correlation Blue (B) component Correlation
B. Correlation coefficients of intra and inter - color components
1 E ( x) MxN
Permuted image using PWLCM to control
Socek
1
1
1
(13)
Results in Tables V and VI are similar to those in Table III and IV and the same conclusions can then be formulated. Table V. Inter-components correlation coefficients of original and permuted images, using PWLCM as control map.
i 1 j 1
rP1C1
cov( P1 , C1 ) D ( P1 ) D (C1 )
(14)
Tables III, IV, V and VI give the correlation coefficients of intra and inter–color-components of original and permuted images using respectively PWLCM and the perturbed PWLCM as control maps. It can be seen that the use of chaotic maps reduces significantly (by a factor of 6 at least for Socek mathod) the intra-component correlation coefficients which are already low. It can also be seen that Socek method remains better than Grp and Cross methods in all cases. Finally, one can notice that the proposed perturbed PWLCM associated with ISBN: 978-988-17012-9-9 ISSN: 2078-0958 (Print); ISSN: 2078-0966 (Online)
Correlation
Correlation between R and G Correlation between G and B Correlation between B and R
Mandrill image
Permuted image using PWLCM to control Grp
Cross
Socek
0.3565
0.2776
0.1925
0.1280
0.8074
0.3722
0.2453
0.0684
0.1237
0.0571
0.0491
0.0161
WCE 2010
Proceedings of the World Congress on Engineering 2010 Vol I WCE 2010, June 30 - July 2, 2010, London, U.K. Table VI. Inter-components correlation coefficients of permuted images, using perturbed PWLCM as control map.
300
300
250
Permuted image using perturbed PWLCM to control
Correlation
Grp
Cross
Socek
Correlation between R and G
0.1621
0.1147
0.0703
Correlation between G and B
0.2490
0.1893
0.0591
Correlation between B and R
0.0506
0.0484
0.0088
250
200
200
150
150
100
100
50
50
0
0
0
50
100
150
200
250
300
250
1600 1400 1200 1000 800 600 400 200 0 -50
0
50
100
150
100
2000
250
250
200
200
150
150
100
1400 1200 1000
800
800
600
600
400
400 200
0
50
100
150
200
250
300
0
50
0
50
100
150
(b)
200
250
300
0
2000
2000
1800
1800
1600
1600
1400
1400
1200
1200
1000
1000
800
800
600
600
400
400
0 -50 0
50
100
150
0
50
200
250
300
100
150
200
250
300
200
250
300
(c)
200
200 50
0 -50
(b)
100
300
1600
300
(a) 300
250
1800
1000
0 -50
300
200
2000
200
50
150
(a)
1200
250
300
1800
200
200
250
2000
1400
150
200
D. Histogram analysis An image-histogram illustrates how pixels in an image are distributed by graphing the number of pixels at each color intensity level. We have calculated and analyzed the histograms of the permuted images as well as the original colored image. Fig. 6 shows the histogram of the Red component of the original image and the permuted images by Grp and Socek methods using PWLCM and the perturbed map. Similar results are obtained for Cross method.
1600
100
150
(e)
1800
300
50
100
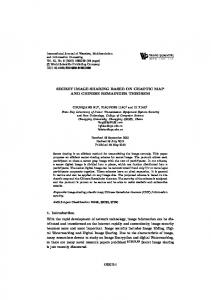
It is clear from Fig. 5 that there is negligible correlation between the two adjacent pixels in the images permuted with methods controlled by the perturbed map.
C. Distribution of two adjacent pixels Statistical analysis on large amounts of images shows that on average, 8 to 16 adjacent pixels are correlated. In this section, some simulations are carried out to test the correlation distribution between two horizontally, vertically and diagonally adjacent pixels, in the original and permuted images. Fig. 5 shows the correlation distribution of two vertically adjacent pixels in the first component of the original image and the permuted images by Cross and Socek methods. Similar results are obtained for Grp method. Firstly, we randomly select 250000 pairs of two adjacent pixels from the image. Then, we plot the pixel value on location (x,y+1) over the pixel value on location (x, y).
0
50
Fig. 5. Distribution of two vertically adjacent pixels in (a) the original image and in the permuted images: using Cross controlled by (b) PWLCM and (c) perturbed PWLCM and Socek method controlled by (d) PWLCM and (e) perturbed PWLCM.
However, what is interesting to note in this case is the significant reduction of correlation coefficients. This reduction ranges from 80% to 92% when Socek method is controlled by the proposed perturbed PWLCM while it ranges from 64% to 91% with the original PWLCM. This gain, which reflects the effectiveness of the proposed chaotic map, is even more stupefying that PWLCM presents higher NPCR and UACI (see Tables I and II).
0
0
(d)
0
50
100
150
(d)
200
250
300
0 -50
0
50
100
150
(e)
(c) Fig. 6. Histogram of the first component of (a) Mandrill image and the permuted images: using Grp controlled by (b) PWLCM and (c) perturbed PWLCM and Socek method controlled by (d) PWLCM and (e) perturbed PWLCM.
ISBN: 978-988-17012-9-9 ISSN: 2078-0958 (Print); ISSN: 2078-0966 (Online)
WCE 2010
Proceedings of the World Congress on Engineering 2010 Vol I WCE 2010, June 30 - July 2, 2010, London, U.K.
As we can see, the histograms of the permuted images are significantly different from that of the original image. Moreover, one can observe that the perturbed PWLCM chaotic map improves the uniformity of the histogram for all permutation methods. Better results are obtained when the proposed perturbed PWLCM is associated with Socek method. E. Information entropy analysis Entropy is a statistical measure of randomness that can be used to characterize the texture of an image. It is well known that the entropy H(m) of a message source m can be calculated as :
observed between the previous and the proposed chaotic maps even if an error rate slightly higher is observed with the original PWLCM. When correlation coefficients are considered, the proposed chaotic map presents higher performance with lower intra and inter-components correlation coefficients. However, with an entropy value which is also improved, the proposed permutation technique is more secure and suitable for chaotic image encryption schemes. Finally, this study allows choosing an efficient permutation method to construct a chaotic cryptosystem with good cryptographic properties.
REFERENCES
N
2 1
H m
p m log i
i0
2
1 p mi
(15)
[1]
[2]
Where p(mi ) represents the probability of message mi . [3]
When an image is encrypted, its entropy should ideally be 8. If it is less than this value, there exists a certain degree of predictability which threatens its security. Tables VII and VIII list the mean entropy values obtained for the original image and the permuted one when the three color components are considered.
[4]
[5] [6]
Table VII. Entropy value for the permuted images using PWLCM. [7]
PWLCM Original Image
Entropy
7.762
[8]
Grp
Cross
Socek
7.862
7.881
7.888
[9]
[10]
Table VIII. Entropy value for the permuted images using perturbed PWLCM. [11] Perturbed PWLCM
Entropy
Grp
Cross
Socek
7.906
7.913
7.950
G. Millérioux, J. M. Amigo, J. Daafouz, “A connection between chaotic and conventional cryptography,” IEEE Trans. Circuits and Systems, vol. 55, no. 6, pp. 1695-1703, Jul. 2008. G. Alvarez, S. Li, “Some Basic Cryptographic Requirements for Chaos Based Cryptosystems,” International Journal of Bifurcation and Chaos, vol. 16, no. 8, pp. 2129-2151, 2006. S. E. Borujeni, M. Eshghi1, “Chaotic Image Encryption Design Using Tompkins-Paige Algorithm,” Hindawi Publishing Corporation, Mathematical Problems in Engineering, Article ID 762652, 22 pages, 2009. Z. Shi, R. Lee, "Bit Permutation Instructions for Accelerating Software Cryptography," IEEE, Application-specific Systems, Architectures and Processors, pp. 138-148, 2000. R. B. Lee, Z. Shi, X. Yang, “Efficient Permutation Instructions for Fast Software Cryptography,” IEEE Micro, vol. 21, no. 6, pp. 56-69, 2001. Y. Hilewitz, Z. J. Shi, R. B. Lee, “Comparing Fast Implementations of Bit Permutation Instruction,” IEEE, Signals Systems and Computers, vol.2, 1856 – 1863, 2004. D. Socek, S. Li, S. S. Magliveras, B. Furht, “Enhanced 1-D Chaotic Key Based Algorithm for Image Encryption,” IEEE, Security and Privacy for Emerging Areas in Communications Networks, 2005. A. Awad, S. E. Assad, Q. Wang, C. Vlădeanu, B. Bakhache, “Comparative Study of 1-D Chaotic Generators for Digital Data Encryption,” IAENG International Journal of Computer Science, vol. 35, no. 4, pp. 483-488,2008. A. Awad, S. E. Assad, D. Carragata, “A Robust Cryptosystem Based Chaos for Secure Data,” IEEE, Image/Video Communications over fixed and mobile networks, Bilbao Spain, 2008. T. Yang, C. W. Wu, L. O. Chua, “Cryptography Based on Chaotic Systems,” IEEE Trans. Circuits and Systems, vol. 44, no. 5, pp. 469–472, 1997. G. Chen, X. Mou, S. Li, "On the Dynamical Degradation of Digital Piecewise Linear Choatic Maps," International Journal of Bifurcation and Chaos, vol. 15, no 10, pp. 3119-3151, 2005.
The obtained results are very close to the theoretical value. This means that information leakage in the permutation process is negligible. V. CONCLUSION A novel chaotic permutation technique is presented in this paper. It uses a previous chaotic map (PWLCM) and is designed to reach a higher security level. To test its efficiency, the performances of three well known bit-permutation methods controlled by PWLCM are compared with their performances when the new chaotic map is used. In terms of NPCR and UACI, similar behavior is ISBN: 978-988-17012-9-9 ISSN: 2078-0958 (Print); ISSN: 2078-0966 (Online)
WCE 2010