myjournal manuscript No. (will be inserted by the editor)
Efficient data selection for ASR Neil Taylor Kleynhans · Etienne Barnard
Received: August 4, 2014/ Accepted: August 4, 2014
Abstract Automatic speech recognition (ASR) technology has matured over the past few decades and has made significant impacts in a variety of fields, from assistive technologies to commercial products. However, ASR system development is a resource intensive activity and requires language resources in the form of text annotated audio recordings and pronunciation dictionaries. Unfortunately, many languages found in the developing world fall into the resource-scarce category and due to this resource scarcity the deployment of ASR systems in the developing world is severely inhibited. One approach to assist with resource-scarce ASR system development, is to select “useful” training samples which could reduce the resources needed to collect new corpora. In this work, we propose a new data selection framework which can be used to design a speech recognition corpus. We show for limited data sets, independent of language and bandwidth, the most effective strategy for data selection is frequencymatched selection and that the widely-used maximum entropy methods generally produced the least promising results. In our model, the frequency-matched selection method corresponds to a logarithmic relationship between accuracy and N. T. Kleynhans CSIR, Meraka Institute, HLT group & North-West University CSIR Site - Building 43 Meiring Naude Road Brummeria Pretoria South Africa Tel.: +27-12-8414264 Fax: +27-12-8414720 E-mail:
[email protected] E. Barnard MuST group & North-West University Vaal Triangle Campus Van Eck Blvd Vanderbijlpark 1900 Tel.: +27-16-910-3111 Fax: +27-16-910-3116 E-mail:
[email protected]
2
Neil Taylor Kleynhans, Etienne Barnard
corpus size; we also investigated other model relationships, and found that a hyperbolic relationship (as suggested from simple asymptotic arguments in learning theory) may lead to somewhat better performance under certain conditions. Keywords Resource-scarce · Data selection · Corpus design · Speech recognition
1 Introduction Speech technologies are playing an increasingly important role in the daily lives of many people. For instance, applications such as Google Voice Search (Erol et al, 2009) performing spoken web searches, telephone services using Automatic Speech Recognition (ASR) to acquire account information (Rabiner, 1997), access control systems utilising speaker recognition in a host of security checks (Reynolds, 2001) and multi-lingual spoken dialogue systems employing Spoken Language Identification (SLID) (Navratil, 2001) have all made significant contributions to the technology landscape. In some cases, these types of systems can perform their related tasks many times more cost efficiently than humans, and for limited domain applications even achieve performance levels exceeding that of humans. Given the variety of speech-based applications, it is generally the case that an ASR system serves as the foundation whereupon applications are built and specialized. Although ASR technologies have matured over recent years, ASR development is still a resource intensive process. The process often requires large volumes of language resources such as annotated audio corpora and pronunciation dictionaries. This large initial resource requirement places a constraint on the development of ASR systems in the developing world, where most languages are subject to a scarcity of resources and are often termed resource-scarce. There are many approaches which can be followed to improve this situation and support ASR deployment in the developing world. We suggest, however, that there are three main domains which could contribute to significant progress in promoting speech-based applications in the developing world – these are: – Data harvesting – creating ASR corpora by harvesting readily available speech resources. – Rapid ASR system adaptation – rapidly adapting existing ASR system to new applications. – Training data selection – designing ASR corpora by making use of data selection methods to optimally select training examples which optimize the trade-off between required resources and ASR system accuracy. To our mind, the data harvesting and ASR adaptation domains have received significant research focus but data selection, specifically for ASR corpora design, has not received as much focus. Thus, for the work presented here we limit our investigation to data selection for ASR corpus design. A general ASR tenet is that the training of robust acoustic models, to achieve high system accuracies, requires large training corpora. The reasoning is the following: to cover the variability present in speech, many training examples are needed to properly estimate the model parameters. However, for a resource-scarce language such corpora are generally not readily available, which often necessitates the creation of a larger corpus by sourcing data from smaller similar corpora. In
Efficient data selection for ASR
3
addition, it has been shown by (Wu et al, 2007) that large corpora contain redundant information which implies that a smaller sub-corpus can be created which contains sufficient examples to cover the variability. We therefore intend to answer the following question: if it is feasible to collect a limited amount of data with a focused corpus design, which data should be selected to aid in the collection or design efficiency?
2 Background Current state-of-the-art speech recognition systems use HMMs to model speech acoustic event sequences. The models capture statistical information, which relates the observed acoustic event sequences to hidden unit sequences such as words or phones as well as temporal acoustic event structure. The statistical modelling by the HMM makes it reliant on the observed data. It is generally assumed that large amounts of audio data are needed to train truly robust acoustic models. But as more data is added to large training sets, the observed gains in accuracy tend to become smaller, which implies that the data contains redundant information (Wu et al, 2007; Moore, 2003). Moore (2003) showed that, for HMM-based ASR systems, there is a linear relationship between the word error rate (WER) and the logarithm of the training data amount. In addition, different experimental configurations influence the starting WER but not the slope of WER decreases across training data amount. Based on the results, it would seem to show that the vocabulary and language model used during the recognition phase play an important role in determining the starting WER. Thus, the question on enough data really depends at which WER level you would want to operate the ASR system and the constraints on the resource investment. Using linear extrapolation Moore (2003) showed hypothetically, that for a particular ASR system, training data in the range of 3,000,0000 – 10,000,000 hours would produce an effective WER of 0 %. Similarly, an ASR using another configuration would require 600,000 – 800,000 hours of speech data to achieve a 0% WER. Collecting such data amounts does seem impractical and due to the logarithmic relationship between training data amount and WER, simply adding more and more data does not seem to be a plausible solution when trying to achieve lower WERs. Wu, Zhang, and Rudnicky (2007) have shown, however, that it is possible to select a smaller sub-corpus from a large corpus and train ASR models which provide performance comparable to that of models train on all the data. Thus, with proper data selection, a sub-corpus can be created which contains sufficient data variation to produce robust ASR models. In their work, Wu, Zhang, and Rudnicky (2007) proposed a maximum entropy principle data selection algorithm that would select a sample of the data from a larger corpus, which was motivated to reduce training time, but still provide robust ASR acoustic models. Their selection criteria were based on sampling the data to create a corpus which approximately contained uniform counts for either words, words plus characters or words plus phones. The greedy selection algorithm was employed to select the units and used a maximum entropy principle to guide the selection. Wu, Zhang, and Rudnicky (2007) argued that this type of data selection produced an optimal acoustic model training approach. Their results showed for 150 hours of data the random selection obtained 25 % error rate while the uniform word plus phone selection achieved an
4
Neil Taylor Kleynhans, Etienne Barnard
error rate of 24.4 %. Interestingly, training on 840 hours only achieved an error rate of 24.3 %. They also showed that selecting by word distributions at 30, 50, and 100 hour training data intervals, the maximum entropy selection performed on average better than a random selection. An important concept for corpus design is coverage, highlighted by Santen and Buchsbaum (1997), which plays a large role in determining the corpus suitability for specific ASR applications. An ASR system will perform poorly if the training and testing unit distributions are vastly different – for instance training a digit recognition system to perform a proper name recognition task. The impact of unit distribution dissimilarity can be overcome if one limits the training and evaluation sets to be extracted from the same data source. It is to be expected that the training and evaluation distributions should tend to be similar given large data amounts. But if this is not possible a selection process is needed to reduce the unit distribution differences. As highlighted in (Santen and Buchsbaum, 1997), two possible selection criteria are to (1) cover all units or (2) base the coverage on unit frequencies. Each has associated weaknesses: for full unit coverage, it becomes difficult to limit the total size of the corpus while trying to include all rare units, and for selection based on unit frequencies, unit frequencies for sub-domain texts are typically quite varied. Assuming one has a target unit distribution, Gouvˆea and Davel (2011) showed the importance of matching the training and evaluation distributions and that a regularised KL-divergence metric is an effective data selection tool. In their ASRspecific experiments, they designed a few target n-gram distributions (representing target domains) by randomly selecting utterances from an evaluation dataset. To generate a target n-gram distribution 500 utterances were selected evaluation dataset that had similar n-gram distributions to the target. ASR systems were developed on a 1000 utterances that were selected from a training dataset using one of three selection criteria: (1) selecting to match the target distribution, (2) uniform n-gram selection, and, (3) random selection. In addition, regularised KLdivergence selection was performed on unigrams and trigrams. Their results showed that the targeted distribution ASR systems performed better compared to random and uniform selection and interestingly, the random selection performed better than the uniform selection. Lastly, the trigram selection proved a better choice compared to unigram selection.
3 Aim As summarized in the previous section, Moore (2003) found that there is a logarithmic relationship between WER and training data amount, which implies that simply adding data at random is a slow method of increasing ASR system performance and theoretically vast amounts data are needed to drastically reduce the WER. Wu, Zhang, and Rudnicky (2007) showed that it is possible to select a subset of the data to achieve ASR performance comparable to using all the data. A uniform selection criterion (maximum entropy principle) can in some cases enable ASR system performance comparable to that of systems trained on much larger datasets. However, the uniform selection criterion is somewhat ad-hoc: it does not take the data’s unit distributions into account and does not work in all situations (as shown in (Gouvˆea and Davel, 2011)). It is therefore doubtful that the training
Efficient data selection for ASR
5
strategy proposed in (Wu et al, 2007) produces an optimal system performance in general. Lastly, if one had access to a target unit distribution, the KL-divergence metric could be used to select utterances from a larger corpus and create a training distribution which matches the testing distribution (Gouvˆea and Davel, 2011). In practice, however, the test distribution is not known or is specialized to a specific task which will not generalize well. One aspect, however, shared by all ASR systems and independent of ASR configuration, is the relationship between the occurrence of training units in a training data set and the accuracy the unit achieves in the final evaluation. To our knowledge no-one has based the selection criteria on the relationship between units’ accuracies and their occurrence in the training data. From this, the goal of our research is to – Develop a theoretical framework which guides a unit selection process based on the relationship between the number of training occurrences and resulting accuracy with the goal of improving the final ASR performance. – Create an implementation of the theory for validation purposes. Thus the novelty of this work is to introduce an approach in which the selection criterion is based on unit accuracies given the number of training examples, rather than an approximation of the full-data statistics. The investigation will hopefully help make clearer, whether it is possible to develop a data selection strategy that selects a targeted dataset which maximises ASR system accuracy. The main purpose of our work is corpus design. Creating a corpus from scratch is a resource-intensive process, including such tasks as prompt design, data collection, validation, packaging and logistical management. Using data selection criteria to improve ASR accuracy, can improve the effectiveness of the corpus design and contribute to efficient data collection which is a necessity in resource constrained environments. The ultimate goal is to provide a framework which can minimise the amount of data that is required to obtain a specified level of accuracy, in order to make the creation of speech corpora in under-resourced languages as efficient as possible. However, for our initial investigation into optimal data selection we will limit ourselves to the evaluation of proposed techniques on existing corpora to establish the validity of the theory and implementation. Section (4) describes the theoretical framework and implementation strategy. The experimental corpora and setup are described in section (5). Our results are provided in section (6) and final remarks are captured in section (8).
4 Framework The fundamental modelling unit for current ASR systems are tied-state triphones. Preliminary correlation investigations showed triphones are a good candidate unit to model an ASR system’s performance since: – a strong non-linear correlation exists between a triphone’s accuracy and the number of times the triphone occurred in the training data, and, – there is a weak to low correlation between adjacent triphones accuracies. The weak to low correlation between adjacent triphones accuracies could be taken into account for improved modelling, but for the development of our approach
6
Neil Taylor Kleynhans, Etienne Barnard
we assume triphone accuracy independence which should not severely impact the triphone accuracy modelling. A last simplification made to the modelling process is to ignore the non-linear effects of state-tying by treating the triphones as distinct units and deriving the triphone counts from the training data. Given our background investigation, the starting point of our approach is to presume that the overall ASR system performance is related to the triphone recognition accuracy – words are recognised from monophone sequences and monophone sequences are extracted from recognised triphone sequences. Thus, word accuracies are related to monophone accuracies which are related to triphone accuracies. Therefore, our first assumption is that the overall ASR system’s accuracy is related to the individual triphone accuracies. Secondly, we assume that a triphone’s accuracy is primarily determined by the number of times it occurs in the training data only and for the scope of this work we ignore adjacency effects. Given these two assumptions, we can mathematically formulate the overall system performance as, Atotal =
N X
pi Ai (ni ),
(1)
i=1
where Atotal is the overall system accuracy, pi is the probability of occurrence for triphone i and Ai is the ith triphone accuracy dependent on the occurrence count. Thus, equation (1) states that the overall system accuracy is given by the sum over all individual triphone accuracies multiplied by the probabilities of their occurrence. When collecting data in resource-scarce environments, there are limited resources with which to collect data. Thus, the collected corpus will contain a limited amount of data determined by the resource investment. Therefore, to represent this resource constraint we introduce a corpus design constraint, which limits the total triphone count to a specified number. To enforce this constraint, we introduce a Lagrange multiplier into equation (1) and rewrite it as, Atotal =
ND X
ND X
pi Ai (ni ) + λ(
ni − N ),
(2)
i=1
i=1
where λ is the Lagrange multiplier, ni is the ith triphone count, N is the total triphone count in the training corpus and ND is total number of distinct triphones. Given our equation that describes the ASR system accuracy we would like to find the optimal assignment of triphone training counts which improves the ASR system’s accuracy. In order to find the optimal triphone counts, we need to calculate the first derivative of equation (2) and set it equal to zero, ∂Atotal = 0, ∂ni
(3)
which will provide the optimal assignment of the triphone counts and maximise the overall system accuracy Atotal . Working through the derivation we obtain, ∂Ai (ni ) ∂Atotal = pi + λ, ∂ni ∂ni
(4)
i (ni ) where pi is the probability of triphone occurring, ∂A∂n is the derivative of i an individual triphone accuracy with respect to P its training count and λ is the ∂Ai (ni ) D and λ are Lagrange multiplier introduced by the constraint N i=1 ni = N . ∂ni unknown and need to be calculated.
Efficient data selection for ASR
7
Once these values have been calculated it becomes an easy task to solve for the triphone counts ni . The most difficult part in solving the above equation (4) is finding a suitable expression for the individual triphone accuracies Ai (ni ). Given that we have to calculate the derivative of Ai (ni ), it would be convenient to find a suitable functional form which would avoid the use of numerical derivative techniques.
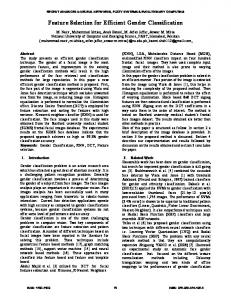
4.1 Selecting an accuracy function In the previous section we have derived an expression for the optimal number of triphones to include in a corpus in order to maximise an ASR system’s accuracy, summarized in equation (4). To solve for the optimal triphone count we must have a suitable triphone accuracy function which relates an individual triphone’s accuracies to the number of times the triphone occurred in the training set. Here, we consider two theoretical distributions as well as two empirical distributions, and select a compromise that will allow us to investigate the potential of our approach. – There are simple arguments from learning theory (Barnard, 1994) that suggest an asymptotic functional relationship of the form Ai (ni ) = B −
C , ni
(5)
with B and C again problem-specific and algorithm-specific parameters, and with the relationship only expected to be valid for large ni . Figure 1 shows a plot of equation (5) which relates triphone accuracy to triphone count and where we have assigned the values B = 100, C = 1000. As expected, a triphone’s accuracy is initially low but increases rapidly as more data is added, reaching a plateau when ni reaches the same order of magnitude as C. This roughly coincides with ASR systems’ behaviour which generally shows a benefit when data amount is steadily increased but eventually the observed improvement diminishes. Using equation (4), substituting the derivative of equation (5) and setting the results to zero we can rearrange the equation to obtain an expression for the triphone counts ni . The steps followed are, ∂Atotal pi C = 2 + λ, ∂ni ni
(6)
pi C + λ = 0, n2i
(7)
r
(8)
ni =
pi C . −λ
It would be more convenient to calculate the triphone prior which will give us a way of calculating the triphone counts independently of data size. Thus, we can rewrite the triphone counts as a function of the total triphone count as ni = qi N . Substituting this expression into equation (8), we obtain an expression for the triphone prior,
8
Neil Taylor Kleynhans, Etienne Barnard Triphone Accuracy versus Triphone Count 100 90 80
Triphone Accuracy (%)
70 60 50 40 30 20 10 0 0
100
200
300
400
500 600 Triphone Count
700
800
900
1000
Fig. 1 The hypothetical asymptotic accuracy function which describes the triphone accuracy given the triphone count.
r
pi C , −λ √ qi = K pi ,
qi N =
where K =
1 N
q
C −λ .
(9) (10)
To solve for the prior qi , which will be the optimal prior
D set, we use the constraint that the sum of the prior must equal 1, N i=1 qi = 1 P 1, which implies that K = . Finally, given the values of the initial ND √ i=1
pi
P
training set triphone prior, we can calculate the optimal prior by taking the square root of the initial priors and then normalising their values such that they sum to equal one. – On the other hand, Moore (2003) produced a variety of evidence showing a logarithmic relationship between the WER and the total amount of data used to train an ASR system. If we assume that the same trend holds for individual triphone accuracies, we obtain a relationship of the form Ai (ni ) = B + C log ni ,
(11)
with B and C parameters that describe the details of the logarithmic improvements suggested by Moore. Following the same steps as above, we find that this assumption requires that qi = pi
(12)
in order to optimize ASR accuracy. Thus, these two functional forms lead to data-selection approaches that range between “natural” selection (i.e. the selected triphone frequencies should match those that occur in the reference data) to “compressed” selection, where the selected frequencies are proportional to the square root of the occurrence frequencies. Which of these forms is most appropriate for speech data is an empirical question, and we investigate evidence from a few widely-studied corpora below.
Efficient data selection for ASR
9
4.2 Triphone accuracy function: empirical evidence In order to gain a better understanding of the relationship between accuracy and frequency, triphone accuracies were measured for the WSJ (Paul and Baker, 1992) and BN corpora (Graff et al, 1997). The ASR system configuration is detailed in section (5.5). Triphone accuracies were calculated from deletion and insertion balanced phone-level recognition outputs. The BN-trained system was used to recognise all the WSJ data and similarly the WSJ-trained system was used to recognise all the BN audio data. The phone outputs were expanded to triphones and all silence models were removed – silence and short-pause. The alignments had to be processed further by altering triphone contexts around silence markers which did not occur at the start and end of an utterance. This involved removing the silence markers from the triphone name and inserting the appropriate phone name. To calculate the triphone accuracies, a pooling strategy was used with all alignment being ignored. If a triphone was found in the reference and recognition outputs then the triphone was counted as correct. All triphones not common to both outputs were marked as incorrect. To calculate the final triphone accuracy, the final correct accumulators were divided by the sum of the final total and final error accumulators for a specific triphone. Figure 2 (A) shows the average triphone accuracy as a function of triphone training occurrence estimated using a BN trained ASR system and recognising WSJ data, and figure 2 (B) shows the number of distinct triphones used to average the triphone accuracies. Similarly, figure 3 (A) shows the average triphone accuracy as a function of triphone training occurrence estimated using a WSJ trained ASR system and recognising BN data, and figure 3 (B) shows the number of triphones used to average the triphone accuracies. The average triphone accuracy figures (A) both show a logarithmic-style relationship between the triphone accuracy and the number of triphone training examples – ever increasing amounts of data are needed to improve the accuracy. These figures are relatively smooth to triphone counts of around 100, but start to fluctuate after this point. The fluctuation can largely be put down to the limited number of examples that are used to average the accuracies as shown in the (B) figures – the triphones which have high training counts usually only have one example with which to calculate an average accuracy. Hence, factors other than the triphone count (e.g. the inherent variability of a particular triphone) are excessively influential in those accuracies. The triphone accuracy graphs shown in figures 2 (A) and 3 (A) are quite noisy and it is difficult to get a sense of what the underlying trends are above the 100 triphone training count. Therefore, to obtain a set of smooth figures a simple smoothing technique was employed – a moving average filter using 100 samples either side of each data point was used to calculate the smoothed accuracies. Figure 4 shows the smoothed graphs for the triphone accuracies as a function of triphone training count for both the BN and WSJ systems. Besides the artefact at the end of the graphs, where the triphone accuracies decrease, the general trend is a gentle increase in accuracies from counts 1 to about 20, then a rapid increase in accuracies from about 30 to 750 triphone count, and, finally a diminishing of the accuracy improvements above a count of 750. These graphs are roughly compatible with both of the functional forms in the previous section, but in the large-n region, where we would hope to understand their differences in most detail, the graphs are too noisy for useful conclusions
10
Neil Taylor Kleynhans, Etienne Barnard Average BN ASR System Triphone Accuracies (A) Triphone Accuracy
0.7 BN
0.6 0.5 0.4 0.3 0.2 0.1 0 1
10
100 Triphone Training Occurrence
1000
10000
(B) Number Examples
3000 BN
2500 2000 1500 1000 500 0 1
10
100 Triphone Training Occurrence
1000
10000
Fig. 2 Graph (A) shows BN-derived triphone accuracy as a function of triphone training count using the WSJ corpus as an evaluation set. Graph (B) shows the number of examples used to average the triphone accuracies. Average WSJ ASR System Triphone Accuracies (A) Triphone Accuracy
0.7 WSJ
0.6 0.5 0.4 0.3 0.2 0.1 0 1
10
100 1000 Triphone Training Occurrence
10000
100000
Number Examples
(B) 2000 1800 1600 1400 1200 1000 800 600 400 200 0
WSJ
1
10
100 1000 Triphone Training Occurrence
10000
100000
Fig. 3 Graph (A) shows WSJ-derived triphone accuracy as a function of triphone training count using the BN corpus as an evaluation set. Graph (B) shows the number of examples used to average the triphone accuracies.
to be made. Fortunately, we can smoothly change from one form to the other by adjusting the exponent of pi that is proportional to qi : if it is 1.0, we obtain the optimal distribution for the logarithmic relationship, an exponent of 0.5 is optimal for the relationship derived from learning theory, and intermediate values of the exponent presumably correspond to intermediate relationships between accuracy and training count. Thus, we will set qj =
pr
Pi k
prk
,
(13)
Efficient data selection for ASR
11 Triphone Accuracy versus Triphone Training Occurrence
0.4 BN Smooth WSJ Smooth 0.35
Triphone Accuracy
0.3
0.25
0.2
0.15
0.1
0.05 1
10
100 1000 Triphone Training Occurrence
10000
100000
Fig. 4 Smoothed graphs showing triphone accuracy as a function of triphone training count for the BN and WSJ experiments.
where r is the compression factor. To obtain the target total number of training triphones, the compressed and normalised probabilities of occurrence are multiplied by the total target count and rounded to remove fractional components.
4.3 Greedy Unit Selection To select the target triphone count distribution we used a data selection approach similar to the regularised Kullback-Leibler divergence-based data selection proposed by Gouvˆea and Davel (2011). The regularisation is controlled by a userspecified constant. In their approach, the main goal was to select a set number of utterances (N), from a larger dataset (T), to match a target distribution of n-grams. The algorithm initialises a candidate subset by randomly selecting N utterances. For all utterances which are left in dataset T, an utterance (U) is selected and used to substitute, one at a time, all the utterances found in the candidate subset. For each substitution, the change in KL-divergence is measured. Once all possible substitutions have been made for the candidate subset utterances, the substitution which gives the greatest decrease in regularised KL-divergence is made. Our data selection requires selecting a number of utterances which will produce the desired distribution and limit the number of training triphones to a set amount. Thus, we modified the Gouvˆea and Davel (2011) approach in a number of ways. Our algorithm steps are: – Initialisation Stage: The candidate subset is created by randomly selecting utterances and limiting the number of utterances by the number of training triphones instead of a set utterance count. – Main Stage: The main stage of the algorithm implemented an iterative twophase selection process.
12
Neil Taylor Kleynhans, Etienne Barnard
– Phase One Addition: For the first phase, on a per utterance basis, each remaining training set utterance is added to the candidate subset, the KLdivergence measured, and then removed from the candidate subset. The utterance which results in the largest decrease in KL-divergence is added to the candidate subset. – Phase Two Removal : For the second phase, on a per utterance basis, each utterance in the candidate subset is removed, KL-divergence measured and the utterance placed back into the candidate subset. The utterance which results in the largest decrease in KL-divergence is removed. – Correction Phase: The correction phase ensures that the candidate subset has the correct number of target triphones. – If the training triphone count is too high then, utterances are removed from the candidate subset, via Phase Two Removal, until the target count is reached. – If the training triphone count is too low, utterances are added from the training set, via Phase One Addition, until the target count is reached.
5 Experimental Setup This section describes the corpora used in our investigations, data selections and experimental setups.
5.1 Corpora 5.1.1 TIMIT The TIMIT (Fisher et al, 1986) corpus contains read-speech American English high-bandwidth audio recordings. The corpus contains 6300 utterances collected from 630 speakers each contributing 10 utterances. The speakers were selected from eight distinct dialect regions. The corpus has a 70-30 percent male-female gender split. The text prompts consisted of dialect, phonetically-compact and phonetically-diverse sentences. Two dialect sentences were read by all speakers and used to measure dialect differences. The phonetically-compact sentences were designed to cover phonetic pairs and each speaker spoke five sentences with seven speakers reading the same sentences. The phonetically-diverse sentences added phonetic diversity and were selected to maximise allophonic contexts. Each speaker read three phonetically-diverse sentences – unique to the specific speaker. For our TIMIT experiments we removed the sentences read by all speakers, as their high frequency severely biases the corpus distribution and thus biases the results. Table 1 shows statistics for the reduced TIMIT corpus training and evaluation sets.
5.2 Wall Street Journal The Wall Street Journal (WSJ) (Paul and Baker, 1992) corpus is a large American English corpus built to meet a few design criteria. The entire corpus contains a
Efficient data selection for ASR
13
Table 1 TIMIT corpus statistics with the dialect sentences removed. # utterances # speakers Duration (hours)
Training 3696 462 3.14
Evaluation 1344 168 1.15
variety of audio and text, which accommodates various vocabulary sizes, language model perplexities, variable sized speaker-dependent and -independent training data amounts, read and spontaneous speech, verbalised and non-verbalised punctuations and differing recording environments. For our experiments we chose the speaker-independent read-speech training corpus with high-quality recordings, and the 5k vocabulary evaluation corpus. The text prompts were chosen from newspaper text. Similar to TIMIT we removed the speaker adaptation sentences. We only sourced WSJ data from “The Continuous Speech Recognition Wall Street Journal Phase I” corpus. Table 2 shows statistics for the WSJ corpus training and evaluation sets, with the speaker-adaptation utterances removed.
Table 2 WSJ corpus statistics with the speaker-adaptation sentences removed. # utterances # speakers Duration (hours)
Training 8734 101 18.76
Evaluation 1858 8 4.38
5.2.1 Lwazi The Lwazi (Barnard et al, 2009) corpus contains telephone quality recordings and their associated transcriptions covering the eleven official languages of South Africa. The read and elicited speech data was collected from approximately 200 speakers per language with each speaker contributing 30 utterances. A portion of the utterances were randomly selected from a phonetically balanced corpus and the remainder are words or short phrases. For our experiments we limited ourselves to the IsiZulu language spoken by the majority of South Africans. As the corpus does not contain dedicated training and evaluation sets, we split the corpus into ten folds. The folds were created by randomly partitioning the speakers into ten mutually exclusive sub-corpora, which served as the evaluation sets. The training sets were created by cycling through the evaluation folds and assigning all folds to the training set except for the current evaluation fold. Table 3 shows some statistics for the Lwazi IsiZulu sub-corpus by fold.
5.3 Data Selection In section (4.1) we propose that the optimal data selection approach depends on the relationship between the unit’s accuracy and count. To investigate our approach we define three optimal distributions: (1) “natural” selection (based on the
14
Neil Taylor Kleynhans, Etienne Barnard
Table 3 Corpus statistics for the ten randomly selected folds for the IsiZulu Lwazi corpus. Fold 1 2 3 4 5 6 7 8 9 10
# utterances 5189 5229 5189 5196 5228 5203 5213 5197 5203 5218
Training # speakers 179 179 179 179 179 179 179 179 179 180
Duration (hours) 8.29 8.34 8.22 8.14 8.30 8.20 8.23 8.33 8.23 8.32
# utterances 596 556 596 589 557 582 572 588 582 567
Evaluation #speakers Duration (hours) 20 0.88 20 0.84 20 0.95 20 1.03 20 0.88 20 0.97 20 0.94 20 0.84 20 0.94 19 0.86
logarithmic relationship), (2) “compressed” selection (based on learning theory) and (3) a combination of the two (“intermediate”). To produce an optimal distribution for the “natural” selection we choose utterances at random until a specified target total training triphone count was achieved. Throughout this volume “natural” represents a random selection. The optimal “compressed” distribution was created by: – Estimating the triphone counts from a training utterance set. – Calculating the triphone distribution by normalising the sum of the triphone counts to one. – Applying the square-root operator to the triphone probabilities. – Re-normalising the transformed triphone probabilities so that they sum to one. – Multiplying the triphone probabilities by a target training triphone count and further normalising by rounding to the nearest integer. – Using the KL-divergence selection algorithm (see section 4.3) to select the target distribution from the entire training utterance set. To produce the “intermediate” optimal distribution, the steps which produce an optimal “compressed” distribution were followed, except the triphone probabilities are raised to a power of 0.75 instead of applying the square-root operator. It was found that the TIMIT, WSJ and Lwazi training corpora contained many utterance repetitions. Table 4 shows the number of utterances and unique utterances found in the TIMIT, WSJ and Lwazi training sets. Therefore, an additional investigation was performed to determine the effect of estimating the triphone distributions on the unique sentences only but still selecting from all the training utterances to achieve the target training triphone distributions. Table 4 The total number of utterances and unique utterances found in the TIMIT, WSJ and Lwazi training sets. Corpus TIMIT WSJ Lwazi
# utterances 3696 8734 5786
# unique utterances 1731 5028 3917
Lastly, to compare our data selection results with current selection techniques, the maximum entropy principle (max-entropy) selection was also used. We fol-
Efficient data selection for ASR
15
lowed the max-entropy selection algorithm outlined in Wu, Zhang, and Rudnicky (2007) and selected either word or triphone units. Their proposed greedy selection algorithm efficiently selects the required number of utterances by analysing the change in entropy if an utterance is added to the training pool: if the increase is above a certain threshold then the utterance is included in the training set. The chosen threshold determines the final size of the training set. To distinguish amongst the various data selection methods, the following keys will be used henceforth: Natural - “natural” data selection (random) Sqrt - “compressed” data selection 0.75 - “intermediate” data selection MaxEnt Tri - max-entropy selection based on triphone units MaxEnt Wrd - max-entropy selection based on word units Uniq Sqrt - “compressed” data selection using the unique utterance triphone distribution – Uniq 0.75 - “intermediate” data selection using the unique utterance triphone distribution – – – – – –
5.4 Matched-Pairs Significance Test To determine the statistical significance of the performance differences measured, we employed a matched-pairs statistical significance test described by Gillick and Cox (1989). Initially, the speech stream is partitioned into statistically independent segments where the segment can be sentences, speech occurring between speaker pauses or entire utterances. For our purposes we chose the entire utterance as the segments. Next, we count the number of errors, per segment, made by the two i algorithms to be compared, N1or2 , where i is the segment number. In an ASR setup, the error is given by the sum of deletion, insertion and substitution errors. Given the error counts, we define a variable Z i = N1i − N2i , i = 1, 2, ..., n, to be the difference in errors made in a segment and n is the total number of segments. If the algorithms perform similarly, the average difference in the number of errors made in a segment, µz would be close to zero, thus we would like to ascertain whether or not µz = 0. If n is large, we can make the assumption that test statistic will approximately be normally distributed with unit variance. To set up the significance test, we define the null hypothesis as H0 : µz = 0 and the alternative hypothesis is defined as H1 : µz 6= 0. To test the validity of the null hypothesis, we perform a two-tailed test by computing the P-Value. 5.5 ASR systems For all experiments we trained standard HMM-based ASR systems. Three state left-to-right HMMs (beginning and ending non-emitting states not counted) were used to model tied-state cross-word context-dependent triphones. Each HMM state contained eight mixture Gaussian models which modelled the state distributions. The state-tying questions were generated by creating left and right questions for each individual phone. The audio was encoded into Mel-Frequency Cepstral Coefficients (MFCC) vectors using a 25 ms window and shifting the window by 10
16
Neil Taylor Kleynhans, Etienne Barnard
ms after encoding a frame. The MFCC vectors were 39 dimensional and were constructed by appending 13 static, 13 first derivative and 13 second derivative components. Speaker-based Cepstral Mean Normalisation (CMN) was applied to each utterance. This standard HMM-based ASR setup was used throughout our experiments. The acoustic models were trained on audio data sourced either from the training corpus or the relevant cross-validation folds (for the Lwazi IsiZulu corpus).
5.6 Training corpora To test the various data selection approaches, we partitioned the various training corpora into fractional subsets and trained ASR systems on these sub-corpora. The data-selected fractional training sub-corpora were generated by selecting a subset of training utterances which produced a specified percentage of the total number of triphones which made up the entire training set. The percentages used were 20%, 40%, 60%, and 80% e.g if a training corpus contained 100000 training triphones, then four sub-corpora were created that contained roughly 20000, 40000, 60000 and 80000 training triphones. In addition, for the “natural” and max-entropy selections, a growing selection strategy was utilised, which meant that the larger sub-corpora were created by using the previous smaller sub-corpus as a starting point and adding utterances to meet the larger training triphone counts i.e. 80% contains all 60% utterances, 60% contains all 40% utterances and 40% contains all 20% utterances. The TIMIT, WSJ and 10-fold Lwazi corpora training sets will be used to create the various sub-corpora.
5.7 Performance measures The performance of the different ASR systems was measured using the word accuracy (Word Acc %) percentages defined in (Young et al, 2009). To measure the word accuracies, the evaluation sets were recognised using the acoustic models trained on the various data selections. The decoding network was built using a flat word-loop grammar and contained only the words which occurred in the evaluation set. To evaluate the statistical significance of the performance, the matched-pairs significance test was used as described in section (5.4). The “natural” results will serve as reference for the statistical significance tests and a significance level of 0.001 is chosen. The statistical signification values will be converted to common logarithm equivalents, thus the significance level becomes −3 and any value below this indicates a significant result – significant improvements are prepended by an asterisk (*). In addition, all results where an improvement was observed are marked in blue while degradations are marked in red. To verify any improvements brought about by the use of data selection methods were not merely achieved by matching training and evaluation distributions, independent evaluation corpora are used. This will ensure different triphone distributions for the training and evaluation sets. Specifically, the WSJ evaluation set will be used to validate TIMIT data selections, the TIMIT evaluation set will be used to validate WSJ data selections.
Efficient data selection for ASR
17
As our theory makes the assumption that the overall ASR system accuracy is given by a weighted sum of individual triphone accuracies we will also report triphone accuracy values as well as their statistical significance. The triphone results are derived from the word recognition outputs which are expanded to phone-level transcriptions which are further processed to form triphone labels.
6 Results In this section we present data selection results on three significantly different corpora: American English TIMIT, American English WSJ and IsiZulu Lwazi.
6.1 TIMIT Figure 5 shows word accuracies for TIMIT trained and evaluated systems developed using various data selection methods and amounts of training data. Both max-entropy selection methods produce consistently worse performances as compared to the Natural data selection approach. The word-based max-entropy selection, however, performs better compared to the triphone-based max-entropy selection for all data amounts. The remaining data selection methods all achieved higher accuracies except for 0.75 method at 80% – using the Natural as a baseline measure. The Sqrt approach provides slightly higher accuracies compared to the 0.75 across data amounts. The unique variates produce the same trend for the 20 % and 40 % data amounts but at 60 % and 80 % Uniq 0.75 produces better performances over the Uniq Sqrt method. At the 60% and 80% data amounts, Sqrt achieves higher accuracies compared to its unique variant.
54
52
50
Word Accuracy (%)
48
46
44
42
40
Natural MaxEnt Tri MaxEnt Wrd Sqrt 0.75 Uniq Sqrt Uniq 0.75
38
36 20
30
40
50
60
70
80
Percentage Training Data (%)
Fig. 5 Word accuracies for TIMIT trained and evaluated systems for various training data percentages and data selections methods.
18
Neil Taylor Kleynhans, Etienne Barnard
Table 5 captures the statistical significance of the results shown in Figure 5. Three word accuracies produced by the triphone-based max-entropy selection are significantly worse while only a single word-based max-entropy result is significantly worse. The 0.75 method managed a single significant improvement while the remaining techniques (Uniq Sqrt and Uniq 0.75) achieved two significant improvements each. Table 5 Logarithmic P-Values of results produced by different systems and training data amounts for the TIMIT train and evaluation scenario. Percentage 20 40 60 80
% % % %
MaxEnt Tri *-8.48 -1.87 *-7.49 *-3.98
MaxEnt Wrd *-5.48 -0.85 -0.73 -0.26
Selection Type Sqrt 0.75 -1.35 -1.13 *-6.98 *-4.35 *-3.91 -1.81 -0.47 -0.24
Uniq Sqrt *-4.18 *-14.70 -2.54 -0.23
Uniq 0.75 -1.32 *-11.05 *-4.94 -0.89
The results in figure 5 show, for the TIMIT training and evaluation scenario, moving from a “compressed” to “intermediate” data selection approach produces the best performance. Figure 6 shows the word accuracies produced by various TIMIT trained systems evaluated using the WSJ corpus developed on differing training data amounts and data selection approaches. As with the TIMIT only results, both max-entropy data selection methods deliver performances that are worse compared to the Natural approach. The remaining data selection techniques produce better accuracies but the order of the best result is dependent on the training data amount – 20 % 0.75, 40 % Uniq Sqrt, 60 % Sqrt and 80 % Uniq 0.75. There is no clear pattern on which data selection method to choose when moving from lower to higher data amounts – except any selection of “compressed” or “intermediate” is better than choosing at random. Table 6 shows logarithmic P-values statistical significance tests for ASR system results, developed on the TIMIT corpus and evaluated on the WSJ corpus. The max-entropy selections methods produce significantly worse results for the 20 % and 40% data amounts and at 60% for the word-based max-entropy selection. At the 20% data percentage 0.75 delivered a significantly better result. For the 40% and 60% data intervals the data selection approaches, Sqrt, 0.75, Uniq Sqrt and Uniq 0.75 all produced significantly better accuracies. Lastly, at the 80% data percentage the Sqrt, Uniq Sqrt and Uniq 0.75 obtained significantly better results. Table 6 Logarithmic P-Values for results obtained using TIMIT trained and WSJ evaluated ASR systems. Percentage 20 40 60 80
% % % %
MaxEnt Tri *-15.00 *-8.12 *-Inf -0.41
MaxEnt Wrd *-8.51 *-12.99 -2.35 -0.02
Selection Type Sqrt 0.75 -1.23 *-3.63 *-Inf *-6.34 *-7.63 *-5.16 *-10.02 -1.83
Uniq Sqrt -2.15 *-Inf *-4.83 *-3.14
Uniq 0.75 -0.71 *-8.90 *-4.19 *-13.89
Efficient data selection for ASR
19
46
44
Word Accuracy (%)
42
40
38
36
34 Natural MaxEnt Tri MaxEnt Wrd Sqrt 0.75 Uniq Sqrt Uniq 0.75
32
30 20
30
40
50 60 Percentage Training Data (%)
70
80
Fig. 6 Word accuracies produced by ASR systems trained on TIMIT corpus and evaluated using the WSJ corpus using different training data amounts and data selection methods.
6.2 WSJ Figure 7 shows word accuracies for WSJ trained and evaluated systems using different training data amounts selected with various data selection techniques. At the 20% data percentage only the 0.75 produces the best accuracy while the remaining techniques perform worse compared to the Natural approach. For the 40% data interval, the Uniq Sqrt, Uniq 0.75 and MaxEnt Wrd approaches showed an improvement, while techniques Sqrt, 0.75 and MaxEnt Tri obtained decreased accuracies when compared to Natural. At 60% only the 0.75 and Uniq 0.75 approaches produced improved accuracies. Lastly, at the 80% data amount the Uniq 0.75 and Sqrt provided an improvement compared to the Natural data selection. The results show, moving from lower to higher data amounts, that selecting the 0.75 at 20% and Uniq 0.75 for the remaining data percentages will provide an improvement in word accuracies over the natural selection. This is in contrast to the TIMIT results which favoured a move from “compressed” to “intermediate” data selections which may be down to different corpus-specific distributions. Table 7 shows statistical significance test logarithmic P-values for the WSJ developed and evaluated systems. The only significant results are at the 20% data percentage for the max-entropy data selection methods which produced lower accuracies compared to the Natural data selection. The observed accuracy improvements obtained using 0.75 and Uniq 0.75 data selection approaches are not statistically significant. Figure 8 shows word accuracies for ASR systems trained on WSJ and evaluated with TIMIT using different data selection methods and percentages of total training data. Besides at the 40% training data percentage where word-based maxentropy data selection approach achieved a better result compared to the Natural, for all other data percentages the max-entropy methods perform worse compared to the other data selection methods. For all training percentages, the Sqrt and Uniq Sqrt achieve better accuracies compared to the remaining data selections ap-
20
Neil Taylor Kleynhans, Etienne Barnard 62
60
Word Accuracy (%)
58
56
54
52 Natural MaxEnt Tri MaxEnt Wrd Sqrt 0.75 Uniq Sqrt Uniq 0.75
50
48 20
30
40
50 60 Percentage Training Data (%)
70
80
Fig. 7 Word accuracies for WSJ developed and evaluated systems using various data selection techniques and data training percentages.
Table 7 Logarithmic P-Value results for WSJ trained and evaluated ASR systems using different data selection methods and percentages of the total training data. Percentage 20 40 60 80
% % % %
MaxEnt Tri *-7.45 -0.09 -1.55 -1.19
Selection Type MaxEnt Wrd Sqrt 0.75 *-3.42 -0.06 -0.63 -0.85 -0.27 -0.13 -0.71 -0.87 -0.23 -2.39 -0.20 -0.08
Uniq Sqrt -0.03 -0.42 -0.16 -0.36
Uniq 0.75 -0.79 -0.87 -0.94 -0.92
proaches, however, the best results depend on the specific data percentage – 20 % Uniq Sqrt, 40% Sqrt, 60 % Uniq Sqrt and Sqrt. The Uniq 0.75 produces accuracies above the Natural and below the “compressed” data selection methods except at the 80 % training percentage where the performance is worse compared to the random selection. The 0.75 data selection approach managed to improve the word accuracies for the 20% and 40% percentages compared to the Natural selection but no improvement was seen for the remaining training intervals. Only at the 20% data training percentage did 0.75 improve upon the Uniq 0.75 approach. From this, the results would suggest that for the cross-corpus case of developing models on WSJ and evaluating using the TIMIT corpus that using the “compressed” data selection methods to choose the training data affords a slight improvement in the word accuracies. This at odds with both TIMIT experiments (“compressed” to “intermediate”) and the WSJ only experiments (“intermediate”). Table 8 shows statistical significant test logarithmic P-values for the word accuracies obtained on systems developed on WSJ data and evaluated using the TIMIT corpus. The vast majority of the results are not statistically significant besides the max-entropy results at 20% and 60% where significant decreases in performance are seen. Even though the Sqrt and Uniq Sqrt produce word accuracy improvements these are not significant compared to the Natural data selection approach.
Efficient data selection for ASR
21
52
50
Word Accuracy (%)
48
46
44
Natural MaxEnt Tri MaxEnt Wrd Sqrt 0.75 Uniq Sqrt Uniq 0.75
42
40 20
30
40
50 60 Percentage Training Data (%)
70
80
Fig. 8 Word accuracies obtained on systems developed on WSJ and evaluated on TIMIT using various training data percentages selected with different data selection approaches. Table 8 Logarithmic P-Value results for WSJ trained and TIMIT evaluated ASR systems using different data selection methods and percentages of the total training data. Percentage 20 40 60 80
% % % %
MaxEnt Tri *-8.77 -2.45 *-3.24 -1.74
Selection Type MaxEnt Wrd Sqrt 0.75 *-3.01 -0.89 -0.36 -0.08 -0.88 -0.31 *-5.20 -0.68 -0.13 -2.19 -0.39 -0.18
Uniq Sqrt -1.47 -0.73 -1.14 -0.19
Uniq 0.75 -0.80 -0.17 -0.33 -0.20
6.3 Lwazi Figure 9 shows word accuracies for ASR systems developed and evaluated on Lwazi at different training data percentages and using various data selections methods. The word-based max-entropy data selection method consistently produces worse accuracies compared to the Natural selection. The remaining data selection methods also achieved decreased performances at 20%, 40% and 60% data intervals. At the 80% training data percentage, however, the “compressed” and “intermediate” data selections methods managed to improve the word accuracies with the order (worse to best): Sqrt, Uniq Sqrt, 0.75 and Uniq 0.75. The statistical significant test logarithmic P-values, captured in Table 9, show that none of the improvements at the 80% data interval are statistically significant. At the 20% data percentage all but the 0.75 approach showed a significant decrease in performance. For the 40% training interval, systems developed on data selections methods MaxEnt Wrd, Uniq Sqrt and Uniq 0.75 all produce word accuracies which were significantly degraded. Lastly, at the 60% interval only the MaxEnt Wrd delivered significantly poorer word accuracies. If one compares the TIMIT, WSJ and Lwazi word accuracies, the Lwazi systems produced the highest errors. This might be explained by the telephony collection channel for the Lwazi data and that the utterances were collected in a more
22
Neil Taylor Kleynhans, Etienne Barnard 30
25
Word Accuracy (%)
20
15
10
Natural MaxEnt Wrd Sqrt 0.75 Uniq Sqrt Uniq 0.75
5
0 20
30
40
50 60 Percentage Training Data (%)
70
80
Fig. 9 Word accuracies for Lwazi developed and evaluated systems using various data selection techniques and data training percentages. Table 9 Logarithmic P-Value results for Lwazi trained and evaluated ASR systems using different data selection methods and percentages of the total training data. Percentage 20 40 60 80
% % % %
MaxEnt Wrd *-Inf *-Inf *-7.12 -0.06
Selection Type Sqrt 0.75 Uniq Sqrt *-5.96 -0.39 *-10.77 -3.00 -2.10 *-3.79 -1.00 -1.11 -0.82 -0.24 -1.55 -0.75
Uniq 0.75 *-3.44 *-3.05 -0.94 -2.05
natural way with less stringent collection process as compared to the strict TIMIT and WSJ collection setups. Taken together, our experiments on these three corpora suggest that the Natural data selection strategy generally performs very well, but that the “compressed” and “intermediate” methods may also be useful in appropriate circumstances. The relative under-performance of max-entropy based data selection can be understood by reference to the analysis of Section 4 – from that analysis, it is clear that more training samples should be devoted to the more common acoustic units, since those units will have a greater influence on the overall accuracy. The relative performance of other three approaches, however, is not as straightforward; we believe that the out-performance of “compressed” and “intermediate” on the TIMIT data set results from the more skewed distribution of triphones which results from the design of that corpus. Hence, the benefit of emphasizing more common triphones during selection becomes more pronounced.
7 The relationship between train-test divergence and accuracy One possible explanation for the observed word accuracies, presented in Section 6, is the difference in distribution between the training and evaluation sets. To investigate this possibility the Kullback-Leibler divergence metric was used to
Efficient data selection for ASR
23
measure the difference between the two distributions. The full set of results can be found in Kleynhans (2013); a summarised version is presented in this section. Table 10 shows best word accuracies and the lowest KL-divergence for various data selection methods and training and evaluation corpora. The main conclusion which can be made from the work presented in Kleynhans (2013) is: on average the divergences between the training and evaluation corpora were indeed negatively correlated with the accuracy achieved – the lower the KL-divergence measures the higher the accuracies. The correlation was measured across all experiments. From table 10, however, there is not a single case where the lowest KL-divergence achieved the best word accuracy – therefore this does not seem to be the only factor that influences the achieved accuracy. Table 10 The data selection methods which produced the best word accuracies and lowest KL-divergence for the various training sets, evaluation sets and data percentages. Training Corpus TIMIT TIMIT TIMIT TIMIT TIMIT WSJ WSJ WSJ WSJ WSJ WSJ Lwazi Lwazi Lwazi
Evaluation Corpus TIMIT TIMIT WSJ WSJ WSJ WSJ WSJ WSJ WSJ TIMIT TIMIT Lwazi Lwazi Lwazi
Data Percentage 20 40 20 40 60 20 40 60 80 20 60 20 40 60
Best Word Accuracy Method Uniq Sqrt Uniq Sqrt 0.75 Uniq Sqrt Sqrt 0.75 MaxEnt Wrd Uniq 0.75 Uniq 0.75 Uniq Sqrt Uniq Sqrt Natural Natural Natural
Lowest KLdivergence Method Uniq 0.75 Uniq 0.75 Uniq 0.75 Uniq 0.75 Uniq 0.75 Natural / Uniq 0.75 Natural Natural Natural Sqrt Sqrt 0.75 0.75 0.75
8 Conclusion The work presented here outlines a new data selection theory which provides a mechanism for choosing units based on criteria for boosting the system’s overall accuracy. Contrary to other unit selection methods our approach takes into consideration the relationship between a unit’s accuracy and its frequency of occurrence. In our theoretical framework we showed that the optimal distribution is dependent on the assumed relationships between the triphone frequency and accuracy. Based on theoretical and empirical evidence, the two relationships we investigated were logarithmic and hyperbolic. The hyperbolic relationship leads to a unit selection strategy in which the selected frequencies are proportional to the square root of the occurrence frequencies, while the logarithmic relationship leads to selected units which match the reference set i.e. units selected at random. A number of data selection experiments were performed to investigate the relationships and compare our approach with commonly used methods. From these we may conclude: – In the vast majority of cases the max-entropy based data selection consistently produced the lowest performing systems and word-based max-entropy selection
24
–
–
–
–
Neil Taylor Kleynhans, Etienne Barnard
is superior to triphone-based unit selection. These results are consistent with results presented by Gouvˆea and Davel (2011). Using our experimental setup and choosing smaller sub-corpora, the “natural” selection (random choice) is an effective strategy and is difficult to outperform in a consistent manner. For the TIMIT trained ASR systems; – The “compressed” and “intermediate” data selection methods have the ability to produce improved accuracies, however, not all were significantly better when compared to “natural” selection. – On average estimating the triphone distribution from unique utterances and then performing data selection gave slightly better system accuracies when compared with systems which estimated triphone distributions using all the data. For the WSJ trained ASR systems; The “compressed” and “intermediate” data selection methods performed comparably to the “natural” selection method for both WSJ and TIMIT evaluations. None of the observed performance gains were statistically significant. For the Lwazi trained ASR systems; On average, the “compressed” and “intermediate” data selection methods performed comparably to the “natural” selection method.
Based on the results we can see that for the majority of experiments the “compressed” and “intermediate” data selection methods achieved results comparable to that of the “natural” selection. Only for the TIMIT experiments did we see an improvement but the TIMIT corpus is somewhat artificial as the prompt selection was heavily engineered. Fully understanding why the TIMIT results required nonuniform sampling is likely to provide additional insights, that may be useful for the creation of specialized corpora. The WSJ and Lwazi corpora are more typical of ASR data collections which showed no significant performance gains using a variety of data selection approaches. The max-entropy based selections did not show any promising results which is in line with findings presented by Gouvˆea and Davel (2011). The main conclusion, thus is that for any data selection, matching the “natural” distribution is a competitive strategy. There are indications that the “compressed” and “intermediate” data selection methods may be useful under specific circumstances, and it is worthwhile investigating whether those methods may be preferable to “natural” selection in other practical situations. Given a new corpus, however, an initial random selection, to match the “natural distribution”, would be a good approach to select a subset of the data. In section (7) we showed that there was a negative correlation between the accuracy and training and evaluation KL-divergence, but from table 10 we also showed that the best KL-divergence did not produce the best result. This implies that merely matching the training and evaluation distributions is not the only factor which influences the resulting accuracy. Therefore using KL-divergence as a selection criterion improves the results to a point before other factors start affecting the system accuracy. Finally, it should be noted that some of the effects observed in our studies are not only statistically significant, but also have substantial potential impact. For example, in tables 5 and 6 (TIMIT experiments), all the “compression” and
Efficient data selection for ASR
25
“intermediate” methods obtain similar or better accuracies at 60% corpus size to what the Natural method obtains at 80% corpus size, implying that similar performance could be achieved with only 60/80 = 75% of the collection effort. Such savings should be quite useful in practice.
References Barnard E (1994) A model for nonpolynomial decrease in error rate with increasing sample size. Neural Networks, IEEE Transactions on 5(6):994–997 Barnard E, Davel M, van Heerden C (2009) ASR corpus design for resource-scarce languages. In: Proceedings of INTERSPEECH, ISCA, Brighton, United Kingdom, pp 2847–2850 Erol B, Cohen J, Etoh M, Hon HW, Luo J, Schalkwyk J (2009) Mobile media search. In: Proceedings of the International Conference on Acoustics, Speech and Signal Processing (ICASSP), IEEE, Taipei, Taiwan, pp 4897–4900 Fisher WM, Doddington GR, Goudie-Marshall KM (1986) The DARPA speech recognition research database: specifications and status. In: Proc. DARPA Workshop on Speech Recognition, pp 93–99 Gillick L, Cox SJ (1989) Some statistical issues in the comparison of speech recognition algorithms. In: Proceedings of the International Conference on Acoustics, Speech and Signal Processing (ICASSP), IEEE, Glasgow, Scotland, vol 1, pp 532–535 Gouvˆ ea E, Davel MH (2011) Kullback-Leibler divergence-based ASR training data selection. In: Proceedings of INTERSPEECH, Florence, Italy, pp 2297–2300 Graff D, Wu Z, MacIntyre R, Liberman M (1997) The 1996 broadcast news speech and language-model corpus. In: Proceedings of the DARPA Workshop on Spoken Language technology, Citeseer, pp 11–14 Kleynhans NT (2013) Automatic speech recognition for resource-scarce environments. PhD thesis, North-West University, Potchefstroom Campus Moore RK (2003) A comparison of the data requirements of automatic speech recognition systems and human listeners. In: Proceedings of EUROSPEECH, Geneva, Switzerland, pp 2582–2584 Navratil J (2001) Spoken language recognition-a step toward multilinguality in speech processing. Speech and Audio Processing, IEEE Transactions on 9(6):678–685 Paul DB, Baker JM (1992) The design for the Wall Street Journal-based CSR corpus. In: Proceedings of the workshop on Speech and Natural Language, Association for Computational Linguistics, pp 357–362 Rabiner LR (1997) Applications of speech recognition in the area of telecommunications. In: Automatic Speech Recognition and Understanding, 1997. Proceedings., 1997 IEEE Workshop on, IEEE, Santa Barbara, California, USA, pp 501–510 Reynolds DA (2001) Automatic speaker recognition: Current approaches and future trends. In: Proceedings of the International Conference on Acoustics, Speech and Signal Processing (ICASSP), IEEE, Salt Lake City, Utah, USA, pp 1–6 Santen JPH, Buchsbaum AL (1997) Methods for optimal text selection. In: Proceedings of EUROSPEECH, ISCA, Rhodes, Greece, pp 553–556 Wu Y, Zhang R, Rudnicky A (2007) Data selection for speech recognition. In: Automatic Speech Recognition & Understanding, 2007. ASRU. IEEE Workshop on, IEEE, Pittsburgh, Pennsylvania, USA, pp 562–565 Young S, Evermann G, Gales M, Hain T, Kershaw D, Liu X, Moore G, Odell J, Ollason D, Povey D, Valtchev V, Woodland P (2009) The HTK Book. revised for HTK version 3.4. http://htk.eng.cam.ac.uk//