Feature Vector Selection to Improve ASR Robustness in Noisy Conditions Johan de Veth1, Laurent Mauuary2, Bernhard Noe3, Febe de Wet1, Juergen Sienel3, Louis Boves1 & Denis Jouvet2 1
A2RT, Dept. of Language & Speech, University of Nijmegen, The Netherlands 2 France Télécom R&D, DIH/IPS, Lannion, France 3 Alcatel SEL AG, Stuttgart, Germany
[email protected],
[email protected],
[email protected],
[email protected] [email protected],
[email protected],
[email protected]
Abstract It is well known that noise reduction schemes are beneficial in ASR to reduce training-test mismatch due to noise. However, a significant mismatch may still remain after noise reduction, especially in the non-speech portions of the signals. To reduce the impact of this mismatch, two methods for discarding nonspeech acoustic vectors at recognition time are investigated: variable frame rate processing and voice activity detection. Experiments are discussed for Aurora 2 and for SpeechDat Car Italian. Results show that both methods are highly effective for SpeechDat Car Italian. However, for Aurora 2, feature vector selection based on voice activity detection hardly gives a benefit, while variable frame rate processing actually lowers recognition accuracy somewhat. Several possible explanations of the different results observed for the two databases are discussed
1. Introduction Many different methods to alleviate the effect of training-test mismatch on recognition performance have been proposed over the past 25 years (for a recent overview, see [1]). One approach to reduce the mismatch is to use speech enhancement or noise reduction (e.g., [2, 3]). Although noise reduction is effective for human speech recognition, it is less effective for ASR. This observation can, at least in part, be explained in terms of differences between the speech and non-speech portions of acoustic signals. For the speech portions, speech enhancement can reduce the mismatch due to additive background noise. For non-speech portions, most noise reduction algorithms reduce the perceived presence of the background noise by attenuating the energy of the non-speech sound spectra. Although attenuation helps to reduce the perceived intensity of these sounds, it hardly reduces the mismatch between the spectrum of the attenuated background noise and the model of acoustic background as observed during training. When training-test mismatch occurs in non-speech signal portions, it is reasonable to expect that additional insertion errors are introduced. In principle, two strategies can be used to reduce insertion errors caused by the mismatch in non-speech signal portions. Firstly, the mismatch between the spectrum of the noise reduced background signal and the trained back-
ground model can be reduced for every acoustic observation vector. Examples of this approach are discussed in [4] and [5]. The second approach is to reduce the number of observation vectors that are thought to correspond to the background noise after application of the noise reduction scheme. It is reasonable to assume that the relative importance of the non-speech observations is reduced in this manner, thereby reducing the number of insertion errors and, as a result, improving recognition accuracy. It is this second approach, dubbed feature vector selection (FVS), which is studied in this paper. The aim of this paper is to investigate the effects of two different methods for discarding non-speech portions of the input on recognition performance in the Aurora tasks. The methods for reducing the number of non-speech frames studied in this paper are: (1) FVS based on variable frame rate (VFR) processing [6] and (2) FVS based on the output of a voice activity detector (VAD). This paper is further organised as follows. Section 2 shortly describes the speech material that was used in the experiments. The first part of Section 3 describes the acoustic pre-processing steps, including the noise reduction, that were used in each experiment. After this, the VFR and the VAD processing are explained in Sections 3.2 and 3.3, respectively. In Section 4.1, experimental evidence is first presented which suggests that a significant mismatch still resides in the nonspeech signal portions of the speech material after application of a noise reduction scheme. Next, experiments based on VFR and VAD for FVS are discussed in Sections 4.2 and 4.3, respectively. Finally, the main conclusions are given in Section 5.
2. Speech material For the experiments discussed in this paper, two databases were used: Aurora 2 and SpeechDat Car Italian (SDC-IT). [7] and [8] provide the details of these databases. 2.1.1.
Aurora 2 Database
The Aurora 2 database [7] is a noisified version of the TIdigits database. Eight different types of noise were added to the clean speech signals at signal-to-noise ratios (SNRs) between clean and –5 dB. TI-digits contains connected digits spoken by native speakers of American English. The noise signals were recorded in several typical environments. Six test sets were defined by the ETSI-Aurora consortium. For
measurement of recognition performance a standardised ASR system is supplied together with this database [7]. 2.1.2.
fore the transition exceeds 50 ms. This effectively avoids that the hangover is applied after very short noise segments, which may be mis-classified as speech.
SDC-Italian Database
The SDC-Italian database [8] was recorded in a car environment. Speech was recorded in different driving conditions (such as high speed, open window, etc.) with four microphones (one close talk and three hands free). All speakers in this database are native Italians. For evaluation in ETSI-Aurora, three sets of recording conditions were defined (well matched (WM), medium mismatched (MM), and highly mismatched (HM)). The three ETSI-Aurora conditions of SDC-Italian contain only digit utterances and only recording made with the close talk and one of the hands free microphones.
3. Methods Two methods for discarding noisy acoustic feature vectors were investigated. The first method is based on a VFR technique and discards contiguous acoustic vectors that are similar. The second method is based on the output of a VAD and only discards acoustic vectors that are classified by the VAD as non-speech. 3.1. Acoustic pre-processing For all experiments, the following procedure was used to create acoustic observation vectors. First, the noise reduction scheme described in [9] was applied to each utterance. After this, Mel-cepstrum coefficients were computed without c0, using the standard WI-007 front-end supplied by ETSIAurora. This yielded 12 cepstral coefficients (c1, …, c12) + log energy (logE). Next, cepstrum mean subtraction was applied to c1, …, c12 using the full length of each recording. After this, delta coefficients and delta-delta coefficients were computed, with a window of 9 frames. The dimension of each acoustic vector was therefore 39. 3.2. Variable frame rate processing With VFR processing an observation vector is discarded if it does not differ much from the previous observation vector. In our implementation of VFR, frame-to-frame variation is estimated as the Euclidean norm of the sub-vector corresponding to the delta-cepstrum. If the Euclidean norm is smaller than an a priori defined VFR threshold, the current observation vector is discarded. The VFR threshold was optimized using the SDC-IT database for all the VFR experiments described in this paper. 3.3. Voice activity detection The VAD algorithm that was used for FVS classifies an acoustic vector as speech or non-speech (noise) based on an estimate of SNR estimated from the difference between the short-term log energy and a long-term estimate of non-speech log energy. If this difference exceeds a pre-defined threshold, the current frame is classified as speech. The short-term energy used for the classification of the k-th frame is the energy of the (k+4)th frame in order to avoid truncation of speech segments. The long-term estimate of non-speech energy is updated if the current frame is classified as non-speech. A hangover of 150 ms is applied after speech to non-speech transitions, provided that the duration of the speech segment immediately be-
4. Results and discussion 4.1. Mismatch in non-speech after noise reduction In order to evaluate the amount of mismatch between training and test data for non-speech acoustic vectors, two experiments were carried out using the SDC-Italian highly mismatched (HM) condition. The HM condition uses close talk microphone recordings for training and hands free microphone for testing. For the first experiment, the silence model of the HM condition was replaced at recognition time by the silence model from the well matched condition. The silence model of the WM condition is trained with recordings from the close talk as well as the hands free microphone. After the silence model modification, the accuracy hardly changed from 78.2% to 78.1%. However, the number of insertions was reduced from 247 to 200. For the second experiment, the log energy values of the hands free recordings were replaced by the log energy values of the corresponding close talk files for all test utterances in the HM condition. In this case, the recognition accuracy improved from 78.2% for unmodified files to 89.1% for modified files, and the number of insertion errors decreased from 247 to 132. Thus, alleviating the mismatch for the log energy coefficients in the observation vector dramatically reduces the number of insertion errors. Apparently, improving the match by introducing a coefficient that has a better non-speech-to-speech dynamic range helps to reduce the chance that high noise non-speech portions are mistaken for words. The results of these two experiments suggest that a significant mismatch still exists after noise reduction in the “clean training - noisy test” scenario, and that the number of insertion errors can be significantly reduced (at least for SDCIT). Therefore, we investigated whether reducing the impact of non-speech portions by discarding non-speech acoustic vectors could give a benefit. 4.2. Feature vector selection based on VFR When VFR processing is applied as described in Section 3.2, acoustic vectors corresponding to both speech and non-speech signal portions can be discarded. It is only reasonable to expect that more non-speech observations are discarded than speech observations, if it is safe to assume that the average amount of inter-vector variation is smaller for non-speech than for speech portions of the signal. In other words, VFR processing can only be expected to give a benefit if the background noise is more stationary than the speech signal portions. In order to test this assumption, each acoustic vector was labeled as speech or non-speech. For SDC-IT, this was done by using the close-talk recording. For the Aurora 2 database, speech/non-speech labeling was done after noise reduction. For SDC-IT, it was found that 71.9% of the acoustic vectors corresponded to non-speech. For the Aurora 2 database 43.5% of the acoustic vectors corresponded to non-speech. After VFR the number of speech and non-speech vectors retained were determined. This was done for a series of different VFR threshold values, so that the proportions of nonspeech and speech observations kept could be established as a
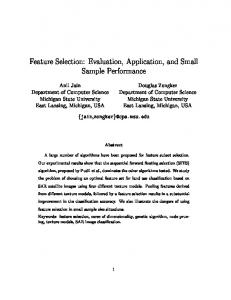
function of the proportion of all acoustic vectors discarded after VFR. The results are shown in Fig. 1 for each condition defined for the SDC-IT database. As can be seen in Fig. 1, the proportion of non-speech vectors is reduced much more than that of speech vectors for each value of the VFR threshold. Thus, we can conclude that VFR removes relatively more non-speech than speech observations (at least for SDC-IT). 1
WM tests 0 0
0.2 0.4 0.6 proportion all discarded
0.5
100 MM tests
0 0
proportion kept
1
0.5 HM tests 0 0
95
0.2 0.4 0.6 proportion all discarded
0.2 0.4 0.6 proportion all discarded
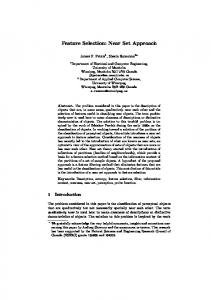
Figure 1. Proportions of speech (X) and non-speech (O) observations kept after VFR as a function of the proportion of all acoustic vectors discarded after VFR for each test set in SDC-IT. Next, the recognition accuracy was established as a function of the VFR threshold. VFR was applied only at recognition time. We did try to apply VFR for training, but the results were disappointing. This can be understood, since VFR removes speech as well as non-speech observations. As a result, the length of the models becomes too large to fit to the duration of a substantial proportion of the tokens in the training database. The length of the models is fixed in the ETSIAurora context and, therefore, cannot be made shorter to improve the fit to the observation sequences. Another explanation why application of VFR does not lead to satisfactory results when applied during training is that VFR may increase the risk that lack of training data occurs, especially for the noise/background models. The results for SDC-IT are shown in Figure 2. The line segments that are shown for 0 frames discarded correspond to the condition where no VFR was applied. As can be seen, the recognition performance is especially improved for the HM condition, whereas the recognition accuracies for the WM and MM conditions are hardly affected. At the optimum threshold value about 45% of all observation vectors are discarded, and the overall score is significantly improved from 90.0 to 91.8. For the HM condition the number of deletion (D), substitution (S) and insertion (I) errors were D=290, S=295, and I=247, respectively, without VFR and D=271, S=242, and I=77 with VFR. So, all types of errors were reduced by VFR, but the most important reduction was observed for the insertion errors. For the Aurora 2 database, the performance without FVS is shown in Table 1. The overall score is 86.75, representing an improvement relative to WI007 features of 42.73 %. The sum of D, S, and I type errors taken over all test conditions is D=39,615, S=39,691, and I=10,927. Apparently, the balance between D-type and I-type errors differs significantly from the D/I balance in SDC-IT. Given the smaller relative importance of I-type errors in Aurora 2, one may ask already upfront whether a strategy aiming to reduce especially these will make a substantial improvement of the overall score.
recognition accuracy
0.5
proportion kept
proportion kept
1
Using the VFR threshold that was optimal for SDC-IT, (during testing only) for the Aurora 2 database yields the results shown in Table 2. VFR reduces the overall score to 85.76. Thus, contrary to the result for SDC-IT, VFR gave a slight deterioration. The sum of D, S, and I type errors taken over all test conditions with VFR is D=50,609, S=37,164, and I=6,984. Compared to the no FVS condition, D is substantially increased, whereas S and especially I are decreased. Overall, the increase in D type errors is apparently more important than the combined gain in S and I type errors.
90
85
80
75
0
0.1
0.2 0.3 0.4 proportion of frames discarded
0.5
0.6
Figure 2. Recognition accuracy for SDC-IT as a function of the proportion of all observations discarded after VFR. The WM, MM and HM condition are indicated with symbols ‘x’, ‘o’, and ‘+’, respectively. The overall score is indicated with the thick line. Table 1: Aurora 2 results, without FVS. Training Mode Multicondition Clean Only Average
Absolute performance Set A Set B 90,98 89,85 83,92 83,68 87,45 86,76
Set C 88,60 82,08 85,34
Performance relative to Mel-cepstrum Set A Set B Set C Training Mode 25,94% 26,05% 29,70% Multicondition 58,41% 63,13% 47,09% Clean Only 42,18% 44,59% 38,39% Average
Overall 90,05 83,46 86,75
Overall 26,88% 58,58% 42,73%
Table 2: Aurora 2 results, with application of VFR. Training Mode Multicondition Clean Only Average
Absolute performance Set A Set B 89,83 89,36 82,66 83,03 86,24 86,20
Set C 87,19 80,67 83,93
Overall 89,11 82,41 85,76
4.3. Feature vector selection based on VAD In the results presented below, VAD was applied for FVS at recognition time only. The 12 first feature vectors were always passed to the recognizer. In a series of tuning experiments, this was found to be necessary in order to avoid eliminating leading silent portions, which lead to degrading recognition performance. Each following feature vector was discarded if it was considered to be non-speech according to the VAD module described in Section 3.3.
100
5. Conclusions
recognition accuracy
95
90
85
80
75
0
0.2
0.4 0.6 VAD threshold
0.8
1
Figure 3: Recognition accuracy for SDC-IT as a function of the VAD threshold. The WM, MM and HM condition are indicated with symbols ‘x’, ‘o’, and ‘+’, respectively. The overall score is indicated with the thick line. Figure 3 shows the recognition accuracies for SDC-IT with VAD applied during testing. Table 3 shows the results for Aurora 2 using the same VAD threshold for which the SDC-IT overall score reached its optimal value. The total number of D, S and I type errors for Aurora 2 were D=40,265, S=39,483, and I=10,256. Table 3: Aurora 2 results, with application of VAD. Training Mode Multicondition Clean Only Average
Absolute performance Set A Set B 90,96 89,84 84,18 83,84 87,57 86,84
In this paper, two methods for FVS were investigated, i.e., VFR processing and VAD-based FVS. Both methods were tested using the Aurora 2 and the SpeechDat Car Italian databases that are defined in the context of the ETSI Aurora frontend evaluation. For Aurora 2, the highest overall score in these tests was 86.83, which was obtained with VAD-based FVS during testing only. For SDC-IT, the highest overall score (91.8) was obtained with VFR-based FVS during testing. For all test conditions studied, it was found that both VFR and VAD processing particularly diminish the number of insertion errors. The results obtained so far clearly indicate that reducing the proportion of non-speech observations well below 70% helps to improve recognition robustness for a “clean training – noisy test” mismatch. Additional experiments are under way to better understand the differences we observed in terms of the effectiveness of VFR and VAD for the two different databases that were studied.
Acknowledgement This work was partially supported by the SMADA European project. The SMADA project is partially funded by the European Commission, under the Action Line Human Language Technology in the 5th Framework IST Programme.
References Set C 88,39 82,29 85,34
Overall 90,00 83,67 86,83
The results for SDC-IT show that VAD is beneficial for FVS. Comparing VFR and VAD as method for FVS, it can be seen that both methods improve recognition accuracy for the HM condition, and that VFR is preferred over VAD. Turning to the results for Aurora 2, the reverse is observed: VAD gives a small benefit for Aurora 2, where VFR performance deteriorates. Both types of FVS methods studied in this paper decrease the number of I type errors, and the impact of VFR for this type of errors is larger. However, VAD is apparently better suited to keep the balance between D, S and I type errors for Aurora 2. In order to understand the qualitatively different results for the two databases in this study, at least the following factors should be taken into consideration. Firstly, the proportion of non-speech observations is smaller in Aurora 2 than in SDC-IT. If the relative importance of the non-speech portions is smaller, it is reasonable to expect that a strategy aimed to reduce their impact will be less effective. Secondly, D-type and I-type errors are much more balanced in SDC-IT than in Aurora 2, at least for the type of acoustic features that were used in this study. If the D/I balance for Aurora 2 is improved (e.g., by tuning the word insertion penalty), it remains an open question whether the effect of FVS on overall recognition accuracy is still so limited. Besides these two factors, it is important to realise that Aurora 2 is in fact noisified data, whereas SDC-IT contains real-world recordings, and that the number of different noise types in Aurora 2 is larger than in SDC-IT. Additional experiments are under way to verify to what extent these four factors contribute to the qualitative differences we observed.
[1] De Veth, J., Cranen, B., and Boves, L., “Acoustic features and distance measure to reduce vulnerability of ASR performance due to the presence of a communication channel and/or background noise”, in: Robustness in language and speech technology, J.-C. Junqua and G. van Noord (Eds), Kluwer, 9 – 45, 2001. [2] McAuley, R.J. and Malpass, M.L., “Speech enhancement using a soft-decision noise suppression filter”, IEEE Trans. Acoustics, Speech, and Signal Proc., 28 (2), 137 – 145, 1980. [3] Mokbel, C., Mauuary, L., Karray, L., Jouvet, D., Monné, J., Simonin, J., and Bartkova, K., “Towards improving ASR robustness for PSN and GSM telephone applications”, Speech Comm., 23, 141 – 159, 1997. [4] Claes, T., Xie, F., and Van Compernolle, D, “Spectral estimation and normalisation for robust speech recognition”, in: Proc. ICSLP-96, 1996. [5] Hilger, F., and Ney, H., “Noise level normalization and reference adaptation for robust speech recognition”, in: Proc. ASR-2000, 64 – 68, 2000. [6] Peeling, S.M., and Ponting, K.M., “Variable frame rate analysis in the ARM continuous speech recognition system”, Speech Comm., 10, 155 – 162, 1990. [7] Hirsch, G., and Pearce, D., “Second experimental framework for the performance evaluation of speech recognition front-ends”, STQ Aurora DSR Working Group, document AU/231/00, 2000. [8] Knoblich, U., “Description and baseline results for the subset of the SpeechDat Car Italian database used for ETSI STQ Aurora WI008 advanced DSR front-end evaluation”, STQ Aurora DSR Working Group, document AU/237/00, 2000. [9] Noe, B., Sienel, J., Jouvet, D., Mauuary, L., Boves, L., de Veth, J. and de Wet, F. "Noise reduction for noise robust feature extraction for distributed speech recognition", submitted to this conference.