c Statistical Research and Training Center ⃝ J. Statist. Res. Iran 10 (2013): 1–22
٢٢–١ ﺻﺺ،١٣٩٢ ﺑﻬﺎر و ﺗﺎﺑﺴﺘﺎن،١ ﺷﻤﺎرهی،١٠ دورهی
Efficient Estimation of the Density and Cumulative Distribution Function of the Generalized Rayleigh Distribution M. Alizadeh†,∗ , S. F. Bagheri‡ and M. Khaleghy Moghaddam⋆ †
⋆
Shahid Bahonar University of Kerman ‡ Shahid Beheshti University
Sari Agriculture Sciences and Natural Resources University
Abstract. The uniformly minimum variance unbiased (UMVU), maximum likelihood, percentile (PC), least squares (LS) and weighted least squares (WLS) estimators of the probability density function (pdf) and cumulative distribution function are derived for the generalized Rayleigh distribution. This model can be used quite effectively in modelling strength data and also modelling general lifetime data. It has been shown that MLE is better than UMVUE and UMVUE is better than the others. An application to waiting times (min) of 100 bank customers. Keywords. Generalized Rayleigh distribution; maximum likelihood estimator; uniformly minimum variance unbiased estimator; percentile estimator; least squares estimator; weighted least squares estimator. MSC 2010: 62F10.
1 Introduction Surles and Padgett (2001) (see also Surles and Padgett, 2005) introduced two-parameter Burr Type X distribution and correctly named as the generalized Rayleigh (GR) distribution. Note that the two-parameter GR distribution is a particular member of the generalized Weibull distribution, origi∗
Corresponding author
2
Efficient Estimation of the Density and Cumulative Distribution Function . . .
nally proposed by Mudholkar and Srivastava (1993), see also Mudholkar et al. (1995). For α > 0 and λ > 0, the two-parameter GR distribution has the cumulative distribution function (CDF) { } 2 α F (x) = 1 − e−(λx) , x > 0. (1) Therefore, GR distribution has the probability density function (pdf) { } 2 2 α−1 f (x) = 2αλ2 xe−(λx) 1 − e−(λx) , x > 0.
(2)
Here α and λ are the shape and scale parameters, respectively. It is known that the GR density functions are always right skewed and they can be used quite effectively to analyze skewed data set (Raqab and Kundu, 2006). Asrabadi (1990) derived the uniformly minimum variance unbiased estimator (UMVUE) for pdf, CDF and the rth moment in Pareto distribution. Dixit and Jabbari Nooghabi (2010) have shown that maximum likelihood (ML) estimators of pdf and CDF are more efficient than UMVU estimators in Pareto distribution. In another work, Dixit and Jabbari Nooghabi (2011) have shown that ML estimators of pdf and CDF are more efficient than UMVU estimators in Pareto distribution with the presence of outliers. Similar studies have appeared in the recent literature for other distributions. For example, Bagheri et al. (2013a) derive estimators of the pdf and the CDF of a three-parameter generalized exponential-Poisson distribution when all but its shape parameter are assumed known. Bagheri et al. (2013b) derive estimators of the pdf and the CDF of a three-parameter exponential Gumbel distribution when all but its shape parameters are assumed known. In this paper we use some estimation methods to estimate the pdf and CDF of GR distribution. The rest of the paper is organized as follows. Assuming that α is the unknown parameter while λ is known, we derive MLE and UMVUE of pdf and CDF and MSE’s of these estimators in Sections 2 and 3, respectively. In Sections 4 and 5, we discuss other methods of estimation. Simulation results are provided in Section 6. An application to waiting times (min) of 100 bank customers is described in Section 7.
2
Maximum Likelihood Estimator of pdf and CDF
Let X1 , . . . , Xn be a random sample of size n from the GR distribution with pdf given by (2), where λ is known. According to the ML method we c 2013, SRTC Iran ⃝
M. Alizadeh, S. F. Bagheri and M. Khaleghy Moghaddam
obtain the MLE of α as α ˜=
∑n i=1
{ −n } 2 . ln 1−e−(λxi )
3
Considering the invariance
property of ML estimators and by using α ˜ = w, we can easily obtain the ML estimators of pdf and CDF as { } 2 2 w−1 f˜(w) = 2wλ2 xe−(λx) 1 − e−(λx) , and
{ } 2 w F˜ (x) = 1 − e−(λx) ,
w > 0,
w > 0,
(3)
(4)
{ } ∑ 2 respectively. Also one can easily find the pdf of T = − ni=1 ln 1 − e−(λxi ) as αn n−1 −αt g(t) = t e , t > 0, (5) Γ(n) and then by using the transformation α ˜ = w = algebra, we have n n α n e− w · g(w) = , Γ(n) wn+1
n t
and some elementary
nα
w > 0.
(6)
Theorem 1. (A) f˜(x) is a biased estimator of f (x) and } { −(λx)2 n αn e n E{f˜(x)} = 2λ2 x Γ(n) 1 − e−(λx)2 [ { }]j 2 n−2 ∑ ln 1 − e−(λx) Γ(n − j − 1) × · . j! (αn)n−j−1
(7 )
j=0
(B) F˜ (x) is a biased estimator of F (x) and
E{F˜ (x)} =
n−1 nn α n ∑
Γ(n)
Proof. By using k = 2λ2 x J. Statist. Res. Iran 10 (2013): 1–22
[
{ }]j 2 ln 1 − e−(λx) j!
j=0 2
e−(λx) 2, 1−e−(λx)
·
Γ(n − j) . (αn)n−j
(8)
b = e−(λx) and w = α ˜ , we can write 2
4
Efficient Estimation of the Density and Cumulative Distribution Function . . .
f˜(w) = kw(1 − b)w , w > 0. Therefore from equation (6) we have ∫
∞
e− w kw(1 − b) · n+1 dw Γ(n) w 0 nα ∫ ∞∑ ∫ ∞ ∞ − nα w {w ln(1 − b)}j e− w w ln(1−b) e dw = k1 dw · = k1 e wn j! wn 0 j=0 0 ∫ ∞ ∑ {ln(1 − b)}j ∞ −nαy n−j−2 1 = k1 e y dy (y = ) j! w 0
E{f˜(x)} =
nα
n n wn α
j=0
= k1
n−2 ∑ j=0
{ln(1 − b)}j Γ(n − j − 1) · , j! (αn)n−j−1
(9)
n n
α where k1 = kn Γ(n) . Note that in the process of finding the equation (9) ∑ aj ea = ∞ j=0 j! is used. Also we write the equation (9) using the fact that the gamma function is defined for positive values and therefore j must be less than n − 2. So the proof is complete. Similarly, one can prove case (B).
In the following theorem we obtain the MSE of f˜(x) and F˜ (x). Theorem 2. The MSEs of f˜(x) and F˜ (x) are given by
(A)
M SE{f˜(x)} = 4λ4 x2
α n nn
{
2 e−(λx)
]j }2 n−3 [ −(λx)2 } 2 ln{1 − e ∑
j! 1 − e−(λx)2 j=0 [ { }α−1 ] Γ(n − j − 2) 2 −(λx)2 −(λx)2 × − 4 αλ xe 1−e (αn)n−j−2 [ { }]j { −(λx)2 2 n−2 ln 1 − e n n −(λx) ∑ n α e × 2λ2 x · 2 −(λx) Γ(n) 1 − e j! j=0 } [ { }α−1 ]2 Γ(n − j − 1) 2 −(λx)2 −(λx)2 × + 2αλ xe 1−e . (αn)n−j−1 Γ(n)
(10) c 2013, SRTC Iran ⃝
M. Alizadeh, S. F. Bagheri and M. Khaleghy Moghaddam
(B)
M SE{F˜ (x)} =
n−1 nn α n ∑
Γ(n)
[ ]j 2 2 ln{1 − e−(λx) } j!
j=0
·
5
Γ(n − j) (αn)n−j
[ ]j −(λx)2 } n−1 ) ( ln{1 − e n n ∑ 2 α n α − 2 1 − e−(λx) Γ(n) j! j=0 }2α Γ(n − j) { −(λx)2 + 1 − e . (11) × (αn)n−j Proof. In case (A), one can easily find the mathematical expectations of ∑∞ aj E{f˜(x)}2 by substituting ea = j=0 j! . Then by using Theorem 1 and M SE{f˜(x)} = E{f˜(x)}2 − 2f (x)E{f˜(x)} + {f (x)}2 the proof is complete. Similarly, one can prove case (B).
3
UMVU Estimator of pdf and CDF
In this section, we find the UMVU estimators of pdf and CDF of GR distribution. Also we compute the MSEs of these estimators. Let X1 , . . . , Xn be a random sample of size n from the GR distribution with pdf (2) where λ is known. Then [ ∑ ] n ∑ ∏ n −(λxi )2 } x2i −(α−1) − i=1 ln{1−e −λ2 n i=1 e . f (x1 , . . . , xn ) = (2αλ ) ( xi )e 2 n
i=1
(12) { } 2 −(λx ) i Therefore, T = − i=1 ln 1 − e is a complete sufficient statistic for the unknown parameter α when λ is known. ∫ x Now, if h(·|t) is the pdf of X1 |T = t, then fˆ(x) = h(x|t) and Fˆ (x) = 0 fˆ(u)du are the UMVUEs of f (x) and F (x), respectively (see Mood et al., 1977). The following Lemma gives the pdf h(·|t). ∑n
Lemma 1. The conditional pdf of X1 given T = t is 2(n−1)λ2 xe−(λx)2 h(x|t) =
0
1−e−(λx)
2
[
·
2
t+ln{1−e−(λx) } tn−1
]n−2
,
− ln{1 − e−(λx) } < t < ∞ 2
O.W.
(13) J. Statist. Res. Iran 10 (2013): 1–22
6
Efficient Estimation of the Density and Cumulative Distribution Function . . .
Proof. Let Yi = − ln{1 − e−(λXi ) }, i = 1, . . . , n and T = Yi ∼ exp( α1 ), i = 1, . . . , n, T ∼ Gamma(n, α1 ) and 2
gY1 |T (y|t) =
(n − 1)(t − y) , tn−1
∑n
i=1 Yi .
Then
0 < y < t.
Therefore 2λ2 xe−(λx) −(λx)2 h(x|t) = fX1 |T (x|t) = }], 2 gY1 |T [− ln{1 − e −(λx) 1−e 2
which is complete the proof. Theorem 3. If we know T = t, then (A) fˆ(x) is UMVUE for f (x), where [ { }]n−2 −(λx)2 2 −(λx) t + ln 1 − e e fˆ(x) = 2(n − 1)λ2 x · , tn−1 1 − e−(λx)2 { } − ln 1 − e−(λx)
2
(B) Fˆ (x) is UMVUE for F (x), where { } n−1 2 t + ln 1 − e−(λx) , Fˆ (x) = t
< t < ∞.
(14)
{ } 2 − ln 1 − e−(λx) < t < ∞. (15)
Proof. By ∫ x using Lemma 1, the proof of case (A) is easy. Also by using Fˆ (x) = −1ln(1−e−(λx)2 ) h(x1 | t)dx1 the result of (B) is followed. In the following theorem we obtain the MSE of fˆ(x) and Fˆ (x). Theorem 4. The MSE of fˆ(x) and Fˆ (x) are given by { }2 −(λx)2 (n − 1) e 4 2 2 (A) M SE{fˆ(x)} = 4λ α x (n − 2) 1 − e−(λx)2 { } [ { }]i 2 2 α ln 1−e−(λx) −(λx) n−3 e ∑ −α ln 1 − e × i! i=0 { }2 2 2 n e−(λx) 4 2 (n − 1) α + 4λ x Γ(n) 1 − e−(λx)2 c 2013, SRTC Iran ⃝
M. Alizadeh, S. F. Bagheri and M. Khaleghy Moghaddam
7
{ 2n−4 }]j ∑ (2n − 4) [ { 2 × ln 1 − e−(λx) j j=1
× ×
Γ(n − j − 2) αn−j−2 { } [ { }]l 2 2 α ln 1−e−(λx) −(λx) n−j−3 e ∑ −α ln 1 − e l!
l=0
[ ]2 { } 2 2 α−1 − 2αλ2 xe−(λx) 1 − e−(λx) .
(B)
(16)
) 2n−2 ( }]j Γ(n − j) αn ∑ 2n − 2 [ { 2 ˆ M SE{F (x)} = 1 + ln 1 − e−(λx) Γ(n) j αn−j j=1
×
n−j−1 ∑ i=0
Proof. Let D = 2(n − 1)λ2 x write fˆ(x) =
D(t+b)n−2 , −b tn−1
} (−bα)i ebα { 2 2α − 1 − e−(λx) . i! 2
e−(λx) 2 1−e−(λx)
and b = ln(1 − e−(λx) ), then we can 2
< t < ∞. So we have
∫ E{fˆ(x)}2 =
∫ {fˆ(x)}2 g(t)dt =
= D2
αn Γ(n)
∫
∞(
−b ∞(
t+b t
∞
−b
D2 (t + b)2n−4 g(t)dt t2n−2
)2n−4
tn−3 e−αt dt
) b 2n−4 n−3 −αt =D 1+ t e dt Γ(n) −b t ( ) ( )j ∫ ∞ 2n−4 n ∑ α 2n − 4 b = D2 1+ tn−3 e−αt dt Γ(n) −b j t j=1 ∫ ∞ n α = D2 tn−3 e−αt dt Γ(n) −b ) ∞ ( n ∫ ∞∑ 2n − 4 j n−j−3 −αt 2 α +D b t e dt Γ(n) −b j 2
αn
∫
j=1
J. Statist. Res. Iran 10 (2013): 1–22
(17 )
8
Efficient Estimation of the Density and Cumulative Distribution Function . . .
∑ (−bα)i ebα α2 (n − 1)(n − 2) i! i=0 n 2n−4 ∑ (2n − 4) Γ(n − j − 2) n−j−3 ∑ (−bα)l ebα 2 α j +D b j Γ(n) αn−j−2 l! n−3
= D2
j=1
(18)
l=0
where we write the equation (18) by using the following formula ∫ c
∞
∑ (αc)i z n−1 αn −αz e dz = e−αc . Γ(n) i! n−1 i=0
Then by using M SE{fˆ(x)} = E{fˆ(x)}2 − {f (x)}2 the proof of case (A) is complete. Similarly, one can prove case (B). In the next section, we present the percentile method of estimation.
4
Estimators Based on Percentiles
If the data come from a distribution function which has a closed form, then it is quite natural to estimate the unknown parameters by fitting straight line to the theoretical percentile points obtained from the distribution function and the sample percentile points. Estimation based on percentiles was originally explored by Kao (1958, 1959), see also Mann et al. (1974) and Johnson et al. (1994) (Kundu and Raqab, 2005). An estimator is a statistic that specifies how to use the sample data to estimate an unknown parameter of the population (Mcclave, 1990). The GR distribution has the explicit distribution function, therefore in this case the unknown parameters α (λ is known), can be estimated by equating the sample percentile points with the population percentile points and it is known as the percentile method. For more discussion see AL-Naqeeb and Hamed (2009) and Zanakis and Mann (1982). Since { } 2 α F (x) = 1 − e−(λx) , if pi denotes some estimate of F (x(i) ), then the estimate of α (when λ is known) say α ˜ pc , can be obtained by minimizing
c 2013, SRTC Iran ⃝
0.05
0.020
M. Alizadeh, S. F. Bagheri and M. Khaleghy Moghaddam
~ MSE( f (X)MLE)
~ MSE(F(X)MLE)
0.010
0.015
^ MSE(F(X)UMVUE) ~ MSE(F(X)PCE) ~ MSE(F(X)LSE) ~ MSE(F(X)WLSE)
0.00
0.000
0.01
0.005
0.02
MSEf(x)
MSEF(x)
0.03
0.04
^ MSE( f (X)UMVUE) ~ MSE( f (X)PCE) ~ MSE( f (X)LSE) ~ MSE( f (X)WLSE)
5
10
15
20
25
30
35
40
5
10
15
20
0.20
~ MSE( f (X)MLE)
30
35
40
~ MSE(F(X)MLE)
0.010
0.015
^ MSE(F(X)UMVUE) ~ MSE(F(X)PCE) ~ MSE(F(X)LSE) ~ MSE(F(X)WLSE)
0.005
0.10
MSEF(x)
0.15
^ MSE( f (X)UMVUE) ~ MSE( f (X)PCE) ~ MSE( f (X)LSE) ~ MSE( f (X)WLSE)
0.00
0.000
0.05
MSEf(x)
25 n
0.020
n
5
10
15
20
25
30
35
40
5
10
15
20
0.20
~ MSE( f (X)MLE)
30
35
40
^ MSE(F(X)UMVUE) ~ MSE(F(X)PCE) ~ MSE(F(X)LSE) ~ MSE(F(X)WLSE)
0.00
0.015 0.000
0.005
0.010
MSEF(x)
0.10 0.05
~ MSE(F(X)MLE)
0.020
^ MSE( f (X)UMVUE) ~ MSE( f (X)PCE) ~ MSE( f (X)LSE) ~ MSE( f (X)WLSE)
0.15
25 n
0.025
n
MSEf(x)
9
5
10
15
20
25
30
n
35
40
5
10
15
20
25
30
35
40
n
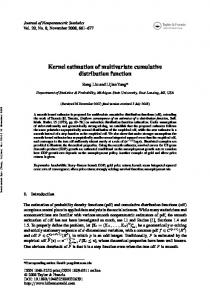
Figure 1. Comparison of MSEs of MLE, UMVUE, PCE, LSE and WLSE of pdf and CDF for (α, λ) = (1, 1), (1,2) and (2,2) based on simulation results, respectively.
J. Statist. Res. Iran 10 (2013): 1–22
10
Efficient Estimation of the Density and Cumulative Distribution Function . . .
n [ ∑
1 α
1 − pi − e
−(λxi )2
]2 (19)
.
i=1 i where pi = n+1 and X(i) ; i = 1, . . . , n denotes the ordered sample. So, to obtain the pc estimator of pdf and CDF, we use the same method as for the ML estimator. Therefore { } ˜ pc −1 2 2 α f˜pc (x) = 2α ˜ pc λ2 xe−(λx) 1 − e−(λx) , (20) { } ˜ pc 2 α F˜pc (x) = 1 − e−(λx) . (21)
Now we can simulate the expectation and the MSE of these estimators.
5 Least Squares and Weighted Least Squares Estimators In this section we provide the regression based method estimators of the unknown parameters, which was originally suggested by Swain et al. (1988) to estimate the parameters of beta distributions. It can be used for some other cases also. Suppose Y1 , . . . , Yn is a random sample of size n from a distribution function F (·) and suppose Y(i) ; i = 1, . . . , n denotes the ordered sample. The proposed method uses the distribution of F (Y(i) ). For a sample { } { } j(n−j+1) j and Var F (Y(j) ) = (n+1)2 (n+2) , see of size n, we have E F (Y(j) ) = n+1 Johnson et al. (1994). Using the expectations and the variances, two variants of the least squares methods can be used. The least squares estimators of the unknown parameters can be obtained by minimizing n { ∑ j=1
j F (Y(j) ) − n+1
}2 ,
(22)
c 2013, SRTC Iran ⃝
0.12
0.025
M. Alizadeh, S. F. Bagheri and M. Khaleghy Moghaddam
~ MSE( f (X)MLE)
~ MSE(F(X)MLE)
0.015
0.020
^ MSE(F(X)UMVUE) ~ MSE(F(X)PCE) ~ MSE(F(X)LSE) ~ MSE(F(X)WLSE)
0.00
0.000
0.02
0.005
0.010
MSEF(x)
0.06 0.04
MSEf(x)
0.08
0.10
^ MSE( f (X)UMVUE) ~ MSE( f (X)PCE) ~ MSE( f (X)LSE) ~ MSE( f (X)WLSE)
5
10
15
20
25
30
35
40
5
10
15
20
0.5
~ MSE( f (X)MLE)
30
35
40
0.020
^ MSE(F(X)UMVUE) ~ MSE(F(X)PCE) ~ MSE(F(X)LSE) ~ MSE(F(X)WLSE)
0.015
MSEF(x) 0.0
0.000
0.1
0.005
0.2
MSEf(x)
~ MSE(F(X)MLE)
0.010
0.4
^ MSE( f (X)UMVUE) ~ MSE( f (X)PCE) ~ MSE( f (X)LSE) ~ MSE( f (X)WLSE)
0.3
25 n
0.025
n
5
10
15
20
25
30
35
40
5
10
15
20
0.025
~ MSE( f (X)MLE)
30
35
40
^ MSE(F(X)UMVUE) ~ MSE(F(X)PCE) ~ MSE(F(X)LSE) ~ MSE(F(X)WLSE)
0.020 MSEF(x)
0.000
0.005
0.004 0.000
0.002
~ MSE(F(X)MLE)
0.015
0.008
^ MSE( f (X)UMVUE) ~ MSE( f (X)PCE) ~ MSE( f (X)LSE) ~ MSE( f (X)WLSE)
0.006
25 n
0.010
0.010
n
MSEf(x)
11
5
10
15
20
25
30
n
35
40
5
10
15
20
25
30
35
40
n
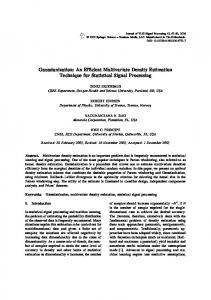
Figure 2. Comparison of MSEs of MLE, UMVUE, PCE, LSE and WLSE of pdf and CDF for (α, λ) = (0.5, 1), (0.5,2) and (2,0.5) based on simulation results, respectively.
J. Statist. Res. Iran 10 (2013): 1–22
12
Efficient Estimation of the Density and Cumulative Distribution Function . . .
with respect to the unknown parameters. Therefore in case of GR distribution the least squares estimators of α (when λ is known ), say α ˜ ls , can be obtained by minimizing n [{ } ∑ 2 α 1 − e−(λxi ) − j=1
j n+1
]2 (23)
.
So, to obtain the LS estimator of pdf and CDF, we use the same method as for the ML estimator. Therefore { } ˜ ls −1 2 2 α f˜ls (x) = 2˜ αls λ2 xe−(λx) 1 − e−(λx) , (24) { } ˜ ls 2 α . (25) F˜ls (x) = 1 − e−(λx) It is difficult to find the expectation and the MSE of these estimators by mathematical methods. So we calculate them by simulation study. The weighted least squares estimators of the unknown parameters can be obtained by minimizing n ∑
{ wj F (Y(j) ) −
j=1
j n+1
}2
with respect to the unknown parameters, where wj =
(26)
1 Var{F (Y(j) )}
=
(n+1)2 (n+2) j(n−j+1) .
Therefore in case of GR distribution the wighted least squares estimators of α (when λ is known), say α ˜ wls , can be obtained by minimizing n ∑ j=1
[{ wj
1−e
−(λx)2
}α
j − n+1
]2 .
(27)
So, to obtain the WLS estimator of pdf and CDF, we use the same method as for the ML estimator. Therefore { } ˜ wls −1 2 2 α f˜wls (x) = 2˜ αwls λ2 xe−(λx) 1 − e−(λx) , (28) { } ˜ wls 2 α F˜wls (x) = 1 − e−(λx) . (29) It is difficult to find the expectation and the MSE of these estimators by mathematical methods. So we calculate them by simulation study. c 2013, SRTC Iran ⃝
M. Alizadeh, S. F. Bagheri and M. Khaleghy Moghaddam
13
6 Comparison of UMVU, ML, PC, LS and WLS Estimators In order to get an idea of the efficiency of the five types of estimation, i.e., MLE, UMVUE, PCE, LSE and WLSE of pdf and CDF, we generat a sample of size n = 5, . . . , 40 from the generalized Rayleigh distribution with α = 0.5, 1, 2, 3 and λ = 0.25, 0.5, 1, 2, 3. In the following we present the algorithm of the simulation. Step 1. For a given α, λ and a random sample size n, we generate a random sample from GR(α, λ) and then we compute the estimates of α ^ ^ M LE , α P CE , α LSE , α^ W LSE ) based on this random sample. (α^ Step 2. By using the following formula, we compute the MSE of this generated random sample (in step 1) as
M SEM LE =
} ∑n { ^ M LE (x ) − f (x ) f i i i=1 n
( for UMVUE, PCE, LSE and WLSE is same). Step 3. We repeat Step 1 and Step 2 for M=1000 times. Step 4. We compute the mean of 1000 MSEs that get in Step 3. All programs are written by R software. It must be note that the method of simulation for estimation of pdf and CDF under PC, LS and WLS methods in Sections 6 and 7 is based nlm (or optim) function in R software.. From the Figures 1-3, it can be seen that ML estimators of pdf and CDF are more efficient than UMVU, PC, LS and WLS estimators, and UMVU estimators of pdf and CDF are more efficient than their PC, LS and WLS estimators. Likewise, PC estimators of pdf and CDF are more efficient than LS and WLS estimators and also LS estimators of pdf and CDF are more efficient than WLS estimators. Also, estimates of the pdf and CDF for (α, λ) = (1, 1), x = 0.7183677, 0.7938068, 0.2009447, 0.3132148, 0.6131950, 1.2569721 and n = 6 are given in Table 1. J. Statist. Res. Iran 10 (2013): 1–22
14
Efficient Estimation of the Density and Cumulative Distribution Function . . .
Table 1. Estimates of the pdf and CDF for (α, λ) = (1, 1), x = 0.7183677, 0.7938068, 0.2009447, 0.3132148, 0.6131950, 1.2569721 and n = 6. x
0.7183677
0.7938068
0.2009447
0.3132148
0.6131950
1.2569721
f (x) fe(x)
0.8575475
0.8454407
0.3859849
0.5678929
0.8420354
0.5178208
0.7853943
0.7398746
0.7211188
0.8148842
0.8331870
0.3851147
fb(x) fepc (x)
0.7883965
0.7229858
0.8706763
0.9762977
0.8725605
0.3379992
0.7342178
0.6811920
0.8562239
0.8855983
0.7993617
0.3357379
fels (x) fewls (x)
0.7086879
0.6534627
0.9103374
0.9084694
0.7797000
0.3150424
0.8254676
0.7912260
0.5775667
0.7217345
0.8502637
0.4381961
F (x) Fe(x)
0.40312772 0.46747698 0.03957442 0.09344492 0.31340321 0.79402055
Fb(x) Fepc (x)
0.57455566 0.63158114 0.09694979 0.20207383 0.48711490 0.87373647
Fels (x) Fewls (x)
0.5328776
0.5904600
0.1067103
0.1935265
0.4475802
0.8523099
0.5851582
0.6385730
0.1488317
0.2470529
0.5044062
0.8728036
0.6077247
0.6591211
0.1702605
0.2726886
0.5293805
0.8812286
0.47910847 0.54016565 0.07311319 0.14662773 0.39072940 0.82960266
7 Data Analysis and Discussion In this section, we use a real data set compute and compare the MLE, PCE, LSE and WLSE of pdf and CDF. The data is obtained from Ghitany et al. (2008). This data set represents the waiting times (in minutes) before service of 100 bank customers and they are as follows: 0.8, 0.8, 1.3, 1.5, 1.8, 1.9, 1.9, 2.1, 2.6, 2.7, 2.9, 3.1, 3.2, 3.3, 3.5, 3.6, 4.0, 4.1, 4.2, 4.2, 4.3, 4.3, 4.4, 4.4, 4.6, 4.7, 4.7, 4.8, 4.9, 4.9, 5.0, 5.3, 5.5, 5.7, 5.7, 6.1, 6.2, 6.2, 6.2, 6.3, 6.7, 6.9, 7.1, 7.1, 7.1, 7.1, 7.4, 7.6, 7.7, 8.0, 8.2, 8.6, 8.6, 8.6, 8.8, 8.8, 8.9, 8.9, 9.5, 9.6, 9.7, 9.8, 10.7, 10.9, 11.0, 11.0, 11.1, 11.2, 11.2, 11.5, 11.9, 12.4, 12.5, 12.9, 13.0, 13.1, 13.3, 13.6, 13.7, 13.9, 14.1, 15.4, 15.4, 17.3, 17.3, 18.1, 18.2, 18.4, 18.9, 19.0, 19.9, 20.6, 21.3, 21.4, 21.9, 23.0, 27.0, 31.6, 33.1, 38.5. In our brief calculations, the Kolmogorov–-Smirnov statistic computed about 0.09 under ML estimation, which means the GR distribution is fitted well to waiting time data. In the Table 2, we present the estimates of α, λ and corresponding logLikelihood of waiting time data. c 2013, SRTC Iran ⃝
M. Alizadeh, S. F. Bagheri and M. Khaleghy Moghaddam
15
Table 2. Estimate of parameters and corresponding log-Likelihood Estimate of α
Estimate of λ
Log-Likelihood
MLE
0.62953795
0.0694228
-321.5182
PCE
0.46099751
0.06123203
-324.5258
LSE
0.63949840
0.07699514
-322.8982
WLSE
0.65813752
0.07681339
-322.6398
In Figures 4, 5 and 6, we present Q-Q plot, different estimates of pdf along with histogram and the empirical CDF and fitted CDF of waiting time data, respectively. It indicates that the ML estimators provides better fit to waiting time data. Also in this case we considered some model selection criterias. The considered model selection criteria (MSCs) are ’pure’ Maximum Likelihood (ML), Akaike Information Criterion (AIC), corrected AIC (AICc), Bayes Information Criterion (BIC, also known as Schwarz Criterion), and HannanQuinn Criterion (HQC). The definitions used for the different MSCs are as: n , ML = -2 ln L(θ), AIC = -2 ln L(θ) + 2k, AICc = -2 ln L(θ) + 2k n−k−1 BIC = -2 ln L(θ) + k ln(n) and HQC = -2 ln L(θ) + 2 k ln{ln(n)}, where ln L(θ) denotes the log-Likelihood, n denotes the number of observations (i.e., the length of x) and k denotes the number of parameters of the distribution. For more discussion see Burnham (2004) and Fang (2011). In Table 3, we present the values of model selection criteria for waiting time data.
Table 3. The values of model selection criteria for waiting time data ML
AIC
BIC
AICc
HQC
643.0364
647.0364
652.2467
647.1601
649.1451
PCE
649.0517
653.0517
658.2620
653.1754
655.1604
LSE
645.7963
649.7963
655.0067
649.9201
651.9051
WLSE
645.2796
649.2796
654.4900
649.4034
651.3884
MLE
Also from Table 3, we conclude that all model selection criteria show that the ML estimators is better than the others. J. Statist. Res. Iran 10 (2013): 1–22
0.025
Efficient Estimation of the Density and Cumulative Distribution Function . . .
0.05
~ MSE( f (X)MLE)
~ MSE(F(X)MLE)
0.015
0.020
^ MSE(F(X)UMVUE) ~ MSE(F(X)PCE) ~ MSE(F(X)LSE) ~ MSE(F(X)WLSE)
0.00
0.000
0.01
0.005
0.02
MSEf(x)
MSEF(x)
0.03
0.04
^ MSE( f (X)UMVUE) ~ MSE( f (X)PCE) ~ MSE( f (X)LSE) ~ MSE( f (X)WLSE)
0.010
16
5
10
15
20
25
30
35
40
5
10
15
20
0.05
~ MSE( f (X)MLE)
30
35
40
~ MSE(F(X)MLE)
0.010
0.015
0.020
^ MSE(F(X)UMVUE) ~ MSE(F(X)PCE) ~ MSE(F(X)LSE) ~ MSE(F(X)WLSE)
0.00
0.000
0.01
0.005
0.02
MSEf(x)
MSEF(x)
0.03
0.04
^ MSE( f (X)UMVUE) ~ MSE( f (X)PCE) ~ MSE( f (X)LSE) ~ MSE( f (X)WLSE)
5
10
15
20
25
30
35
40
5
10
15
20
25
30
35
40
0.025
n
~ MSE( f (X)MLE)
~ MSE(F(X)MLE) ^ MSE(F(X)UMVUE) ~ MSE(F(X)PCE) ~ MSE(F(X)LSE) ~ MSE(F(X)WLSE)
0.015 0.000
0.005
MSEF(x)
0.020
^ MSE( f (X)UMVUE) ~ MSE( f (X)PCE) ~ MSE( f (X)LSE) ~ MSE( f (X)WLSE)
0.010
0.0000 0.0005 0.0010 0.0015 0.0020 0.0025 0.0030
n
MSEf(x)
25 n
0.025
n
5
10
15
20
25 n
30
35
40
5
10
15
20
25
30
35
40
n
Figure 3. Comparison of MSEs of MLE, UMVUE, PCE, LSE and WLSE of pdf and CDF for (α, λ) = (2, 1), (3,1) and (1,0.25) based on simulation results, respectively. c 2013, SRTC Iran ⃝
40 30 10 0
0
10
20
30
40
0
10
20
30
40
30
40
30 20 10 0
0
10
20
Fitted WLSE
30
40
data
40
data
Fitted LSE
17
20
Fitted PCE
20 0
10
Fitted MLE
30
40
M. Alizadeh, S. F. Bagheri and M. Khaleghy Moghaddam
0
10
20
30
40
0
10
20
data
data
0.07
Figure 4. Q-Q plot of waiting time data versus different estimators.
Estimated PDF MLE
0.06
Estimated PDF PCE Estimated PDF LSE
0.04 0.03 0.00
0.01
0.02
Estimated densitys
0.05
Estimated PDF WLSE
0
10
20
30
40
Waiting time data
Figure 5. Different estimates of pdf along with histogram of waiting time data.
J. Statist. Res. Iran 10 (2013): 1–22
Efficient Estimation of the Density and Cumulative Distribution Function . . .
1.0
18
Emprical CDF Estimated CDF MLE Estimated CDF PCE
0.8
Estimated CDF LSE
0.0
0.2
0.4
0.6
Estimated CDF WLSE
0
10
20
30
40
Waiting time data
Figure 6. The empirical CDF and fitted CDF of waiting time data.
8 Concluding Remarks Comparisons of the kind performed in Section 6 can be useful to find the best estimators for the pdf and the CDF. The best estimators for the pdf can be used to estimate functionals of the pdf like • the differential entropy of f defined by ∫ ∞ f (x) log f (x)dx; − −∞
• the negentropy defined by ∫ ∞ ∫ f (x) log f (x)dx − −∞
∞
ϕ(x) log ϕ(x)dx,
−∞
where ϕ(·) denotes the standard normal pdf; • the R´enyi entropy defined by 1 log 1−γ
∫
∞
f γ (x)dx
0 c 2013, SRTC Iran ⃝
M. Alizadeh, S. F. Bagheri and M. Khaleghy Moghaddam
19
for γ > 0 and γ ̸= 1; • the Kulback-Liebler divergence of f from an arbitrary pdf f0 defined by { } ∫ ∞ f (x) f (x) ln dx; f0 (x) −∞ • the Fisher information defined by ∫
∞
−∞
[
]2 ∂ f (x; θ) f (x; θ)dx, ∂θ
where θ is a parameter specifying the pdf. The best estimators for the CDF can be used to estimate functionals of the CDF like • cumulative residual entropy of F defined by ∫ ∞ {1 − F (λ) + F (−λ)} log {1 − F (λ) + F (−λ)} dλ; 0
• the quantile function of F defined by F −1 (·); • the Bonferroni curve defined by ∫ p 1 F −1 (t)dt, pµ 0 where µ = E(X); • the Lorenz curve defined by ∫ 1 p −1 F (t)dt, µ 0 where µ = E(X). The best estimators for both the pdf and the CDF can be used to estimate functionals of the pdf and the CDF like J. Statist. Res. Iran 10 (2013): 1–22
20
Efficient Estimation of the Density and Cumulative Distribution Function . . .
• probability weighted moments defined by ∫ ∞ xF r (x)f (x)dx; −∞
• the hazard rate function defined by f (x) ; 1 − F (x) • the reverse hazard rate function defined by f (x) ; F (x) • the mean deviation about the mean defined by ∫ ∞ 2µF (µ) − 2µ + 2 xf (x)dx, µ
where µ = E(X).
Acknowledgement The authors would like to thank the referees, the Associate Editor and the Editor for careful reading and for their comments which greatly improved the paper.
References AL-Naqeeb, A.A. and Hamed, A.M. (2009). Estimation of the Two Parameters for Generalized Rayleigh Distribution Function Using Simulation Technique, International Journal of Pure and Applied Sciences and Technology, 22, 246-256. Asrabadi, B.R. (1990). Estimation in the Pareto Distribution, Metrika, 37, 199-205. Bagheri, S.F., Alizadeh, M., Baloui Jamkhaneh, E. and Nadarajah, S. (2013a). Evaluation and Comparison of Estimations in the Generalized Exponential-Poisson Distribution. Journal of Statistical Computation and Simulation, http://dx.doi.org/10.1080/00949655.2013.793342. c 2013, SRTC Iran ⃝
M. Alizadeh, S. F. Bagheri and M. Khaleghy Moghaddam
21
Bagheri, S.F., Alizadeh, M. and Nadarajah, S. (2013b). Efficient Estimation of the PDF and the CDF of the Exponentiated Gumbel Distribution. Communications in StatisticsSimulation and Computation, to appear. Burnham, K.P. and Anderson, D.R. (2004). Multimodel Inference: Understanding AIC and BIC in Model Selection, Sociological Methods and Research, 33, 261-304. Dixit, U.J. and Jabbari Nooghabi, M. (2010). Efficient Estimation in the Pareto Distribution, Statistical Methodology, 7, 687-691. Dixit, U.J. and Jabbari Nooghabi, M. (2011). Efficient Estimation in the Pareto Distribution with the Presence of Outliers, Statistical Methodology, 8, 340-355. Fang, Y. (2011). Asymptotic Equivalence between Cross-Validations and Akaike Information Criteria in Mixed-Effects Models, Journal of Data Science, 9, 15-21. Ghitany, M.E., Atieh, B. and Nadarajah, S. (2008). Lindley Distribution and Its Application, Mathematics and Computers in Simulation, 78, 493-506 Johnson, N.L., Kotz, S. and Balakrishnan, N. (1994). Continuous Univariate Distribution, Vol. 1, 2nd edition, Wiley, New York. Jabbari Nooghabi, M. and Jabbari Nooghabi, H. (2010). Efficient Estimation of pdf, CDF and rth Moment for the Exponentiated Pareto Distribution in the Presence of Outliers, Statistics, 44, 1-20. Kao, J.H.K. (1958). Computer Methods for Estimating Weibull Parameters in Reliability Studies, Transaction of IRE-Reliability and Quality Control, 13, 15-22. Kao, J.H.K. (1959). A Graphical Estimation of Mixed Weibull Parameters in Life Testing Electrontubes, Technometrics, 1, 389-407. Kundu, D. and Raqab, M.Z. (2005). Generalized Rayleigh Distribution: Different Methods of Estimation, Computational Statistics and Data Analysis, 49, 187-200. Mann, N.R., Schafer, R.E. and Singpurwalla, N.D. (1974). Methods for Statistical Analysis of Reliability and Life Data, Wiley, New York. Mcclave, T. (1990). Probability and Statistics for Engineers, 3rd Edition, Pws-Kent publishing company, Boston. Mood, A.M., Graybill, F.A. and Boes, D.C. (1977). Introduction to the Theory of Statistics. 3rd ed, McGraw-Hill Book, Company, New York. Mudholkar, G.S. and Srivastava, D.K. (1993). Exponentiated Weibull Family for Analyzing Bathtub Failure-Real Data, IEEE Transaction Reliability, 42, 299-302.
J. Statist. Res. Iran 10 (2013): 1–22
22
Efficient Estimation of the Density and Cumulative Distribution Function . . .
Mudholkar, G.S., Srivastava, D.K. and Freimes, M. (1995). The Exponentiated Weibull Family: A Reanalysis of the Bus-Motor-Failure Data, Technometrics, 37, 436-445. Raqab, M.Z., Kundu, D. (2006). Burr Type X Distribution: Revisited, Journal of Probability and Statistical Science, 4, 179-193. Swain, J., Venkatraman, S. and Wilson, J. (1988). Least Squares Estimation of Distribution Function in Johnson’s Translation System, Journal of Statistical Computation and Simulation, 29, 71-297. Surles, J.G. and Padgett, W.J. (2001). Inference for Reliability and Stress-Strength for a Scaled Burr Type X Distribution, Lifetime Data Analysis, 7, 187-200. Surles, J.G. and Padgett, W.J. (2005). Some Properties of a Scaled Burr Type X Distribution, Journal of Statistical Planning and Inference, 128, 271-280. Zanakis, Stelios H. and Mann, Nancy R. (1982). A Good Simple Percentile Estimator of the Weibull Shape Parameter for Use When All Three Parameters Are Unknown, Naval Research Logistics, 29, 419-428.
Mojtaba Alizadeh Department of Statistics, Shahid Bahonar University of Kerman, Kerman, Iran. email: alizadeh mojtaba
[email protected]
Seyyed Fazel Bagheri Department of Statistics, Shahid Beheshti University, Tehran, Iran. email: f
[email protected]
Mohsen Khaleghy Moghaddam Department of Basic Sciences, Faculty of Agriculture Engineering, Sari Agriculture Sciences and Natural Resources University, Sari, Iran. email:
[email protected]
c 2013, SRTC Iran ⃝