an assistance system for the industrial large circular knitting process. An assistance .... The acquired image consists of dark pixels for the yarn material and bright.
Efficient Image Processing System for an Industrial Machine Learning Task Kristijan Vukovic1 , Kristina Simonis2 , Helene D¨orksen1 , and Volker Lohweg1 1
2
inIT - Institute Industrial IT, Ostwestfalen-Lippe University of Applied Sciences, D-32657 Lemgo, Germany ITA - Institute for Textile Technology, RWTH Aachen, D-52074 Aachen, Germany
Abstract. We present the concept of a perceptive motor in terms of a cyber-physical system (CPS). A model application monitoring a knitting process was developed, where the take-off of the produced fabric is controlled by an electric motor. The idea is to equip a synchronous motor with a smart camera and appropriate image processing hard- and software components. Subsequently, the characteristics of knitted fabric are analysed by machine-learning (ML) methods. Our concept includes motor-current analysis and image processing. The aim is to implement an assistance system for the industrial large circular knitting process. An assistance system will help to shorten the retrofitting process. The concept is based on a low cost hardware approach for a smart camera, and stems from the recent development of image processing applications for mobile devices [1–4].
1
Introduction
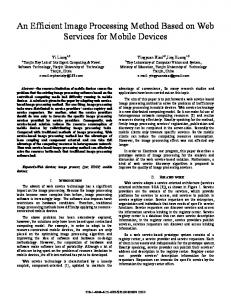
Knitted fabrics are composed of one or more threads or of one or more thread systems creating a textile fabric by loop formation. Knitted fabrics can be subdivided into weft and warp knitted fabrics [5]. Weft knitted fabrics are produced by individually moving needles forming stitches successively, whereas in warp knitting all the needles are moved together synchronously. There are basically three different structural elements that make up the weft knitting patterns: knit, tuck and miss (see Fig. 1). The knitting process has to be set up after changing either yarn, parameters or patterns. There are four important set-up parameters for the knitting process: yarn tension, sinking depth (mesh height), production speed as well as the tension to the fabric controlled by the take-down motor. Investigations have shown that the setting of the take-down rollers driven by an electronic motor affects the length of the loops directly. The knitting process has to be adjusted manually by an operator. In doing so, the operator sets up the parameters according to his mostly longtime experience. In times of demographic change and skills shortage the defects as well as the machine set-up process in case of material or pattern change is to be systemised. A new approach at inIT and ITA is to combine the assisting system and Machine Learning concept with the knitting process in order to save time and
Front side
Knit a)a) Masche
Tuck b)b)Henkel
Miss c)c) Rundlauf
Reverse side
d) Light microscopy picture (Knit elements)
Fig. 1. (a)-(c) weft knitting elements [6]. Light microscopy picture of weft knitted fabric - just knit elements (d).
costs in the knitting retrofitting process of circular knitting machines. The idea is to equip a synchronous motor with sensors, aiming at realising a perceptive motor, which can feel and see, in terms of a cyber-physical system (CPS). The theoretical background for a feeling motor is described in [7]. That work shows that it is possible to use a motor as a sensor while it is running and doing its usual work. Due to its parallel function as a sensor and actor, the motor can be regarded as an entity that can feel what it is doing. The approach is based on the analysis of the motor currents. It was originally developed for machine-health monitoring to detect the beginning of damages in the bearings at the shaft of the motor before it harms the motor and the devices linked to it. The approach can be adapted to other tasks than health monitoring, e.g. feeling the force at the shaft of the take-down motor in a knitting-machine to draw conclusions about the expansion of the material. Further developments of ML approaches for machinehealth monitoring are presented in [8, 9]. It investigates monitoring in Big Data environments [8] and automated performance of machine-health diagnosis [9]. We expect the techniques presented in [7–9] to be suitable for the monitoring of the feeling motor in the knitting process. In the frame of this paper, we concentrate on the realisation of the vision part. In the context of that, image processing methods are required. This paper shows an approach for the recognition of different fabrics and a possibility to measure its expansion during the production process via efficient image processing methods. Machine-Learning methods will be needed in order to realise such a system. The features of all possible produced fabric types need to be learned. This includes the feature extraction for the classification of the fabric as well as the measurement of the expansion. This work shows a practical image processing application as part of a CPS for a knitting process. Because high costs are a barrier for image processing systems in the knitting industry, this approach aims at low complexity to ensure a time- and cost-efficient development in the future. In Sec. 2 the image processing approach is described. The proper illumination concept for the recording of the knitted fabric images and the extraction of three features to classify different fabrics will be described. Furthermore, a method for the measurement of the expansion of fabric loops on image basis is shown. Additionally, the evaluation of the classification for four different knitted fabrics is shown in Sec. 3. This paper concludes in Sec. 4 and provides an outlook.
2
Approach
By a defined requirement a CPS should be able to adapt to new tasks on a low complexity level. In this case the developed system must be able to handle the switch from one fabric to another without time loss or date processing effort. To achieve this, the system needs to know the possible fabric characteristics. The first two steps are to extract features for the classification of the different fabrics and to learn a classifier to detect the right product. The third step is to estimate the expansion, as described above, for the fabric. After these steps are done, the system works like described in Fig. 2. The fabric is analysed by image processing methods and the characteristics are classified. The result of a target performance comparison can be used either for a recommendation to the operator, or for a direct command to the electric motor to speed up or to slow down.
Analyse Fabrics / Get Features
Fabric Classification
Target Performance Comparison
Recommendation/ Action
Fig. 2. System workflow. The fabric is analysed by image processing methods. A classification is done to detect the occurring product. Then a target performance comparison is done. Finally the output results in a recommendation or an action.
2.1
Image Processing
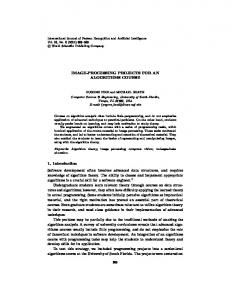
Image processing techniques are used to retrieve features for the classification of the knitted fabric. A central aspect of every image processing task is the illumination concept. For the analysis of textiles a diffuse backlight is used [10]. This avoids shadows and reflections [11]. Furthermore, the surrounding illumination is negligible because the backlight illumination shines directly into the camera lens. The acquired image consists of dark pixels for the yarn material and bright pixels for the pores, see Fig. 3. Firstly an image gets preprocessed by low-level image processing methods. A median filter is applied for de-noising of the image and an auto-contrast function is applied to optimise the image values [12, 13]. The segmentation of the image is carried out by a thresholding technique. The optimal threshold value is calculated by Otsu’s method [14]. Due to the illumination concept, the image has a bi-modal grayscale distribution. Thus Otsu’s method is suitable for this application. The result of the first steps can be seen in Fig. 3. In the following all connected regions in the binary image need to be labelled [12, 13]. The global image information and the knowledge about the labelled regions are used to calculate features for the classification of the fabric. Theoretical foundations regarding feature extraction can be found in [15]. A
wale
pilot approach was based on the local recognition of the pore shapes. First investigations show that the pores of different fabrics are too similar for proper classification. Instead of this, the entire image is analysed. Trials showed that the number of pores, the yarn fineness, and the average pore size in the image are appropriate features to classify a knitted fabric.
course (a) Wale and course direction
(b) Image of knitted fabric
a
(c) Image after the preprocessing
(d) Image after the segmentation with Otsu’s method
Fig. 3. Visualisation of the first image processing steps. On the left a legend for the wale- and course-direction of the images is shown (a). The images (b)-(d) show a fabric (b), the preprocessed image of the fabric (c), and the binarised image after the segmentation (d).
Feature Extraction As described in the previous section, features for the classification task are extracted by analysing the global image. The features that are used in this work will be described in the following. The Euler number (NE ) is the total number of connected regions in an image (NR ) excluded the number of holes (pores) in each region (NH ) [13]. It is described by the equation: NE = NR − NH . In this application, the Euler number provides the number of pores per image. If the pore sizes of two fabrics are different, investigations show that the number of pores are different, too, see Fig. 4 (b) and (c). In this case the Euler number for both fabrics differ. Furthermore, two different fabrics may have a similar number of pores in the image, see Fig. 4 (c) and (d), and Fig. 5 (a). In this case the yarn fineness (dark pixel) differs. The total number of black pixels (NBP ) in the segmented image is an indicator for the amount of yarn. It is calculated by counting the zero-elements in the m by n binary-image matrix:
NBP =
m X n X {xij = 0}.
(1)
i=1 j=1
As a third feature, the average pore size in the image is used. It can be calculated by counting the ones in the m by n binary-image matrix divided by the total number of regions (pores).
0mm
3mm
6mm
(a)
(b) Fabric 1
(c) Fabric 2
(d) Fabric 3
(e) Fabric 4
Fig. 4. Images of four different fabrics (b)-(c) with the measuring scale (a).
Pm Pn
j=1 {xij
i=1
NAvgP S =
= 1}
NR
.
(2)
These three features are used to classify the four different knitted fabrics shown in Fig. 4. Four classifiers (Na¨ıve Bayes, support-vector machine, decision tree, 3-nearest-neighbours [16]) were tested to obtain the classification rates for the features and to estimate the best of the four classifiers. The results are shown in Sec. 3.
130 Fabric 1 Fabric 2 Fabric 3 Fabric 4
120
Euler number
110 100
#103 4.5
3.5
pore area
3.0
90
2.5
80
2.0
70
1.5
60 50
1.0
40
0.5
30 0.4
Fabric 1 Fabric 2 Fabric 3 Fabric 4
4.0
0.6
0.8
1
1.2
1.4
amount of yarn (a)
1.6
1.8 #105
0 0.4
0.6
0.8
1
1.2
1.4
amount of yarn
1.6
1.8 #105
(b)
Fig. 5. Representation of classes in a 2D feature space. The left figure (a) shows the amount of yarn vs. Euler number. The right figure (b) shows the amount of yarn vs. pore area. In both cases there are four clusters, each consisting of elements of the same class that corresponds to one of the four kinds of fabric.
2.2
Expansion Measure
Once the classification of different knitted fabrics is finished, it is possible to define quality parameters for each fabric in wale direction. One potential parameter
is the expansion of the fabric during production, controlled by an electric motor. If a textile material is stretched, the pore size increases in stretch direction (wale direction). Perpendicular to that direction—in course direction—the pore size decreases. The expansion of the material can be measured by the width-to-height ratio of the pore. This can be calculated by the Bounding-Box function. After the labelling of the regions in the binary image, a pore is represented as a region R. Then the Bounding Box for a pore is defined as follows [13]:
BoundingBox(R) = (mmin , mmax , nmin , nmax )
(3)
where mmin , mmax and nmin , nmax are the minimal and maximal coordinates for all pixel (xm , xn ) ∈ R. With these values it is possible to calculate the height H , a value for the expansion (E) is (H) and width (W) of a pore. By dividing W calculated. To gain robustness, the arithmetic mean of all pores in one image is calculated instead of using only one pore, see Eq. (4). A visualisation of the method can be seen in Fig. 6 (b).
E=
H arithm W arithm
(4)
The expansion measure is implemented on resource-efficient hardware with an Android OS. It is integrated in a demonstrator, see Fig. 6 (a).
2.1
Camera
W
2.05 2
H
value of E
1.95 1.9
1.85 1.8
1.75
Backlight
0cm
F
1.7 1.65 1.6
(a) Demonstrator concept drawing
0 0.5 1 1.5 2 2.5 3 3.5 4 4.5 5 5.5
expansion in cm
35cm
(b) Bounding Box visualisation
(c) Measuring points
Fig. 6. Concept drawing of the demonstrator, side view (a). Visualisation of the expansion measure approach with a Bounding Box (b). Measurement points visualising a continuous stretched fabric, recorded with the demonstrator (c).
3
Classifier Evaluation
A test set has been created in order to evaluate the classification rates of the extracted features and to estimate the best out of four classifiers. This set contains 20 images for each of the four textiles shown in Fig. 4. According to this, there are 80 objects in total, distributed over four classes. The representation of the classes in the feature space with the calculated features is shown in Fig. 5. For the classification of the knitted fabrics, four classifiers were tested. The learning and the classification were carried out automatically in the frame of K-fold cv paired t test for generalisation [16] with K = 10, i.e., in each fold 90% of the objects are considered for the training and the rest for the validation. The tested classifiers are Na¨ıve Bayes, support-vector machine, decision tree and the 3-nearest-neighbours classifier [16]. The results of the evaluation can be seen in Tab. 1. The probabilistic-based Na¨ıve Bayes and the rule-based decision tree yield the best performance. Table 1. Classification results in the frame of K-fold cv paired t test for the four textiles shown in Fig. 4. Classifier Na¨ıve Bayes Support-Vector Machine Decision Tree 3-Nearest-Neighbours
4
Accuracy Standard Deviation 100% +/- 0% 81,25% +/- 6,25% 98,75% +/- 3,75% 92,50% +/- 8,29%
Conclusion and Outlook
This work shows a system that combines machine learning and image processing and applies it to a knitting process. It shows a suitable illumination concept for the analysis of knitted fabrics and suggests a proper method for the segmentation of images of different knitted fabrics. Furthermore, this work suggests three possible features for the classification of knitted fabrics. The extracted features are evaluated with four classifiers. In addition an approach is shown, measuring the expansion of the fabric during the production process. As a next step it is planned to implement the classification approach shown in this paper on resource-efficient hardware. In future work the image-processing application can be extended with more functionality, e. g. defect detection. In addition to this, the concepts shown in [7–9] need to be adapted to resource efficient hardware. These two methods will be combined and coupled with a motor. It results in a seeing and feeling drive in terms of a CPS. The demonstrator shown in Fig. 6 will be furnished with an additional force meter in order to quantify the influence of fabric tension on the alternation of loop length. The implementation
of the system into the inner cylinder of a large circular knitting machine at ITA is planned. In particular, the online measurement technology can be established due to the mesh structure resembling between weft and warp knitted fabrics in the field of knitted fabrics. Acknowledgement This work is in part founded by the leading-edge clusterproject itsowl-TT-kapela, grant. no. 02PQ3062.
References 1. R. Hildebrand, J. L. Hoffmann, E. Gillich, H. D¨ orksen, and V. Lohweg, Smartphones as Smart Cameras - Is It Possible? Lemgo, Germany: inIT - Institute Industrial IT, Ostwestfalen-Lippe University of Applied Sciences, 2012. 2. V. Lohweg, J. L. Hoffmann, H. D¨ orksen, R. Hildebrand, E. Gillich, J. Hofmann, and J. Schaede, Banknote Authentication with Mobile Devices. Lemgo, Germany and Lausanne, Switzerland: inIT - Institute Industrial IT, Ostwestfalen-Lippe University of Applied Sciences, 2013. 3. K.-T. Cheng and Y.-C. Wang, Using Mobile GPU for General-Purpose Computing - A Case Study of Face Recognition on Smartphones. University of California, Santa Barbara, CA, USA, 2011. 4. C.-Y. Fang, W.-H. Hsu, C.-W. Ma, and S.-W. Chen, A Vision-based Safety Driver Assistance System for Motorcycles on a Smartphone. 2014. 5. DIN, Textilen. Grundbegriffe. Berlin: Beuth-Vertrieb GmbH, 1969. 6. K. P. Weber, Wirkerei und Strickerei. Frankfurt am Main: Deutscher Fachverlag GmbH, 2004. 7. M. Bator, A. Dicks, U. M¨ onks, and V. Lohweg, Feature Extraction and Reduction Applied to Sensorless Drive Diagnosis. Lemgo, Germany: inIT - Institute Industrial IT, Ostwestfalen-Lippe University of Applied Sciences, 2012. 8. H. D¨ orksen, U. M¨ onks, and V. Lohweg, “Fast classification in industrial Big Data environments,” in Emerging Technology and Factory Automation (ETFA), 2014 IEEE, pp. 1–7, 2014. 9. H. D¨ orksen and V. Lohweg, “Automated Fuzzy Classification with Combinatorial Refinement,” in Emerging Technology and Factory Automation (ETFA), 2015 IEEE, 2015. 10. B. Neumann, Bildverarbeitung f¨ ur Einsteiger: Programmbeispiele mit Mathcad. Berlin Heidelberg: Springer, 1 ed., 2005. 11. A. Kumar, Computer Vision-based Fabric Defect Detection: A Survey. New Delhi, India: IEEE Xplore, 2008. 12. K. D. T¨ onnies, Grundlagen der Bildverarbeitung. M¨ unchen: Pearson Studium, 1 ed., 2005. 13. W. Burger and M. J. Burge, Digitale Bildverarbeitung. Berlin Heidelberg: Springer, 1 ed., 2005. 14. N. Otsu, A Threshold Selection Method from Gray-Level Histogramms. Tokyo, Japan: IEEE Xplore, 1979. 15. I. Guyon, S. Gunn, M. Nikravesh, and L. A. Zadeh, Feature Extraction: Foundations and Applications (Studies in Fuzziness and Soft Computing). Secaucus, NJ, USA: Springer-Verlag New York, Inc, 2006. 16. E. Alpaydin, Introduction to Machine Learning. Cambridge, Massachusetts - London, England: The MIT Press, 2 ed., 2010.