Dept. of Computer Science and Engineering ... tant problems being accelerated by incorporating vari- .... port temporal information to the degree the developer.
Efficient Runtime Performance Monitoring of FPGA-based Applications
Joseph M. Lancaster Jeremy D. Buhler Roger D. Chamberlain
Joseph M. Lancaster, Jeremy D. Buhler, and Roger D. Chamberlain, “Efficient Runtime Performance Monitoring of FPGA-based Applications,” in Proc. of 22nd IEEE Int’l System-on-Chip Conf. (SoCC), September 2009, pp. 23-28.
Dept. of Computer Science and Engineering Washington University in St. Louis
EFFICIENT RUNTIME PERFORMANCE MONITORING OF FPGABASED APPLICATIONS Joseph M. Lancaster� Jeremy D. Buhler� and Roger D. Chamberlain Dept. of Computer Science and Engineering Washington University in St. Louis, St. Louis, MO USA {lancaster, jbuhler, roger}@wustl.edu
Abstract
graphics card connected to HyperTransport (HT) via a PCIe bus, and an FPGA card connected via a PCI-X bus.
Embedded computing platforms have long incorporated non-traditional architectures (e.g., FPGAs, ASICs) to combat the diminishing returns of Moore’s Law as applied to traditional processors. These specialized architectures can offer higher performance potential in a smaller space, higher power efficiency, and competitive costs. A price is paid, however, in development difficulty in determining functional correctness and understanding the performance of such a system. In this paper we focus on improving the task of performance debugging streaming applications deployed on FPGAs. We describe our runtime performance monitoring infrastructure, its capabilities and overheads on several different configurations of the monitor. We then employ the monitoring system to study the performance effects of provisioning resources for Mercury BLASTN, an implementation of the BLASTN sequence comparison application on an FPGA-accelerated system.
I.
Introduction
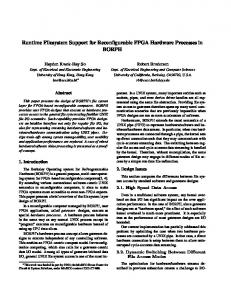
High-performance embedded computing platforms have demonstrated excellent performance for many applications. Typically, these systems are under tight power and performance constraints and utilize specialized architectures and platforms. Research has shown important problems being accelerated by incorporating various specialized architectures along with traditional chip multi-processors (CMPs). El-Ghazawi et al. [5] recently published a comprehensive discussion of the applicability of FPGAs to high-performance computing applications. We refer to such systems as architecturally diverse. An interesting open problem is how best to harness the power of such systems effectively. Researchers generally rely on ad-hoc methods to build such systems, and these methods lack many staples of traditional computing platforms such as robust debugging and performance analysis tools. Figure 1 shows an example of a diverse system constructed using dual-core AMD Opterons, an off-the-shelf
��������������������������������������
��
DRAM
CMP
DRAM
DRAM
CMP
HT
core core
core core
HT
HT
PCI-X
PCIe
FPGA
GPU DRAM SRAM
Figure 1: Example of a diverse computing system.
While the above example illustrates a multiple chip design, system-on-chip designs share many similarities, especially when considering the FPGA portion of the design. For instance, many SoC designs utilize FPGAs to prototype circuits which will eventually become an ASIC. Our infrastructure can be included as part of the prototype implementation for a system-on-chip design, enabling performance characterization on large datasets. Applications expressed by streaming semantics fit these systems particularly well because of the segmented memories and explicit expression of both pipelined and wide parallelism. Generally, streaming applications can be thought of as coarse-grained dataflow computations in which computation blocks, or kernels, are interconnected by arcs over which data is communicated. An example application topology is illustrated in Figure 2. The output data stream from block A is delivered as an input stream to block B, etc. Inside each block, data is consumed from the input arc(s), some computation is performed, and the results are sent along the outgoing arc(s). C A
B
E D
Figure 2: Sample streaming application.
In most streaming languages (e.g., Brook [3], StreamIt [9]), the computation within the blocks and their interconnections are all expressed in a common language. In the Auto-Pipe environment [6], block computations are expressed in the native language of the computational resource(s) onto which the block is allocated. Diverse computing systems can make use of a software profiler (e.g. gprof, valgrind) for the portion of the application deployed onto processor cores, but these “profilers” are generally agnostic to non-traditional computing components that comprise diverse systems. Typically simulation or emulation is used to understand the performance of these black-box components. However, both these methods are typically too slow to allow for extensive testing of large datasets. This paper describes our runtime monitor that profiles the performance of FPGA designs. The focus of the performance monitor is on the communication between blocks. This allows it to be used in conjunction with a development environment such as Auto-Pipe, which supports a variety of languages for block development. Our infrastructure provides statistics that allow the developer to determine the bottleneck (due to either communication or computation) of an FPGA application dynamically during execution as well as facilitating accurate provisioning of FPGA resources. This is enabled through targeted collection of a range of standard performance metrics in addition to application-specific measurements in a semi-automated fashion.
II.
Related Work
While tools such as Synopsys Identify and Xilinx ChipScope do provide some visibility into FPGA designs, they are focused on verifying correct operation, not on measuring performance. Performance monitoring, in contrast to functional debugging, focuses less on individual occurrences of events and more on collecting and aggregating information to characterize the performance of an application on a particular system. In [7], Koehler et al. discuss a pair of trade-offs associated with performance monitoring in reconfigurable systems. First, they describe the inherent tradeoff between impact and fidelity, and second, they also describe the tradeoff between adaptability and convenience. The impact vs. fidelity tradeoff positions a monitor in the space between trying to minimize the perturbation of the system being monitored and trying to maximize the total amount of performance data being collected. The adaptability vs. convenience tradeoff describes the ability of the user to observe a desired signal relative to the ease of use of the monitoring system as a whole. Koehler et al. then continue with a description of a
��
system they have under construction for monitoring of FPGA-based applications authored in VHDL. While both systems allow the user to adjust the fidelity of the data collection (and thereby implicitly adjust the potential impact), we can compare our system with theirs by contrasting the approach each system has taken with respect to the second tradeoff, adaptability vs. convenience. The system described in [7] can monitor arbitrary interior details within an FPGA design. It instruments the design at the language level, and allows for monitoring (either via profiling or tracing) of any signals, variables, or component ports available in the HDL source files. Our system, on the other hand, constrains itself to the data streams between blocks in a streaming programming paradigm. As such, it is language-agnostic and does not require near the detailed setup as their system. In short, their system aims for greater adaptability at the expense of convenience, while our system aims for convenience at the expense of adaptability. As both systems are still under construction, it is premature to assess whether one of these approaches is superior to the other, and it is quite reasonable to believe that they might both have their place.
III.
Runtime Monitor Design
By authoring applications in a streaming manner, some basic structure is provided, while supporting a large range of applications. A major goal of this work is to enable capabilities analogous to a software profiler that is aware of the entire diverse computing system.
A.
Monitoring Requirements
One popular (and sensible) approach to monitoring the performance of a program is to aggregate performance information over the entire run of a dataset. The aggregate information is output at the end of the run and shown to the developer. Aggregate results can truly be beneficial to the user: they can be used to check the validity of analytic models or simply alert the developer to unexpected performance issues. Unfortunately, this approach misses a key piece of information: when do performance anomalies occur during the run? On the other hand, one can imagine a system where every datum is accompanied by meta-data that describes its performance at every step of the algorithm. Attempting to monitor programs at this granularity is also an infeasible task but for the most trivial of programs and performance metrics because of computational and bandwidth restrictions of real systems. The above two approaches can be viewed as being at opposite ends of a spectrum of information resolu-
tion. Aggregate statistics have very limited information concerning the temporal properties of the execution, while cycle-accurate traces have complete information but high collection overhead. Fortunately, we are not limited to either end of this spectrum. Our runtime performance monitoring tool is able to aggregate or report temporal information to the degree the developer desires up to the limit that resources allow. In addition to providing temporal performance information, the FPGA performance monitor is able to measure and aggregate various aspects of the design depending on the desires of the developer. For example, in the case of streaming applications, there are typically queues present as part of the communication link implementation between the output port of one block and the input port of another block. These queues, when combined with communication link information, can directly lead to conclusions about the location(s) of bottlenecks in the design. Other metrics of interest might be the fraction of back pressure (or busy) signals asserted, or metrics describing the state of the communication links. These aggregated performance data are delivered out of the FPGA periodically, which each period referred to as a frame.
B.
Architecture
Figure 3 shows a high-level block diagram of a simple streaming application instrumented with our performance monitoring infrastructure. The hardware design executes as if there is no performance monitoring infrastructure. Data flows into the FPGA (from, e.g., a processor core), the application executes at full speed and the application results are streamed out to a downstream component. Measurement begins when data arrives to the user applications and ends when the stream ends. The performance monitor multiplexes the performance results into the output stream. Hence, the amount of meta-data generated by the performance monitor should be minimized in order to minimize interference. After the performance meta-data is retrieved, post-processing tasks combine the results from each frame and the performance of the application over time for each measurement is presented to the user for analysis. Instead of monitoring arbitrary signals in the application, our performance monitor focuses on the I/O links to and from the FPGA fabric and the state of the queues in front of each block. To enable the above, the performance monitor taps low-level signals used to implement the inter-block queues and processor-FPGA communication paths. While the taps are currently inserted manually, these low-level signals are all under the control of the development environment in the Auto-Pipe sys-
��
Figure 3: Overview of the performance monitor.
tem, which will enable automated instrumentation. This configuration enables quick determination of where the bottleneck lies at any point of the execution. To enable on-chip data aggregation, the performance monitor currently supports the following operations on taps over each frame period: min, max, count, mean, and histogram. The user can specify combinations of the above taps via simple operators to implement more aggressive data aggregation. Currently, the monitor implementation supports basic arithmetic operators (e.g., addition, subtraction, multiplication and division) as well as logical operators (e.g., AND, OR, NOT). For instance, to implement a queue occupancy histogram function, one can tap the read and write signals for a queue. Then, increment the occupancy value of the queue for every clock cycle that the write signal is active and decrement when read is active. Finally, a histogram operator is fed the result of the above (i.e. per-cycle occupancy count) and aggregates it into a set of ordered bins. In this way complex measurement functions can be built to measure application specific performance attributes. Figure 4 shows the block diagram of the performance monitor. Note that Figure 4 is drawn to show only four tap monitors, any number up to the resource limitations are supported. The operation of the monitor is controlled by a set of commands under processor control. Commands trigger operations such as resetting the monitor, enabling and disabling individual tap monitors, setting the reporting frame period, and triggering an additional report from one or more tap monitors. The tap router module is responsible for choosing and routing the subset of application taps necessary for the operation of each tap monitor. The output of the tap router is the exact set of signals that each tap monitor requires. A tap monitor implements one specific performance monitoring task, ranging from a simple counter to a more complex combination of operations as described previously. After evaluation of the performance metric, the result is stored in the meta-data storage block. Our performance monitoring system is flexible in the type of storage allowed. The system will choose the appropriate storage type given the memory requirements of
Figure 4: Detailed view of the performance monitor architecture shown with four tap monitors. Data paths are shown as dark lines, control paths are grey lines.
the operation. For evaluation operations with moderate storage needs, such as a histogram, on-chip Block RAMs are preferred since they run at high clock frequencies and have large capacities. Other storage options are allowed, ranging from custom-generated distributed RAM implementations to off-chip SRAMs or SDRAMs. Since each tap monitor may, in general, operate concurrently, there are two levels of multiplexing necessary to send data out. First, the performance monitor chooses which tap monitor is allowed to send a report. Then the report must be inserted into the data stream. Tap monitors are generally serviced in round-robin order but a single monitor can be given priority over the others. This policy is fair under normal conditions but also allows the user to inspect a single tap monitor more frequently if they suspect data or system-drive events are causing rare events on that monitor. Large FPGA designs often utilize more than one clock domain. The performance monitor supports monitoring these designs by operating each tap monitor at the clock speed of the application being monitored. The rest of the performance monitor is operating at a nominal clock frequency appropriate for reporting results. The clock for the storage module is multiplexed back into the domain of the performance monitor for reporting. If the user wishes to measure signals from different clock domains within a single tap, either a simple double D flip-flop synchronizer is used for a single-bit signal or an asynchronous FIFO is provided for buses. The monitor operates at the fastest clock frequency of all the tapped signals’ clocks.
C.
Performance and Overhead
The performance of the monitoring circuit can be characterized by the maximum operating frequency of the circuit, the fraction of the total execution that can be monitored, as well as the resource overhead required to implement it. To determine the operating frequency of
��
the performance monitor, the monitor circuit was instantiated on a simple adder block as the user application. The number and type of monitoring operations was varied to quantify the effects on the operating frequency. The circuit was synthesized using Synplify Premier DP v9.6.2 and placed and routed using Xilinx ISE v10.1i, targeting a Virtex 4 LX100 FPGA. Table 1 shows the results. The maximum operating frequency stays almost constant throughout the range implying that the monitor is scalable. We anticipate that these numbers will be hard to achieve on FPGA designs that utilize near 100% of the chip. In these cases manual placement might be necessary if high clock frequencies are required. Currently, the critical path is limited by an addition to update the value in the histogram table. If 18 bits are used instead, a single queue monitor can run faster than 330 MHz. Table 1: Maximum achievable clock frequencies �rounded to the nearest integer) for three configurations of the performance monitor. The results are shown for a Xilinx Virtex 4 LX100 speed grade 12 FPGA.
Configuration 1: 1 queue monitor 2: 4 queue monitors 3: 8 queue monitors and 16 averagers
fmax (MHz) 256 255 252
Our performance monitoring infrastructure is capable of a 100% duty cycle, able to capture performance information across the entire execution of a program. In addition, the performance monitor is capable of monitoring while reporting results from the previous frame. In order to assess the overhead of utilizing the performance monitor, designs were built using the same monitoring set up as in Table 1. Table 2 shows the available resources required to implement the different monitor configurations. The resource utilization increases mostly linearly as more monitoring components are added. Even in the most aggressive case (configuration �3), our total resource utilization is less than 10% in all categories which we deem acceptable for development purposes. Also note that Block RAM usage can be traded for LUTs if a design is resource constrained in that category.
IV.
Results: Empirical Measure ment of Mercury BLASTN
In this section, we demonstrate our measurement infrastructure by characterizing the performance of a streaming, FPGA-based implementation of the BLASTN tool for DNA similarity search. We show that we can extract performance data from this application with low
Table 2: Performance monitor resource overhead for the same three configurations as in Table 1. Numbers in parenthesis below the resource type show the total number of each resource available on the LX100 FPGA.
Config. � 1 2 3
LUTs (98,304) 1655 (1.7�) 3732 (3.8�) 8584 (8.7�)
FFs (98,304) 1260 (1.3�) 2466 (2.5�) 4776 (4.9�)
RAMB16s (240) 2 (0.83�) 8 (3.3�) 16 (6.6�)
overhead, and that the results quantify the effects of provisioning different queue sizes of BLASTN.
A.
The BLASTN Application
BLAST, the Basic Local Alignment Search Tool [1], is widely used by molecular biologists to discover relationships among biological (DNA, RNA, and protein) sequences. The BLAST application compares a query se quence q to a database D of other sequences, identifying all subject sequences d ∈ D such that q and d have small edit distance between them. The edit distance is weighted to reflect the frequency with which different mutations, or sequence changes, occur over evolutionary time. The BLASTN variant of BLAST expects both query and database to contain DNA sequences, which are strings composed of the four bases A, C, G, and T . The BLAST application is a critical part of many computational analyses in molecular biology, including recognition of genes in a genome, assignment of biological functions to newly discovered sequences, and clustering large groups of sequences into families of evolutionarily related variants. The last decade of advances in high-throughput DNA sequencing have led to exponential increases in the sizes of databases, such as NCBI GenBank [8], used in these analyses, and in the volume of novel DNA sequence data to be analyzed. BLASTN is conceptually a streaming application, composed of a 3-stage pipeline of increasingly expensive but increasingly accurate search operations performed on a database stream. In stage 1, BLASTN detects short exact substrings, or words, that are common to both the query and a database sequence, using a hash table of all words in the query. In stage 2, the region surrounding each word is searched to detect pairs of longer substrings that differ by just a few base mismatches. Finally, the small fraction of words that generate such an “ungapped” pair are passed to stage 3, which searches the region around them for pairs of substrings with small edit distance, allowing for base substitutions, insertions, and deletions. Only matches that pass this final stage are reported to the user.
��
B.
Mercury BLASTN: a Performance Test Case
Mercury BLASTN [4] accelerates the BLASTN algorithm using a diverse architecture consisting of both an FPGA and general-purpose CPUs. The FPGA is used for the first two stages of the BLASTN computation, which dominate the running time, while the last stage is assigned to a processor. Each FPGA-based stage is internally pipelined and parallelized at a fine grain. In particular, stage 1 is divided into two parts: stage 1b implements the BLASTN query hash table in SRAM attached to the FPGA, while stage 1a hashes the same query words into a Bloom filter [2], a “lossy” lookup table that can be implemented efficiently internally to the FPGA. Stage 1a proves that most words in the database do not occur in the query, passing only a few percent of the database’s words through to the SRAM lookup of stage 1b. The original implementation of Mercury BLASTN [4] was designed to carefully balance the loads on the various stages so that no one stage was too great a bottleneck. A deep understanding of application performance was achieved by studying a near-cycle-accurate simulator of the implementation written in C. However, the original design has since been ported to a new, more modern FPGA hardware platform that changes the clock speeds of most components and greatly alters the properties (latency, bandwidth, etc.) of the attached SRAM. Rather than resurrect and modify the old simulator, we will use our new measurement infrastructure to directly interrogate the behavior of the new implementation. Mercury BLASTN was tested using the NCBI mammalian RefSeqs1 as the database, with queries sampled from non-mammalian RefSeqs2 . The hardware platform consists of 2 quad-core AMD Opteron CPUs running at 2.4 GHz, 16 GB of system RAM, running CentOS 5.3 operating system. The FPGA card contains an Xilinx Virtex 4 LX100 speed grade 12 part and communicates with the processors via PCI-X bus running at 133 MHz. Mercury BLASTN contains over 20 queues. These queues can consume significant resources if they are over-provisioned. We will utilize our monitoring infrastructure to tune the queue sizes. One potential performance issue with Mercury BLASTN is a high latency SRAM might require a large buffer for high throughput operation. There is a queue, we’ll call it the SRAM queue, in front of the SRAM to buffer words from stage 1a while the SRAM is processing older words. Our goal is to size this queue so that it handles the majority (90%) of the cases without over-utilizing resources. 1 ftp://ftp�ncbi�nih�gov/refseq/release/vertebrate mammalian/ 2 ftp://ftp�ncbi�nih�gov/refseq/release/vertebrate other/
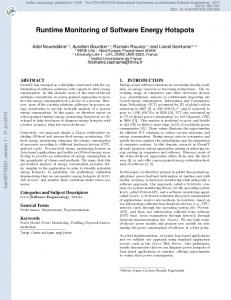
We begin this investigation with a likely over sized queue of size 512, based on our understanding of the application. Due to the latency of the SRAM, up to 28 more entries might fill the queue after it asserts back pressure. This effectively makes the queue size 484, with 28 slots being reserved for in-flight SRAM responses, and 484 slots for smoothing out bursty application behavior. This queue is then instrumented with our monitor to record a cycle-accurate histogram of the queue occupancy over the entire experiment listed above. Figure 5 shows the results. From this data, we concluded that we may be able to significantly reduce the size and with nominal performance loss since the majority of the time the queue occupancy is much less than 484.
V.
Conclusions
There is a clear need for better tools for developing on diverse computing systems. In this paper we have introduced our performance monitoring infrastructure for online monitoring of streaming FPGA applications and demonstrated its use on a complex diverse application, Mercury BLASTN. Our system is able to instrument any streaming application, monitor its performance with minimal overhead, and present the developer with valuable insight into the performance-limiting aspects of the design. We are currently exploring ways to make application instrumentation more automated and expand the runtime functionality to validate user-specified performance assertions.
Acknowledgments This research has been supported by NIH grant R42 HG003225 and NSF grants CCF-0427794, CNS0720667, CNS-0751212, and DBI-0237902.
References [1] S. F. Altschul, W. Gish, W. Miller, E. W. Myers, and D. J. Lipman. Basic local alignment search tool. Journal of Molecular Biology, 215:403–10, 1990. [2] B. Bloom. Space/time trade-offs in hash coding with allowable errors. CACM, 13�7):422–426, May 1970.
Figure 5: Measurement results from measuring the SRAM queue of total size 512. The top graph shows the normalized histogram of the counts of queue occupancy over the entire execution. The bottom graph shows the cumulative fraction of the queue occupancy.
The total number of cycles to execute the run was 8.6176 × 10¹⁰ , which was obtained by summing the number of cycles in every bin. From Figure 5, we can estimate that decreasing the queue to 128 (an effective length of 100) we will increase the runtime by approximately 2�, while utilizing 1/4 the amount of resources. To verify this, we repeated the experiment with the SRAM queue size set to 128. This configuration took 8.6788 × 10¹⁰ cycles to finish, a decrease in performance of 0.7�, even better than expected. From this we are satisfied that we have struck an acceptable balance of resource utilization and performance for this queue. While this study focused on one queue, a similar procedure can be used to simultaneously monitor multiple queues allowing for resource provisioning and performance tuning application-wide.
��
[3] I. Buck, T. Foley, D. Horn, J. Sugerman, and K. Fatahalian. Brook for GPUs: Stream computing on graphics hardware. ACM Trans. on Graphics, 23�3):777–786, Aug. 2004. [4] J. D. Buhler, J. M. Lancaster, A. C. Jacob, and R. D. Chamberlain. Mercury BLASTN: Faster DNA sequence comparison using a streaming hardware architecture. In Proc. of Recon figurable Systems Summer Institute, July 2007. [5] T. El-Ghazawi, E. El-Araby, M. Huang, K. Gaj, V. Kindratenko, and D. Buell. The promise of high-performance reconfigurable computing. IEEE Computer, 41�2):69–76, Feb. 2008. [6] M. A. Franklin, E. J. Tyson, J. Buckley, P. Crowley, and J. Maschmeyer. Auto-pipe and the X language: A pipeline design tool and description language. In Proc. of Int’l Parallel and Distributed Processing Symp., Apr. 2006. [7] S. Koehler, J. Curreri, and A. D. George. Performance analysis challenges and framework for high-performance reconfigurable computing. Parallel Computing, 34�4-5):217–230, May 2008. [8] National Center for Biological Information. Growth of GenBank, 2002. http://www�ncbi�nlm�nih�gov/Genbank/ genbankstats�html. [9] W. Thies, M. Karczmarek, and S. Amarasinghe. StreamIt: A language for streaming applications. In Proc. of 11th Int’l Conf. on Compiler Construction, pages 179–196, 2002.