2011 International Conference on Environment Science and Engineering IPCBEE vol.8 (2011) © (2011) IACSIT Press, Singapore
Effluent quality performance of horizontal subsurface flow constructed wetlands using natural zeolite (escott)
Shuib, N.
Davies, W.R.
School of Engineering, Deakin University, Pigdons Road, Geelong, Victoria 3217 Australia e-mail:
[email protected]
School of Engineering Deakin University, Pigdons Road, Geelong, Victoria 3217 Australia e-mail: warren. davies @deakin.edu.au
Baskaran, K.
Muthukumaran, S
School of Engineering, Deakin University University, Pigdons Road, Geelong, Victoria 3217 Australia e-mail:
[email protected]
Victoria University, PO Box 14428 Melbourne Victoria 8001 Australia
[email protected]
Abstract—The objective of the present study was to assess the simultaneous removal of physiochemical parameters in moderate strength wastewater using a lab scale horizontal subsurface flow constructed wetland (CW). The wetland was constructed using natural zeolite as a substrate. In this study, high-density polyethylene tanks (0.36 m2) were planted with phragmites australis and scirpus maritimus. The system was subjected to two hydraulic retention times for (HRT) 4 and 3 days respectively. Averaged data reported coincided with the plant age (4 to 39 weeks) and covered the entire cold season and early part of the hot season. The physico-chemical characteristics of the wastewater changed significantly as the wastewater flowed through the respective wetland cells. Based on the 39 weeks of operation, the CW unit with zeolite achieved significantly higher removal for COD, ammonium and total nitrogen at 4 and 3 days HRT. This unit was highly effective in removing COD, NH4-N, TN, and TSS compounds which were found to be 89%, 99%, 96% and 956% respectively at 4 days HRT. At 3 days HRT, the removal was slightly changed to be 85 %, 99.6%, 91% and 91.3% for COD, NH4-N, TN, and TSS. A simple mineralogical survey of filter materials for the zeolites may render many installations of constructed wetlands successful.
wastewater will come into contact with a network of aerobic, anoxic and anaerobic zones. Major design parameters, removal mechanisms and treatment performance of HFCW have been reviewed [1, 3, 4, 5, 16,]. Due to long retention times the HFCW can provide a reliable secondary level of treatment with regard to organic matter (OM) and total suspended solids (TSS) [6, 7, 19]. It is well documented that the effectiveness of OM and TSS in HFCW varied from 72.0% to 95.0% for suspended solids, 71.2–94.1% for BOD5 and from 59.7% to 89.0% for COD ) [15]. The use of natural zeolites in environmental applications is spreading due to their properties and significant worldwide occurrence. They are natural materials mined in various deposits and can also be produced synthetically to tailor the properties for specific application. Natural zeolites are crystalline, hydrated alumino-silicates of alkali and earth metals that possess infinite, strong, open, one or threedimensional crystal structure [9, 15]. Natural zeolites have a high ability of riveting microorganisms and removing ammonia and ammonia nitrogen from fluid solutions especially in wastewater treatment [10, 19]. Natural zeolites, in particular clinoptilolite,have been studied extensively for the removal of pollutants from wastewater due to their wide availability and low cost [11,13,15]. The main zeolite property exploited in wastewater treatment processes is the ammonium cation (NH4+) exchange ability [15]. The purpose of this study was to evaluate the performance of zeolite as single filter media in treating moderate strength wastewater influent. The main objectives of the present study were: (1) to evaluate the effect of different retention times for the treatment process and (2) to compare the quality improvement using different substrates. Focus on physiochemical parameters of the wetland outflow after 10 months operation was a priority.
Keywords- Zeolite; Constructed wetland; Hydraulic retention time; Horizontal subsurface flow; Nitrogen
I.
INTRODUCTION
Horizontal subsurface flow constructed wetlands (HSCW) have long been used primarily for treatment of municipal or domestic wastewaters. However, at present, constructed wetlands are used for a wide variety of pollution, including agricultural and industrial wastewaters, various runoff waters and landfill leachate [16]. In the horizontal flow systems (HF), the wastewater is fed via an inlet that continues its way under the surface of the bed in a more or less horizontal path until it reaches the outlet zone. During this passage the
19
II.
MATERIALS AND METHOD
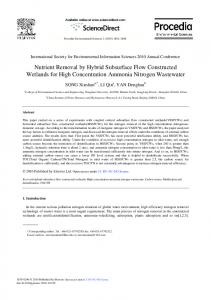
Two similar lab-scale horizontal subsurface flow Constructed Wetland (HFWC) units were constructed and operated for approximately 10 months and are still in operation. This is preliminary research of a much larger project containing singles, series HFCW and hybrid CWs. Each HFWC unit was made of high-density polyethylene 0.36 m2 with a depth of 0.44. The HFCW unit was divided into three sections by introduction of baffles into the tank to produce a zigzag flow. The HFCW units were filled with different substrate; being either zeolite (2 – 5 mm) or gravel (10 mm). Cobbles (10 - 30 mm) were filled at the inlet and outlet zone for both units. The substrate (zeolite and gravel) was filled to a height of 0.4 m. The type of natural zeolite used in this study was escott. Its main composition provided by the supplier, was: SiO2 68.26%, AlO3 12.99%, FeO3 1.37%, CaO 2.09%, K2O 4.11% MnO 0.06 %, MgO 0.83% and LOI 8.87%. The HFCW unit with gravel (G) was used as a control media in the system. Two plants were used for both units, namely the common reed (R, Phragmites australis) and Scirpus maritimus. The plants were collected from watercourses in the vicinity of the laboratory in Geelong, Victoria, Australia. The influent was pumped by peristaltic pumps through the both HFWC units and the water level during the experiment was kept constant at a height of 0.35 m. The hydraulic retention time in the HFCW bed was increased over time. A schematic of the experimental layout is shown in Fig. 1. The system was kept in an indoor area and was supplied by 80 Watt Philips Ecotone high lumen twister hydroponic light at day time with cool daylight 6500K. The HFCW units (zeolite (ZU) and gravel (GU)) were fed with synthetic wastewater, which was designed and used to simulate the characteristics of domestic wastewater. The synthetic wastewater contained organic substances and a source of nitrogen, phosphorus and other elements. The organic substances used were peptone (100 mg/L), with a typical inlet concentration of BOD and COD approximately 300 mg/L and 450 mg/L, respectively. The source of phosphorus was hydrogen potassium phosphate (K2HPO4) with a typical inlet concentration of 16 mg/L PO4-P. The source of nitrogen was urea with a typical inlet concentration of 80 mg/L NH4–N. The flow of synthetic wastewater ranged from 0.012 m3/d to 0.03 m3/d with residence times varying from 3 to 4 days. Surface organic loadings (mean) was 0.026 kg COD (m2/d)-1to 0.035 kg COD (m2/d)-1 and introduced continuously at the inflow pipes of the wetlands. Synthetic wastewater was used in this study to minimize variations of influent characteristics, safety of laboratory personnel, and solves the problem of transferring significant volumes of wastewater from a distant treatment plant.
Baffles
Inlet
Water level 40mm
50mm 360mm 440mm
40mm 30mm 180mm
Pump
180mm
180mm
HFCW with zeolite Outflow
Influent
tank
30mm
Pump
HFCW with gravel
Outflow
Fig.1: Experimental layout
The experiment works were carried out from January 2010 to the end of October 2010. Averaged data reported coincided with the plant age (4 to 39 weeks) and covered the entire cold season and early part of the hot season. The system was subject to two hydraulic retention time (HRT) of 4 and 3 days. Influent and effluent samples from both units (Z and G) were analysed immediately after sampling. All samples were analysed weekly for the following parameters; COD, TN, total-P, NH4-N, TSS (total suspended solid), conductivity, pH, temperature and dissolve oxygen All parameters were determined based on the methods shown in Table 1. Table1. The parameters and experiment methods used Parameters COD TN Total-P NH4-N Conductivity pH Temperature TSS Dissolved oxygen
20
Methods of experiment Merck Cell Test 1.14541 Merck Cell test 1.14763 Merck Cell test 1.14729 Merck Cell test 1.14763 Conductivity meter WTW LF330 pH meter WTW 320 pH meter WTW 320 Standard Method (1998) DO meter WTW Oxi320
Table 2. Statistic of overall influent and effluent concentrations and removal efficiencies in zeolite HFCW unit for both HRT Parameters
4 Days Retention Time Influent concentration (mg/L)
COD
TN
Total-P
NH4-N
Mean SD Min Max Mean SD Min Max Mean SD Min Max Mean SD Min Max
443 20.725 380 473 96 15.964 79 123 10.14 1.113 8 11 53 3.23933 48 59
Effluent concentration (mg/L) ZU GU
53 36.635 22 137 1 1.4574 0.80 8 14 1.4448 12 16 0.5000 0.0002 0.50 0.80
98 47.341 34 178 58 34.060 5 99 13 1.3813 12 16 56 3.640 50 62
3 Days Retention Time Removal (%) ZU
GU
88 7.711 72 95 96 2.971 90 99.00 -40 14.430 -56 -16 98 0.5774 98 99
78 10.652 60 92 43 27.679 15 94 -33 22.242 -69 -9 -6 3.750 -15 -0.8
For testing statistical significance, student’s t-test was applied. Independent sample t-test at a significance level of 0.05 was applied to the removal efficiencies of COD, TN, TP and NH4-N for both HFCW units over the ten months monitoring period. All statistical analyses were performed using SPSS 17.0 for Windows. III.
Influent concentration (mg/L)
412 19.287 385 434 87 8.02366 79 106 17 1.05281 16 19 57 2.2955 55 64
Effluent concentration (mg/L) (ZU) (GU)
60 15.2539 35 84 9 6.37330 2 20 20 1.74213 18 23 0.2 0.23593 0.10 0.85
27 21.498 13 91 78 3.512 71 92 0.5 0.1812 0.3 0.9 57 2.7701 52 61
Removal (%) (ZU)
(GU)
85 4.11444 78 92 89 7.92530 76 84 -20 2.992 17 25 99 2.146 60 68
93 5.697 77 97 11 4.714 4 21 -18 10.869 -34 -6 -11 3.574 -17 -7
nitrogen in studied types of constructed wetlands varied between 40 and 50% [16]. Organic matter removal (COD) in the ZU remained steady during both the 4 and 3 day HRT. Mean COD removal slightly decreased by about 3% and reached 85% (88% at 4 days HRT). On contrary to ZU, GU was significantly increased the COD removal when the HRT decreased. The COD removal was 78% at 4 days HRT and increased to 93% at 3 days HRT. The COD removal in this study was within the range of results found by other worldwide researchers. The COD removal varied between 64% and 82 % respectively [17] Phosphorus removal in the ZU and GU was significantly lower than NH4-N, TN and COD. The TP removal for ZU was -40 % and -20 % for 4days and 3 days HRT. For GU, the removal was -33 % at 4 day s HRT and -18% at 3 days HRT. Contrary to NH4-N, TN and COD, TP showed significant variations during the operation period, reflected in the relatively high standard deviation values, especially for the 4 days HRT. It is possible that these variations occurred because bacteria and the plants responsible for phosphate removal performed less efficiently in the lower temperatures when the experiment was performed. The negative minimum values in the removal performance may be due to litter decomposition and phosphorus release back into the system. Similar behaviour was observed for total phosphorus (TP), which is the sum of P-PO43- and particulate phosphorus (PP). TP is partially removed by sedimentation, by reacting with porous media minerals [4]. P-PO43- is mainly removed by plant uptake and adsorption onto the porous media [4]. Reducing conditions (i.e., lack of oxygen, DO concentrations below 0.1 mg/L) can lead to solubilisation of minerals and release of dissolved phosphorus [4, 14]
RESULTS AND DISCUSSION
In order to determine performance of HFCW units, comparison were made between the influent and effluent. Table 2 presents the results for the influent and effluent concentrations and percent removal statistics (i.e., mean value, standard deviation, minimum and maximum values) of the ZU and GU at 4 days and 3 days HRT. The ZU showed the greatest removal efficiency for NH4-N at both HRTs. The mean removal efficiency of NH4-N for ZU at 4 days and 3 days HRT was near to 100 % removal. In this study, the reduction of HRT did not give effect to the removal of NH4-N in ZU. This unit also showed relatively stable removal during the entire operation period, evidenced from low standard deviation values (Table 2). Highest ammonia removal values could be explained by the fact of complete ammonification of organic nitrogen and sufficient nitrification in the system. The ZU also showed significant removal efficiencies for TN. TN removal was higher at 4 days HRT compared to 3 days HRT. TN removal for 4 days HRT was 96 % and 89 % for 3 days HRT. Compared to ZU, the TN removal in GU was lower at both HRT. The removal of TN in GU was only 43% at 4 days HRT and decreased to 11% at 3 days HRT. This is the case in most wetland systems, and it probably occurs because nitrogen removal requires longer HRTs. Beside HRT, TN removal also was influenced by the type of CWs due to their inability to provide both aerobic and anaerobic conditions at the same time. Removal of total
21
Table 3. Statistic of overall influent, effluent and removal efficiencies for physiochemical parameters in zeolite and gravel HFCW unit for both HRT Parameters
4 Days Retention Time Influent concentration (mg/L)
COD
TN
Total-P
NH4-N
Mean SD Min Max Mean SD Min Max Mean SD Min Max Mean SD Min Max
443 20.725 380.00 472.50 96.35 15.964 79.00 122.50 10.14 1.113 8.20 11.30 53.0125 3.23933 47.85 59.45
Effluent concentration (mg/L)
(ZU) 53 36.635 22.00 137.00 1.3775 1.4574 0.80 7.50 14.096 1.4448 11.90 16.40 0.5000 0.0000 0.50 0.50
(GU) 98 47.341 34 178 58 34.060 5 99 13 1.3813 12 16 56 3.640 50 62
3 Days Retention Time Removal (%)
(ZU) 88.31 7.711 72.10 94.90 96.17 2.971 89.70 99.00 -40.03 14.430 -56.25 -15.70 99.0533 0.5774 98.96 99.16
(GU) 78 10.652 60 92 43 27.679 15 94 13 22.242 12 16 -6 3.750 -15 -0.8
Table 3 contains mean removal values of physiochemical parameters, such as electricity conductivity (EC), pH, dissolved oxygen (DO), temperature and total suspended solids (TSS) for both unit (zeolite and gravel ) at both HRT. The average EC of the effluent for ZU were 1090.77 ± 46.08 µS/cm and 1369.04 ± 79.87 µS/cm for 4 days and 3 day HRT. These values were slightly increased as compared to the values for the influent (1084.33±46.24 µS/cm and 1212.2 ± 41.42µS/cm) at 4 and 3days HRT. For the GU, the removal efficiencies decreased with the HRT to negative values from -0.64 ± 6.09 µS/cm at 4 days and to -12.89 ± 4.25 µS/cm for the 3 days HRT. EC in both units showed significant variations during the operation period, as shown by the relatively high standard deviation values. Increased evapotranspiration and/or movement of substrate by plant roots may have accounted for this effect [2]. Figure 2 shows the conductivity variation along the entire HFCW units for both HRT. Total suspended solids (TSS) include all particles suspended in water that will not pass through a filter. In constructed wetlands, TSS are removed mainly by physical processes such as sedimentation and filtration [4] followed by aerobic or anaerobic microbial degradation inside the substrate [8]. These processes are achieved when the wastewater passes through the system at a low velocity because of the presence of vegetation and the substrate [4]. The TSS concentrations in this study remained relatively stable over the course of the sampling season. The TSS removal ranged between 90 % to 96% for both units and their HRT. The TSS removal efficiencies observed in both units were within the range of results found by other researchers using similar systems. The TSS removal from several studies ranged between 72% to 95% [8, 15, 16] Average temperature in influent and effluent of both units were comparable during both HRT. The temperature ranged from 14⁰C to 20 ⁰C,
Influent concentration (mg/L)
Effluent concentration (mg/L)
(ZU) 60 15.2539 34.50 83.50 8.9107 6.37330 1.95 20.00 20.3500 1.74213 18.10 23.20 0.1958 0.23593 0.10 0.85
412 19.287 384.50 434.00 87.4286 8.02366 78.50 106.00 16.9750 1.05281 15.90 19.25 57.1500 2.29555 54.70 63.50
(GU) 27 21.498 13 91 78 3.512 71 92 0.5 0.1812 0.3 0.9 57 2.7701 52 61
Removal (%)
(ZU) 85 4.11444 78.30 91.90 89.4429 7.92530 75.80 84 20 2.992 17 25 63 2.146 60 68
(GU) 93 5.697 77 97 11 4.714 4 21 -18 10.869 -34 -6 -11 3.574 -17 -7
respectively. In this study temperature was determined not to be statistically significant for the removal of the physiochemical parameters. Results showed DO varied significantly for the ZU. The average DO concentration in the ZU was 3.82 mg/L and 2.04 mg/L at 4 days and 3 days HRT respectively. The average DO levels in the GU at 4 and 3 days HRT remain almost constant. The DO value for this unit was 3.5 mg/L and 3.06 mg/L, respectively and results suggested that the extent of biodegradation and oxygen consumption was highest in the ZU. The pH of the ZU remained relatively neutral, fluctuating between 7.0 and 7.77 with an average of 7.48 for HRT 4 days. For 3 days HRT, the pH value in ZU was between 7.38 and 7.57 with an average of 7.46. Contrasting to the ZU, pH in GU was more alkalised with an average of 8.15 in the 4 days HRT and 8.0 in 3 days HRT. On the whole, pH values tend to be kept in the neutral or slightly basic zone, possibly due to interactions between the substrate and a biofilm in the treatment system. Results of independent t-tests (p< 0.005) indicated a significant reduction of COD, TN, TP and NH4-N at 4 and 3 days HRT for both HFCW units. The removal efficiencies of both HFCW units (zeolite and gravel) showed differences for all evaluated parameters during treatment at 4 and 3 days HRT. Figure 3 compare the variation of COD, TN, TP and NH4-N removal in zeolite and gravel HFCW unit along the treatment for 4 and 3 days HRT. IV.
CONCLUSSION
Two lab-scale horizontal subsurface flow constructed wetlands using natural zeolite-filters were operated for approximately 10 months and showed a satisfying removal efficiency of organic matter, TN and ammonia. Removal efficiencies proved to be considerably high for these parameters, while removal rates of phosphorus appeared to be lower than those of nitrogen. The zeolite and gravel
22
HFCW unit showed significant differences in the ability to reduce COD, TN, TP and NH4-N at the 4 and 3 days HRT. Zeolite-filters proved to substantially improve the effluent quality of the constructed wetlands These results suggest that it is possible to use zeolite as a filter media for better quality effluent of wastewater.
[18] D., Zhanga, R. M., Gersbergb, and S. K., Tan,. “Constructed wetlands in China”, Ecological Engineering, vol. 35, (2009) pp. 1367– 1378,DOI: 10.1016/j.ecoleng.2009.07.007 [19] F., Zurita, J., De Anda, .M. A., Belmont,” Treatment of domestic wastewater and production of commercial flowers in vertical and horizontal subsurface-flow constructed wetlands”, Ecological Engineering, vol.35,2009,pp.861-869, DOI: 10.1016/j.ecoleng.2008.12.026
REFERENCES [1]
[2]
[3] [4] [5]
[6]
[7]
[8] [9]
[10] [11] [12]
[13]
[14]
[15]
[16]
[17]
P. F., Cooper, G. D., Job, M.B.,Green, R. B. E., Shutes, “Reed Beds and Constructed Wetlands for Wastewater Treatment”, WRc Publications, Medmenham, Marlow, UK, 1996 K.R. Hench, G.K. Bissonnette, A.J. Sexstone, J.G. Coleman, K. Garbutt and J.G. Skousen, “ Fate of physical, chemical, and microbial contaminants in domestic wastewater following treatment by small constructed wetlands”, Wat. Res., vol.37, 2003, pp. 921–927. doi:10.1016/S0043-1354(02)00377-9 R.H.,Kadlec, R.L., Knight, Treatment Wetlands. CRC Press/Lewis Publishers, Boca Raton, FL. 1996 R.H., Kadlec, S.D., Wallace, Treatment Wetlands, 2nd ed. CRC Press, Boca Raton, FL, 2008 R. H., Kadlec, “Comparison of free water and horizontal subsurface treatment wetland”, Ecol. Eng., vol. 35, 2009, pp. 159–174. DOI: 10.1016/j.ecoleng.2008.04.008 U., Mander, W.J., Mitsch, 2009 “Pollution control by wetlands”, Ecol. Eng., vol 35, 2009, pp. 153–158, DOI: 10.1016/j.ecoleng.2008.10.005 T., Manios, E.I., Stentiford, P., Millner “The removal of chemical oxygen demand from primary-treated domestic wastewater in surfaceflow reed beds using different substrates”, Water Environment Research, vol. 75(4), 2003, pp. 336–341 G. Merlin, J.-L. Pajean, T. Lissolo, Hydrobiologia, vol. 469 (2002), pp. 87–98. Z. Milán, E. Sánchez, P. Weiland, R. Borjia, A. Martin, A. Ilangovan, “Influence of different natural zeolite concentrations on the anaerobic digestion of piggery waste” Bioresour. Technol, vol 80, 2001, pp. 37– 43. DOI: 10.1016/S0960-8524(01)00064-5 M. Noori, M. Zendehdel, A. Ahmadi, Toxicol. Environ. Chem, vol. 88 (2006), pp. 77–84. M., Pansini, “Natural zeolites as cation exchangers for environmental protection”, Miner Depos, vol. 31, 1996, pp. 563–75, S.K. Pitcher, R.C.T. Slade and N.I. Ward, Science of the Total Environment, “Heavy metal removal from motorway stormwater using zeolites”, vol.334– 335, 2004, pp. 161–166 DOI: 10.1016/j.scitotenv.2004.04.035 S.C., Reed, R.W., Crites, and E.J.,Middlebrooks, Natural Systems for Waste Management and Treatment. Second Edition. McGraw-Hill, Inc., Sydney, 1995 A.I. Stefanakis, S, Christo, Akratos, D. Georgios, Gikas, Vassilios A. Tsihrintzis.” Effluent quality improvement of two pilot-scale, horizontal subsurface flow constructed wetlands using natural zeolite (clinoptilolite)”, Microporous and Mesoporous Materials , vol. 124, 2009, pp. 131–143, DOI: 10.1016/j.micromeso.2009.05.005 A.,Tuszynska, H.Obarska, Pempkowiak,” Dependence between quality and removal effectiveness of organic matter in hybrid constructed wetlands”, Bioresource Technology, vol. 99 (2008), pp. 6010–6016, doi: DOI: 10.1016/j.biortech.2007.12.018 J.,Vymazal, “The use constructed wetlands with horizontal subsurface flow for various types of wastewater”, Journal of Ecological Engineering, vol. 35, (2 0 0 9 ), pp. 1–17, DOI: 10.1016/j.ecoleng.2008.08.016 J.,Vymazal, “Removal of nutrients in various types of constructed wetlands”, Science of The Total Environment Journal, vol.380 (2007), pp.48-65, DOI: 10.1016/j.scitotenv.2006.09.014
Figure 2. Mean value of conductivity removal in zeolite and gravel HFCW at 4 and 3 days HRT
(a)
(c)
(b)
(d)
Figure3. Mean value of various parameters for zeolite and gravel HFCW units at 4 and 3 days HRT (a) COD removal, (b) NH4-N removal, (c) TP removal (d) TN removal
23