dure for use in real-time synchronous brain computer interfaces (BCI)is ... A support vector machine (SVM) algorithm has been applied to classify ..... 365. ESANN'2007 proceedings - European Symposium on Artificial Neural Networks.
ESANN'2007 proceedings - European Symposium on Artificial Neural Networks Bruges (Belgium), 25-27 April 2007, d-side publi., ISBN 2-930307-07-2.
Electroencephalogram signal classification for brain computer interfaces using wavelets and support vector machines Francesc Benimeli and Ken Sharman Instituto Tecnol´ ogico de Inform´ atica - Complex Adaptive Systems Camino de Vera s/n, 46071 Valencia - Spain Abstract. An electroencephalogram (EEG) signal classification procedure for use in real-time synchronous brain computer interfaces (BCI)is proposed. The features used to perform the classification consist in the coefficients of a discrete wavelet transform (DWT) computed for each trial. A support vector machine (SVM) algorithm has been applied to classify the resultant feature vectors. Some experimental results obtained from the experimental application of the proposed procedure to the classification of two mental states are presented.
1
Introduction
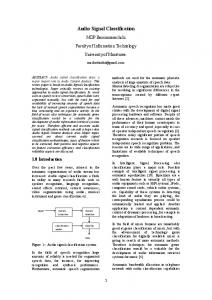
BCI systems reveal as a promising solution which could both alleviate some of the communication problems affecting severely impaired people and improve the general interaction of humans with computers [1, 2]. EEG stands out as the mostly applied technique in order to implement a BCI system specially due to its non-invasiveness, ease of application and comparatively low cost of the equipments [3, 4]. Different types of EEG signals have been applied in order to predict the user intend. Some of them are induced as a response to a presented stimulus, like evoked potentials or slow cortical potentials, which are used in synchronous BCI systems, while others are spontaneously produced by the brain, as μ or β rhythms, which, despite having also been applied for synchronous systems, offer the possibility of designing an asynchronous BCI system [5, 6, 7]. In the latter case, several types of features can be extracted from the signals, namely in time, frequency or joined time-frequency domain [8, 9]. In this work, the μ and, specially, β rhythms have been used in order to extract time-frequency domain features in the form of DWT coefficients. An algorithm has been designed in order to automatically reject data affected by EOG artifacts. Time filtering, downsampling and DWT are the only processing steps applied to measured data before classification by means of a SVM algorithm, which, together with the computational performance of the involved algorithms, makes the procedure suitable for application to a real-time BCI system. Fig.1 shows the main steps of the process. The paper has been structured as follows. In section 2, the BCI system used in the experiments is described and the processing of the acquired signals, previous to the feature extraction and classification , which is described in section 3, is shown. Section 4 shows some results obtained from the experimental ap-
361
ESANN'2007 proceedings - European Symposium on Artificial Neural Networks Bruges (Belgium), 25-27 April 2007, d-side publi., ISBN 2-930307-07-2.
Fig. 1: Diagram of the steps involved in the applied classification procedure. plication of the process described. Finally, section 5 collects some conclusions from this work, as well as some future work.
2
Data Processing
This work is based on a real-time synchronous BCI system constituted by a personal computer (PC), which provides the interaction with the user, as well as a all necessary actions for the EEG signal processing and SVM classification, and an ActiveTwo signal acquisition system from Biosemi1 controlled by means of a modified version of the ActiView acquisition software. The ActiveTwo system is constituted by an electrode cap, in order to facilitate the distribution of the 16 active electrodes applied over the scalp according to the 10-20 international electrode positioning system, an analog-to-digital converter (AD-Box) and a USB2 receiver. The EEG signals are originally acquired with a sample frequency fs = 2048Hz, although this is later reduced per software. The use of the active electrodes allows a reduction of the time required for setting up the system as no special care must be taken to ensure and check for low impedance values in the electrode-skin contacts. As no skin rubbing is necessary, the process is also more comfortable for the user of the system. During a typical training session, the user sits in front of a PC screen at an approximate distance of 1.5 m [10]. The session is divided in a sequence of trials performed randomly for each one of the mental states considered. Each trial is structured according to the following phases: Fixation Time (1 s), during which a grey rectangle is shown on the screen, Acoustic Signal (0.5 s), Indication Presentation (2.5 s) on the screen according to the mental state which the user is intended to generate, eventually Feedback Presentation (1 s), in the case of a training session with feedback, and Pause between trials, a random time between 0.5 and 2.5 s in order to prevent adaption of the user. A signal band-pass filtering is applied in order to restrict the content of the measured signals to the frequency range of interest. In order to take profit of the signal continuity, the filtering process is applied before the trial data extraction. In the present application, the EEG signals are filtered with a band-pass filter, implemented as an 8-th order inverse Chebyshev high-pass filter with a cut-off frequency of 1Hz and a 9-th order inverse Chebyshev low-pass filter with a cut-off frequency of 49Hz, which includes the whole frequency spectrum where EEG features susceptible of being used for mental state classification can appear. The applied procedure remains, in principle, open to the use of both low 1 http://www.biosemi.com
362
ESANN'2007 proceedings - European Symposium on Artificial Neural Networks Bruges (Belgium), 25-27 April 2007, d-side publi., ISBN 2-930307-07-2.
frequency features such as SCP (slow cortical potentials) and higher frequency features such as ERDS (event related desynchronization and synchronization). After processing the status channel, a downsampling of the data corresponding to each trial and channel is performed so as to reduce both the computation time and the size of the obtained feature vectors. The downsampling factor must be determined according to the original sampling rate and the applied time filtering. Considering the trials selected above, channels Fp1 and Fp2, both located near the eyes, are referenced and analyzed by means of the following algorithm in order to detect possible interferences in the EOG activity in the form of abrupt changes in the measured potentials, V, which exceed a certain previously selected threshold. Fa st = 0 ; Slow = avg (V ( 1 : 1 0 ) ) ; for i =1:n Fa st = Fa st ∗ 0 . 8 + (V−Slow ) ∗ 0 . 2 ; Slow = Slow ∗ 0 . 9 7 5 + V∗ 0 . 0 2 5 ; i f | Fa st |> e y e B l i n k T h r e s h o l d rejectSegment ; end end The trials affected by this phenomenon are removed from the data matrices, thus not being considered in the later analysis. Also channels Fp1 and Fp2 are eliminated from the data matrix after the EOG detection process.
3
Feature Extraction and Classification
The application of a wavelet transform allows us to obtain a time-frequency representation of the signal, which provides better insight in the frequency distribution of the signal with time. In a DWT, the scale values for which the transform is computed must be necessarily powers of 2. The feature vectors to be used in the process are the coefficients of the DWT computed for each trial. During the classification phase each one of them is assigned to a certain label or mental state. In this work, the SVM algorithm LIBSVM 2.8 has been applied to perform the classification. This kind of algorithms presents some advantages with respect to other classifiers [11], being one of the most important its high generalization capacity for a reduced number of training trials. The classification implies the resolution of an optimization problem like the following [12]: l
min
w,b,ξ
subject to
� 1 T w w+C ξi 2 i=1 � � yi wT φ (xi ) + b ≥ 1 − ξi ,
363
ξi ≥ 0
ESANN'2007 proceedings - European Symposium on Artificial Neural Networks Bruges (Belgium), 25-27 April 2007, d-side publi., ISBN 2-930307-07-2.
where (xi , yi ) is a pair instance-label in a training set i = 1, . . . , l, xi ∈ Rn and T yi ∈ {0, 1}l; φ is the function defining the kernel K (xi , xj ) = φ (xi ) φ (xj ) and C > 0 is the penalty parameter of the error term. The SVM algorithm requires a training phase in which the feature vectors generated for a series of trials a provided, together with the corresponding class identifiers, or labels, in order to obtain a model which can separate the different classes considered. As recommended in the literature about SVM [12, 11], and like in other types of classification algorithms based on neural networks, the feature vectors are individually scaled into the range, −1..1. In some cases, it has also been observed that a later normalization of the feature vectors also yields a slight further accuracy improvement. In the classification phase, the acquired model is applied to identify the class corresponding to the feature vectors generated for new trials. In particular, a linear kernel with a penalization constant equal to one has been used.
4
Experimental Results
The following classification experiments were performed starting from data obtained in three different training sessions with respectively a total of 128, 161 and 172 trials. Applying the procedure described in section 2, data corresponding to right (R) and left (L) labels were extracted. The trial length was selected as 576 samples starting 64 samples before the presentation of the cue to the user, so that 512 samples (0,25 s) correspond to the actual mental process to be classified. A downsampling factor of 8 was selected, hence being the final sampling rate 256 Hz. After downsampling, each trial will thus contain 72 samples per channel. An algorithm was applied to identify and suppress trials affected by eye blink artifacts. After removing channels Fp1 and Fp2 and referencing, the DWT was computed for each data trial. In particular, a daubechy 4 wavelet was applied to perform the DWT. The best prediction results have been obtained when considering only levels 4 and 5 of the DWT, which fairly correspond, for this wavelet type, to frequencies 11.4286 Hz and 5.71429 Hz. Fig. 2, corresponding to the first training session, show a graphical representation of the DWT coefficients computed for the average over trials of each label. A comparison is established between left IM (upper graphs) and right IM (bottom graphs) for EEG channels P3 and C3, on the left side, P4 and C4, on the right side, and Cz, on the center of the scalp. In Table 1, the results obtained using the coefficients of the discrete wavelet transform with daubechies 4 wavelets from the gsl library for windows are shown. The considerations pointed out in [13] suggest that this type of wavelets is the most adequate in this library for analysis of EEG signals. Data sets from the three training sessions are applied alternatively as training and test sets. The cross-validation results were obtained for each data set using 10 data subsets
364
ESANN'2007 proceedings - European Symposium on Artificial Neural Networks Bruges (Belgium), 25-27 April 2007, d-side publi., ISBN 2-930307-07-2.
Fig. 2: DWT graphical representation using average over trials for the first training session. and 20 runs. Table 2 show the corresponding results when using directly the time domain samples as feature vectors. As can be seen, accuracy is in general significantly reduced. Training Set Session 1 Session 2 Session 3
Session 1 97.71 84.73 74.05
Session 2 83.93 99.41 83.93
Test Set Session 3 79.26 85.11 98.94
Cross-Validation 75.46 ± 2.19 85.91 ± 1.34 88.22 ± 1.78
Table 1: Accuracy results with DWT coefficients (daubechies 4 wavelets).
Training Set Session 1 Session 2 Session 3
Session 1 100.00 74.81 74.81
Session 2 79.76 100.00 71.43
Test Set Session 3 75.00 71.28 100.00
Cross-Validation 68.62 ± 2.17 84.63 ± 2.16 80.47 ± 1.91
Table 2: Accuracy results with time domain samples.
5
Conclusions
In this work, a procedure for EEG signal classification on a synchronous BCI system has been proposed and a description of the experimental procedure and the methodology for signal processing, feature extraction and classification has been presented. Some accuracy results obtained from its experimental application allow the validation of the proposed classification procedure. As can be observed, the cross-validation prediction errors for the second and third sessions are respectively under 15% and 12%. Although the classification has been performed using two mental states, the extension to additional mental states is straight forward.
365
ESANN'2007 proceedings - European Symposium on Artificial Neural Networks Bruges (Belgium), 25-27 April 2007, d-side publi., ISBN 2-930307-07-2.
References [1] Jonathan R. Wolpaw, Nils Birbaumer, Dennis J. McFarland, Gert Pfurtscheller, and Theresa M. Vaughan. Brain-computer interfaces for communication and control. Clinical Neurophysiology, pages 767–791, MAR 2002. [2] Touradj Ebrahimi, Jean-Marc Vesin, and Gary Garcia. Brain-computer interface in multimedia communication. IEEE Signal Processing Magazine, pages 14–24, JAN 2003. [3] Tao Wang, Jie Deng, and Bin He. Classifying EEG-based motor imaginery tasks by means of time-frequency synthesized spatial patterns. Clinical Neurophysiology, 115(12):2744– 2753, DEC 2004. [4] G. Dornhege, B. Blankertz, G. Curio, and K.-R. Muller. Boosting bit rates in noninvasive EEG single-trial classifications by feature combination and multiclass paradigms. IEEE Transactions on Biomedical Engineering, 51(6):993–1002, JUN 2004. [5] George Townsend, Bernhard Graimann, and Gert Pfurtscheller. Continuous EEG classification during motor imaginery-simulation of an asynchronous BCI. IEEE Transactions on Neural Systems and Rehabilitation Engineering, 12(2):258–265, JUN 2004. [6] G. Pfurtscheller, C. Brunner, A. Schl¨ ogl, and F.H. Lopes da Silva. Mu rhythm (de)synchronization and EEG single-trial classification of different motor imagery tasks. NeuroImage, 31:153–159, 2006. [7] Dennis J. McFarland and Jonathan R. Wolpaw. Sensorimotor rythm-based braincomputer interface (BCI): Feature selection by regression improves performance. IEEE Transactions on Neural Systems and Rehabilitation Engineering, 13(3):372–379, SEP 2005. [8] George E. Fabiani, Dennis J. McFarland, Jonathan R. Wolpaw, and Gert Pfurtscheller. Conversion of EEG activity into cursor movement by a brain-computer interface (BCI). IEEE Transactions on Neural Systems and Rehabilitation Engineering, 12(3):331–338, SEP 2004. [9] V Bostanov and B Kotchoubey. The t-CWT: A new ERP detection and quantification method based on the continuous wavelet transform and Student’s t-statistics. Clinical Neurophysiology, pages 1388–2457, Oct 2006. [10] Gert Pfurtscheller and Christa Neuper. Motor imaginery and direct brain-computer communication. In Proceedings of the IEEE, volume 89, pages 1123–1134, JUL 2001. [11] Shigeo Abe. Support Vector Machines for Pattern Classification. Advances in Pattern Recognition. Springer, 1st edition, JUL 2005. [12] Chih-Wei Hsu, Chih-Chung Chang, and Chih-Jen Lin. A practical guide to support vector classification. Technical report, Department of Computer Science and Information Engineering, National Taiwan University, 2003. [13] Elena L. Glassman. A wavelet-like filter based on neuron action potentials for analysis of human scalp electroencephalographs. IEEE Transactions on Biomedical Engineering, 52(11):1851–1862, NOV 2005.
366